
Effects of logging intensity on restoration of carbon density in broadleaved Korean pine forest ecosystem
-
摘要:目的 通过对不同采伐强度干扰阔叶红松林生态系统碳密度的估算,探讨其伐后30年的恢复状况,解析采伐强度、生态系统各组分碳密度及其与林分结构间的关系,为以生态系统碳汇功能提升和物种多样性保护等为目标的森林经营提供科学依据。方法 以汪清林业局不同采伐强度干扰的阔叶红松林为对象,通过对未采伐和Ⅰ级(30%)、Ⅱ级(40%)、Ⅲ级(50%)、Ⅳ级(60%以上)、Ⅴ级(皆伐)采伐强度干扰林分植被、枯落物和土壤特征的调查和样品采集与测试分析,系统估算其植被、枯落物和土壤的碳密度,并对比分析其差异,以及他们之间及其与采伐强度、林分结构之间的关系。结果 虽经30年的恢复,因采伐强度的显著负效应影响,阔叶红松林的植被碳密度仍显著低于对照,但在除皆伐外的其他采伐强度之间已恢复至无差异水平。虽然伐后林分乔木层碳密度的小径级和中小径级林木比例有一定程度的增加,但仍无法弥补40 cm以上大径林木的碳密度损失;幼树和草本植物的碳密度受采伐强度的影响不显著;灌木植物的碳密度与采伐强度呈极显著的正相关,但仅皆伐干扰显著增加。皆伐干扰显著降低了枯落物和B层土壤的碳密度,而其他采伐强度的土壤碳密度则因B层的增加而整体接近或高于对照林分。与对照相比,皆伐和Ⅰ、Ⅱ级采伐强度干扰的生态系统碳密度显著降低,Ⅲ、Ⅳ级采伐强度干扰的生态系统碳密度则分别恢复为与之接近和略高。生态系统碳密度的组成以土壤的碳密度占比最高,冠下植被和枯落物的碳密度合计不足生态系统碳密度的3%。采伐强度对树高均匀度指数、胸径香农指数和胸径均匀度指数的负效应仍显著,林分结构对乔木层碳密度产生了显著的正效应,对灌木植物碳密度为显著的负效应。受采伐的强烈负效应影响,乔木层碳密度与灌木植物的碳密度、枯落物碳密度、草本植物丰富度,以及枯落物碳密度与土壤碳密度和草本植物丰富度间均存在显著的相关关系。结论 阔叶红松林伐后30年,除皆伐干扰外的生态系统碳密度已基本接近或超过未采伐林分,碳密度的恢复主要源于土壤相对快速的累积,而植被的碳密度损失还尚需一定时间的恢复。采伐强度、生态系统各组分碳密度及其与林分结构间存在着显著的相关关系,主要动因为采伐负效应引起的林分结构改变,导致了乔木层、冠下植被、枯落物和土壤的联动变化。Abstract:Objective Based on the estimation of ecosystem carbon density in broadleaved Korean pine forest disturbed by different logging intensities, the recovery status of the forest after 30 years of logging was discussed, and the relationship among logging intensity, composition of ecosystem carbon density, and stand structure was analyzed to provide a scientific basis for forest management, aiming at enhancing ecosystem carbon sink function and protecting species diversity.Method The current study took the broadleaved Korean pine forest disturbed by different logging intensities in Wangqing Forestry Bureau, Jilin Province of northeastern China as the research object. The vegetation, litter and soil characteristics of different logging disturbance stands, unharvested, class Ⅰ (30%), class Ⅱ (40%), class Ⅲ (50%), class Ⅳ (above 60%) and class Ⅴ (clear cut), were investigated and analyzed, and the carbon densities of vegetation, litter and soil were systematically estimated, and their differences were also compared and analyzed, as well as their relationship with logging intensities and stand structure.Result Although the broadleaved Korean pine forest disturbed by different logging intensities had been restored for 30 years, its vegetation carbon density was still significantly lower than that of the control sample plots due to the significant negative effect of logging, but the carbon density had recovered to no significant difference between different logging intensity sample plots, except for clear-cutting. The tree layer carbon densities of disturbed stands with different logging intensities increased to a certain extent in the small- and medium-small-diameter trees, but it still could not make up for the carbon density loss of the large-diameter trees above 40 cm. The carbon densities of young trees and herbs were not significantly affected by logging intensity, but the carbon density of shrub plants was significantly positively correlated with logging intensity and only the disturbance of clear cutting increased significantly. Clear-cutting disturbance significantly reduced the carbon density of litter and soil layer B, while the soil carbon densities of other logging intensities were generally close to or higher than that of control stands due to the increase of soil carbon density of layer B. Compared with the control groups, the ecosystem carbon densities disturbed by clear cutting, class Ⅰ and class Ⅱ logging intensities decreased significantly, while the ecosystem carbon densities disturbed by class Ⅲ and class Ⅳ logging intensities were close to and slightly higher than control, respectively. In the composition of ecosystem carbon density, the proportion of soil carbon density was the highest, and the total proportion of under-canopy vegetation and litter was less than 3%. The negative effects of logging intensities on tree height uniformity index, DBH Shannon index and DBH uniformity index were still significant, and the change of stand structure had a significant positive effect on carbon density of tree layer, but it had a significant negative effect on the carbon density of shrubs. Affected by the strong negative effect of logging, tree layer carbon density was significantly correlated with shrub carbon density, litter carbon density, and herb richness. Moreover, there were also significant correlations between litter carbon density and soil carbon density and herb richness.Conclusion After 30 years of logging disturbance in broadleaved Korean pine forests, the carbon density of ecosystems has basically recovered or exceeded the level of unharvested stands, except for clear-cutting, and the recovery of carbon density is mainly due to the relatively rapid accumulation of soil carbon, while the loss of vegetation carbon density still needs more time to recover. The negative effect of logging causes the change of stand structure, leading to the linkage changes of arbor layer, under-canopy vegetation, litter and soil, therefore, there are significant correlations among logging intensities, ecosystem carbon density and stand structure.
-
Keywords:
- broadleaved Korean pine forest /
- logging disturbance /
- ecosystem /
- carbon density /
- stand structure
-
近自然森林经营理论是经过了法正林−恒续林−近自然森林经营一百多年的不断发展而形成的[1],是实现森林可持续经营的有效途径。目标树经营是近自然经营的主要技术体系,把所有林木分类为目标树、特殊目标树、干扰树和其他树木等4种类型[2]。目标树经营的核心技术体系是以选择的目标树为培育对象,通过采伐干扰树来实现林地的综合效益。国外已经开展了很多关于目标树经营的实践和研究[3],国内由于开展时间较晚,干扰树采伐对林分的影响研究较少,目前针对传统采伐对林分的影响研究较多[4−6]。
森林生长的周期很长,一些传统特征指标,如蓄积、生长量等对森林经营措施的响应较慢,而空间结构是森林经营过程可以调控的因子[7],通过对空间结构的影响研究可以及时反映出经营效果,为森林精准经营提供基础。森林空间结构在很大程度上决定了森林发展的状态、林分稳定性和经营空间的大小[8],目前国际上模拟森林经营的主要研究内容之一便是空间结构的分析和比较。国内外针对目标树经营效果的研究主要集中在一些传统指标上[9−14],对空间结构的研究尚不多见。
森林空间结构指标的研究较多,许多学者选取不同的指标研究了林分空间结构对环境因素以及人类经营活动的响应[15−16]。然而选择的指标不同,关注的角度就不同,在评判空间结构的优劣时得出的结论可能不一致[17−18]。因此选取合适的指标,并实现各个空间结构要素之间的联立,构建一个定量化综合指标来对林分空间结构进行综合分析,才能对森林空间结构进行更为客观全面的描述,从而为经营决策提供准确依据。
蒙古栎(Quercus mongolica)属壳斗科(Fagaceae)栎属(Quercus)植物,又称柞木、柞树,在我国主要分布于东北和华北地区,是我国温带地区落叶阔叶林及针阔混交林的主要树种[19−22]。相关研究发现,栎属树种平均生长季的日用水量明显低于其他树种[23],许多栎属树种能适应较温暖和更加极端的气候,在森林经营中,栎类的生态学和经济学地位很可能会因此得以提升[24−26]。殷晓洁等[27]研究发现未来气候变化将使蒙古栎的地理分布范围扩大,成为我国大兴安岭和小兴安岭最主要的树种。但由于人们对蒙古栎的生长特性认识不足,而且大部分蒙古栎林的现实林分生长不良,没有充分发挥其多种效益。蒙古栎次生林在我国分布面积很大,如何通过经营来改善其林分状况,实现其经济价值和生态效益具有重要意义。
基于以上因素,本研究采取基于相邻木关系的混交度(M)、大小比数(U)、角尺度(W)和密集度(C)等4个常用的林分空间结构指标,构建空间结构综合指数(comprehensive spatial structure index,CSSI)。以吉林省汪清林业局塔子沟林场蒙古栎次生林传统经营和目标树经营样地为研究对象,分别采用4个空间结构指标以及CSSI从目标树水平和林分水平分析了基于目标树经营的抚育间伐与传统抚育间伐对蒙古栎次生林空间结构的影响,以期为蒙古栎次生林的空间结构优化和确定合理目标树选择密度提供借鉴。
1. 材料与方法
1.1 研究地区概况
研究区位于吉林省延边朝鲜族自治州汪清林业局塔子沟林场,地形以低山丘陵为主,地理坐标为129°56′ ~ 131°04′E,43°05′ ~ 43°40′N。该区属于温带大陆性季风气候,年均气温3.9 ℃,年平均降水量500 ~ 600 mm,且主要集中在夏季。研究区森林覆盖率达到90%以上,主要乔木树种有蒙古栎、红松(Pinus koraiensis)、白桦(Betula platyphylla)、黑桦(Betula dahurica)、大青杨(Populus ussuriensis)、色木槭(Acer mono)、长白落叶松(Larix olgensis)、紫椴(Tilia tuan)、臭冷杉(Abies nephrolepis)、春榆(Ulmus japonica)、水曲柳(Fraxinus mandschurica)等。主要灌木树种有:山葡萄(Vitis amurensis)、毛榛(Corylus mandshurica)、暴马丁香(Syringa reticulata var. amurensis)、五味子(Schisandra chinensis)、忍冬(Lonicera japonica)、刺五加(Acanthopanax senticosus)等。
1.2 数据来源
在吉林省汪清林业局塔子沟林场选取林分条件相对一致的蒙古栎次生林,设置9块面积为1 hm2(100 m × 100 m)的试验样地,并用森林罗盘仪将每块样地划分100个10 m × 10 m的网格单元。在每个网格单元内,对胸径5 cm以上的树木进行了每木调查,记录树种,测量胸径、树高、枝下高、东西南北冠幅、林木健康状况等因子,并利用徕卡激光测距仪测定每木的坐标(X,Y)。选取的样地林分均处于中龄林阶段,主林层蒙古栎的林龄介于40 ~ 70年之间。样地基本概况和林分基本信息见表1和表2。
表 1 样地基本概况Table 1. General description of sample plot样地号
Sample plot No.海拔
Altitude/m坡位
Slope position坡度
Slope gradient/(°)郁闭度
Canopy density密度/(株·hm− 2)
Stand density/(tree·ha− 1)树种组成
Species composition处理
Treatment1 705 中 Middle 8 0.70 766 6蒙1桦1杨1红1其他 T1 2 738 中 Middle 8 0.71 896 4蒙2杨1桦1色1椴1红 T2 3 721 中 Middle 7 0.72 1 038 5蒙2桦1色1杨1椴 T3 4 741 中 Middle 8 0.83 992 4蒙2桦1色1椴1红1其他 T2 5 637 中 Middle 8 0.85 998 5蒙2桦1红1黑1其他 T1 6 635 中 Middle 8 0.88 1 047 5蒙3桦1黑1红 T3 7 677 中 Middle 7 0.90 800 6蒙1黑1胡1水1其他 T1 8 685 中 Middle 7 0.77 929 6蒙2桦1黑1其他 T3 9 703 中 Middle 6 0.87 995 4蒙3桦1杨2其他 T2 注:蒙代表蒙古栎,桦代表白桦,杨代表大青杨,红代表红松,色代表色木槭,椴代表紫椴,落代表长白落叶松,黑代表黑桦,胡代表胡桃楸,水代表水曲柳,其他代表其他树种。Notes: 蒙 stands for Quercus mongolica, 桦 stands for Betula platyphylla, 杨 stands for Populus ussuriensis, 红 stands for Pinus koraiensis, 色 stands for Acer mono, 椴 stands for Tilia tuan, 落 stands for Larix olgensis, 黑 stands for Betula dahurica, 胡 stands for Juglans mandshurica, 水 stands for Fraxinus mandschurica, 其他 stands for other tree species. 表 2 蒙古栎次生林林分基本信息Table 2. General information of oak secondary forest样地号
Sample plot No.胸径 DBH/cm 树高 Tree height/m 优势平均高
Mean dominant height/m蓄积
Volume/m3最小 Min. 平均 Average 最大 Max. 最小 Min. 平均 Average 最大 Max. 1 5.0 14.6 66.0 2.0 11.0 29.6 22.2 150.72 2 5.0 13.7 59.1 0.5 11.2 24.1 21.5 162.31 3 5.0 13.0 55.7 1.3 10.25 28.5 21.6 172.00 4 5.0 13.6 50.2 1.5 10.9 25.8 21.2 176.10 5 5.0 13.1 50.9 1.5 8.9 22.4 21.5 162.30 6 5.0 12.8 58.5 3.2 11.5 31.1 22.2 173.91 7 5.0 14.3 52.2 1.4 9.8 24.9 21.8 154.45 8 5.0 14.3 70.1 3.1 12.6 24.2 22.9 179.20 9 5.0 14.1 58.2 2.2 11.0 26.5 22.7 186.90 注:采用汪清林业局一元立木材积表[28]计算单木材积和林分蓄积,选取样地最高的5株林木计算优势高平均值。Notes: volume of wood was calculated by the tree volume table of Wangqing Forestry Bureau, and the mean dominant height was calculated by choosing five highest trees in each sample plot. 在完成上述因子调查后采取完全随机区组设计,确保随机区组后各组林分的基本特征没有显著差异。试验设置3种处理,3次重复,共9块固定监测样地。3种处理包括:(1)传统经营,即T1处理(1、5、7号样地),遵循《森林抚育规程》(GB/T15781-2009)的规定进行抚育间伐设计,采伐强度控制在25%以下,采伐对象主要是生长不良的林木,伐后郁闭度在0.6以上;(2)目标树经营密度1,即T2处理(2、4、9号样地),按照目标树单株木集约经营理念制定采伐设计,用材目标树选取密度约为70株/hm2,将影响目标树生长的林木确定为干扰木并进行采伐;(3)目标树经营密度2,即T3处理(3、6、8号样地),用材目标树选取密度为100株/hm2,其余措施与T2一致。采伐前林木分布如图1所示。干扰树采伐与传统采伐的根本区别在于采伐对象不同,常规采伐主要是针对没有培育前途的林木,多是林分中密度过大,质量低劣的林木,而干扰树采伐的对象是影响用材目标树生长的林木,可能是林层中的优势木和亚优势木,对不影响目标树生长的其他林木不采取任何措施。
考虑到样地边缘林木的相邻木可能处于边界以外,空间结构单元并不完整[29],为消除边缘效应,将样地距离边界线5 m以内的林木作为缓冲区林木,只作为相邻木来参与计算。其他区域视为核心区(90 m × 90 m),计算核心区内每株林木的空间结构参数。本研究以任一中心木和其周围的4株最近的相邻木组成空间结构单元,以此来计算空间结构指标[30]。
1.3 分析方法
1.3.1 空间结构综合指数
森林空间结构的研究主要集中在3个方面[31]:(1)树种空间隔离程度,即不同树种的混交程度;(2)林木间的竞争状况,也即立木的大小差异程度和密集程度;(3)林木的空间分布格局,也即林木在地面上的空间分布形式,这3个方面构成了森林结构的三要素。目前评价林分空间结构的指标很多,但许多指标之间存在重复,综合计算时难以科学界定权重。一些学者提出了基于相邻木关系的混交度(M)、大小比数(U)和角尺度(W)3个指标,这3个指标便于计算,可以较完整的表达出单木和林分的空间结构,在国内外应用广泛,效果较好[32−36]。但这3个指标都与距离无关,假如2株参照木周围分布的相邻木在树种混交、大小差异程度以及空间分布形式上均一致,但相邻木与参照木的距离不同,这时如果只采用这3个指标就会对空间结构造成误判,误认为2株参照木的空间结构一致。为解决这一问题,胡艳波等[37]在基于空间结构单元的基础上,提出了密集度(C)的概念。密集度直观表达了林分的疏密程度,也反映了林木间的竞争情况。
本文采用以上4个指标,在董灵波等[38]提出的天然林空间结构指数的基础上进行了修改。以W、U、M和C为“投入”,将林分的空间结构作为“产出”构建了空间结构综合指数(CSSI)。结合4个空间结构指标的定义,可以认为林分的M越大,U和C越小,角尺度中等的条件下林分的空间结构最佳(CSSI = 100),鉴于U和C均是体现林木竞争关系的指标,因此两者权重各取50%来作为“投入”。函数表达式如下:
CSSI=3√¯M(100−2×|¯W−50|)×√(100−¯U)(100−¯C) (1) 式中:
CSSI 为空间结构综合指数,¯M 、¯W 、¯U 、¯C 分别为林分平均混交度、平均角尺度、平均大小比数和平均密集度。本研究中0 ≤ CSSI ≤ 100,0 ≤¯M ≤ 100,0 ≤¯U ≤ 100,0 ≤¯W ≤ 100,0 ≤¯C ≤ 100。1.3.2 混交度
本研究采用混交度(M)表示树种空间隔离程度,其概念是由Gadow[39]和Füldner[40]提出的,定义为参照树i周围4株相邻木j中与其不是同一树种的个体所占的比例。认为林分的稳定性与M呈正相关关系。计算公式如下[8]:
Mi=144∑j=1vij (2) 式中:
Mi 为第i株个体的混交度,vij 表示参照木与相邻木的树种是否相同,如相同,则vij = 0;反之则为1。林分的平均混交度
¯M 计算公式如下:¯M=1NN∑i=1Mi (3) 式中:
N 为林分中消除边缘效应后的有效个体数量。1.3.3 角尺度
本研究选用角尺度(
W )来对林木空间分布格局进行计算,角尺度表示参照树i 周围的相邻木的均匀性,其定义是任意两株相邻木与参照木构成的夹角α小于标准角α0(α0 = 72°)的个数占相邻木(n )的比例,公式如下[41−43]:Wi=1nn∑j=1Zij (4) 式中:
Zij 表示夹角α是否小于标准角α0,当第j 个α角小于标准角α0时,Zij = 1,反之为0。用
¯W 表示林分整体的平均角尺度,当¯W < 0.475时林分为均匀分布,¯W ∈[0.475,0.517]时为随机分布,当¯W > 0.517时为聚集分布。1.3.4 大小比数
本文采用大小比数(
U )来表示林木间的大小差异程度及空间优势程度,选用胸径作为比较指标。计算公式如下[44]:Ui=14n∑j=1kij (5) 式中:
Ui 表示比参照木大的相邻木数量所占4株最近相邻木的比例,kij 表示参照木与相邻木的大小,如果参照木i 比相邻木j 大,那么kij=0 ;反之则为1。由定义可知,Ui 值越小,参照木的优势越明显,林分的平均大小比数用¯U 来表示。1.3.5 密集度
本研究采用密集度(
C )来表示林木的密集程度,其定义为所考察的相邻木与参照木树冠相接的株数的比例,计算公式为[37]:Ci=144∑j=1yij (6) 式中:
yij 表示参照树i与相邻木j的树冠投影是否重叠,重叠时yij 取值为1,反之为0。密集程度的高低反映了林木间的竞争程度,当计算林分密集度时将格局因子考虑进去,计算公式为:
¯C=1nn∑i=1CiλWi (7) 式中:
λWi 为格局权重因子,其赋值由林木的角尺度取值所决定。¯C 值与林分的密集程度呈正相关关系。2. 结果与分析
2.1 目标树结构单元的空间结构指标
T2、T3样地干扰树采伐前后目标树结构单元的混交度(M)、角尺度(W)、大小比数(U)和密集度(C)均值如表3所示。采伐干扰树后,目标树的M平均值提高,空间隔离程度增大,T3的提升幅度略高于T2。T2、T3目标树结构单元的W平均值都大于0.5,干扰树间伐对目标树的W均值影响不大:T3目标树W平均值略有上升,更趋向聚集分布;T2则有所下降,趋近随机分布。表明林木空间分布格局对干扰树采伐的响应具有不确定性。
表 3 采伐前后目标树结构单元的各个空间结构指标Table 3. Spatial structure indexes of target trees before and after thinning抚育间伐方式
Thinning treatment类型
TypeM平均值
Mean uniform angle indexW平均值
Mean neighborhood patternU平均值
Mean uniform angel indexC平均值
Mean crowding degreeT2 伐前 Before thinning 0.615 5 0.529 2 0.184 0 0.415 1 伐后 After thinning 0.638 3 0.524 1 0.177 7 0.409 4 T3 伐前 Before thinning 0.509 9 0.533 2 0.226 7 0.407 4 伐后 After thinning 0.529 7 0.536 0 0.216 7 0.395 3 注:M代表混交度;W代表角尺度;U代表大小比数;C代表密集度;T2代表目标树经营密度1;T3代表目标树经营密度2。下同。Notes: M represents for mingling degree, W represents for uniform angel index, U represents for neighborhood comparison, C represents for crowding degree, T2 represents for target tree management with density 1, T3 represents for target tree management with desity 2. Same as below. 目标树的
U 平均值在0.2左右,这是由于目标树选取的大都是优势木,竞争力较强。目标树结构单元的U 平均值均有一定程度的下降,说明干扰树间伐提高了目标树的空间优势度以及大小分化程度,T3的下降幅度大于T2。目标树结构单元的C 平均值都有所下降,T3下降幅度最大。U 和C 的变化说明干扰树采伐降低了目标树结构单元的竞争压力。2.2 林分树种空间隔离程度
不同抚育间伐方式林分采伐前后M分布及林分平均混交度(
¯M )的变化情况如表4所示。3种抚育间伐后样地中零度混交的林木比例下降,极强度混交的林木比例上升,¯M 都有所提高。其中T3处理后¯M 提升幅度略高于T2,T3和T2处理后¯M 提升幅度均显著高于T1,说明相对于传统经营采取的抚育间伐,以培育目标树为导向的干扰树间伐更有利于提高林分混交度,改善林分树种间隔离程度。表 4 不同抚育间伐方式林分采伐前后M 频率分布及林分平均混交度(¯M )Table 4. M frequency distribution and mean mingling degree of different thinning treatments before and after thinning抚育间伐方式
Thinning treatment伐前 Before thinning 伐后 After thinning 频率分布 Frequency distribution ¯M 频率分布 Frequency distribution ¯M 0.00 0.25 0.50 0.75 1.00 0.00 0.25 0.50 0.75 1.00 T1 0.159 2 0.190 1 0.242 1 0.248 0 0.160 5 0.515 1 0.150 3 0.192 0 0.252 7 0.243 3 0.161 7 0.518 5 T2 0.071 0 0.173 1 0.250 0 0.277 9 0.228 0 0.604 7 0.062 3 0.165 3 0.253 9 0.289 5 0.229 0 0.614 4 T3 0.107 9 0.193 9 0.258 5 0.255 1 0.184 6 0.553 7 0.092 2 0.194 5 0.267 3 0.259 2 0.186 9 0.563 5 注:T1代表传统经营措施。Note: T1 represents for traditional management. 2.3 林分空间分布格局
不同抚育间伐方式林分采伐前后的
W 分布及林分平均角尺度(¯W )的变化情况如表5所示。3种处理下,采伐前后¯W 均大于0.517,说明林分的空间分布格局呈聚集分布。W 取值为0.5的林木比例高于50%,说明大多数林木呈随机分布,3种处理的抚育间伐均降低了林分中绝对聚集分布的林木比例。T1、T2、T3处理采伐后¯W 更靠近随机分布的取值范围,林分空间分布格局趋向合理。3种处理对林分空间分布格局的改善情况为T2 > T3 > T1,其中T2和T3的改善程度显著优于T1。说明相对于传统经营采取的抚育间伐,以培育目标树为导向的干扰树间伐更有利于改善林分的空间分布格局。表 5 不同抚育间伐方式林分采伐前后W 频率分布及林分平均角尺度(¯W )Table 5. W frequency distribution and mean value of stand uniform angel index of different thinning treatments before and after thinning抚育间伐方式
Tninning treatment伐前 Before thinning 伐后 After thinning 频率分布 Frequency distribution ¯W 频率分布 Frequency distribution ¯W 0.00 0.25 0.50 0.75 1.00 0.00 0.25 0.50 0.75 1.00 T1 0.005 9 0.167 8 0.553 3 0.196 1 0.077 0 0.542 6 0.006 7 0.165 1 0.558 6 0.196 8 0.072 8 0.540 9 T2 0.003 6 0.179 9 0.580 9 0.163 7 0.071 9 0.530 1 0.004 2 0.185 0 0.583 6 0.165 3 0.061 8 0.523 9 T3 0.004 9 0.164 2 0.578 2 0.191 4 0.061 2 0.535 0 0.006 1 0.168 0 0.584 5 0.184 3 0.057 0 0.529 5 2.4 林分大小分化程度
不同抚育间伐方式林分采伐前后的
U 分布及林分平均大小比数(¯U )变化情况如表6所示。T1、T2、T3处理的¯U 均接近0.5,说明整体大小分化程度和优势度都接近于中等水平。且U 各个取值的林木分布频率相对一致,都在20%左右。采伐后U 为0的林木比例增加,其他取值的频率分布变化无明显规律。总体上讲,3种抚育间伐对林分的大小分化度影响不大,T1、T3处理后¯U 的大小比数平均值略有下降,T2基本无变化。表 6 不同抚育间伐方式林分采伐前后U 频率分布及林分平均大小比数(¯U )Table 6. U frequency distribution and mean value of neighborhood comparison of different thinning treatments before and after thinning抚育间伐方式
Thinning treatment伐前 Before thinning 伐后 After thinning 频率分布 Frequency distribution ¯U 频率分布 Frequency distribution ¯U 0.00 0.25 0.50 0.75 1.00 0.00 0.25 0.50 0.75 1.00 T1 0.207 2 0.196 1 0.205 9 0.194 7 0.196 1 0.494 1 0.212 3 0.196 8 0.202 2 0.195 4 0.193 4 0.490 2 T2 0.207 7 0.204 6 0.194 2 0.192 0 0.201 4 0.493 7 0.209 8 0.197 2 0.201 4 0.190 6 0.200 9 0.493 9 T3 0.204 6 0.206 5 0.191 9 0.201 2 0.195 8 0.494 3 0.209 8 0.201 6 0.193 0 0.198 6 0.197 0 0.492 9 2.5 林分密集程度
不同抚育间伐方式下林分采伐前后的
C 分布及林分平均密集度(¯C )均值变化情况如表7所示,T1、T2、T3处理样地中C 取值为1.0的树木所占比例最大,说明林木很密集的结构单元较多。3种处理下¯C 都有不同程度的下降,下降幅度从高到底依次是T3、T2、T1。所有样地中C 取值为0、0.25、0.50的林木比例上升,C 取值为1的林木比例下降,说明林分的密集程度得到了改善,由很密集逐渐向比较密集过渡。表 7 不同抚育间伐方式林分采伐前后C 频率分布及林分平均密集度(¯C )Table 7. C frequency distribution and mean value of crowding degree of different thinning treatments before and after thinning抚育间伐方式
Thinning treatment伐前 Before thinning 伐后 After thinning 频率分布 Frequency distribution ¯C 频率分布 Frequency distribution ¯C 0.00 0.25 0.50 0.75 1.00 0.00 0.25 0.50 0.75 1.00 T1 0.059 9 0.138 8 0.166 4 0.221 7 0.413 2 0.338 3 0.063 3 0.140 8 0.175 2 0.217 0 0.403 6 0.336 3 T2 0.021 6 0.072 4 0.141 2 0.216 3 0.548 6 0.391 8 0.023 9 0.078 2 0.158 3 0.221 5 0.518 0 0.389 3 T3 0.018 5 0.074 8 0.163 8 0.221 1 0.521 9 0.384 1 0.021 9 0.080 4 0.183 3 0.235 7 0.478 6 0.378 1 2.6 空间结构综合指数
以上4个森林空间结构指标从不同角度说明了常规经营和目标树经营的抚育间伐对单木及林分的影响,但所得出的最优抚育间伐方式的结论并不统一。因此用空间结构综合指数(CSSI)计算各个指标的综合值,为评判森林经营措施的优劣提供直接依据。图2展示了3种抚育间伐处理下CSSI的变化。
![]() 图 2 林分空间结构综合指数(CSSI)变化情况Figure 2. Changes of comprehensive index of spatial structure (CSSI)
图 2 林分空间结构综合指数(CSSI)变化情况Figure 2. Changes of comprehensive index of spatial structure (CSSI)由图2可以看出,3种抚育间伐措施后,CSSI都得以提高,林分空间结构均有不同程度的优化,说明抚育间伐没有破坏样地中林木的空间结构情况,而是促使其更加合理。T1、T2、T3措施下CSSI的增加量分别为0.51%、1.04%和1.19%,表明基于目标树经营的抚育间伐对林分空间结构的改善情况优于传统抚育间伐,T2处理对林分的优化程度略高于T3。
3. 讨 论
相关研究表明目标树经营对促进林木生长、物种多样性并改善群落结构有积极的作用[45−47]。本研究结果表明干扰树间伐对蒙古栎次生林目标树以及林分的空间结构都有改善作用,且影响效果优于传统的抚育间伐,说明目标树经营是合理且成功的措施,与陈科屹等[48]的研究结果一致。
抚育间伐对目标树及林分林木分布格局的影响并不统一,这与吴建强等[49]的研究结果一致。认为林木分布格局具有一定的规律性,无论初始如何分布,最后都会有聚集分布转为随机分布,随机分布转为均匀分布的趋势[50−51]。大小比数这一空间结构指标在分析目标树抚育间伐前后大小分化程度时变化趋势明显,而抚育间伐前后林分的大小分化程度变化具有一定的不确定性。这与李建等[17]、赵中华等[52]的研究结果一致:大小比数更适合用于研究种群间的大小分化程度,从而确定某个或是几个种群的优势度。
本文中各个指标以及空间结构综合指数的变化幅度不大,且T2、T3差别较小。这可能是由于以下两个方面的原因:(1)研究结果体现的是蒙古栎次生林采伐初期的空间结构状况,部分林分空间结构对抚育间伐的响应需要较长时间;(2)本研究所选取的蒙古栎次生林处于中龄阶段,原则上已经晚于标准的选取目标树的时间,而此时的干扰树也较大,采伐后可能会对林分造成过大的扰动,为避免这种情况,本次抚育间伐的强度均控制在10%以内。对于之前未经过持续间伐的蒙古栎中龄林来说,为目标树生长释放足够的空间可能需要更高的采伐强度。
影响森林空间结构的因素很复杂,指标也很多,目前尚未有大家公认的统一的评价方法。本研究中所构建的林分空间综合指数是基于林分空间结构研究的3个方面和常用的4个指标,且认为林木空间分布格局、林木竞争关系与林分中间隔离程度对空间结构的贡献是相同的,这与董灵波等[38]、李建军等[53]的研究结果相一致,与曾群英等[54]、胡艳波等[55]提出的结构参数的决策优先性不一致。曹小玉等[16]认为林分的垂直结构参数近年来也被广泛研究,但鉴于研究区所在地为温带地区,林层结构相对单一,抚育间伐后的变化微乎其微,因此本研究所采用的空间结构评价指标未考虑垂直结构参数。如何加入其他表征空间结构合理指标,以及这些指标间如何进行联立值得更深入的研究。
本文侧重基于目标树经营和传统经营的抚育间伐对空间结构的初期效应,而这种初期效应可以持续多久,以及不同的抚育间伐方式和强度对森林空间结构和其他特征指标的长期影响,都值得进一步研究,为蒙古栎次生林的经营提供指导和依据。
4. 结 论
从目标树空间结构的变化来看,干扰树采伐后目标树的种间隔离程度、大小分化程度和密集程度3个方面明显改善,林木空间分布格局的变化不明显。从林分的空间结构变化来看,3种抚育间伐均提高了林分内种间隔离程度、降低了密集度,使林分空间分布格局趋向于随机分布。通过空间结构综合指数的分析来看,3种抚育间伐均对林分空间结构的改善起到了积极作用,其中基于目标树经营的抚育间伐对林分的综合空间结构改善效果要优于传统经营的抚育间伐。T3处理,即目标树选择密度约为100 株/hm2情况下采取的抚育间伐最有利于优化林分的空间结构,据此建议蒙古栎次生林可以选择目标树经营体系作业,目标树选择密度约为100 株/hm2。
-
![]()
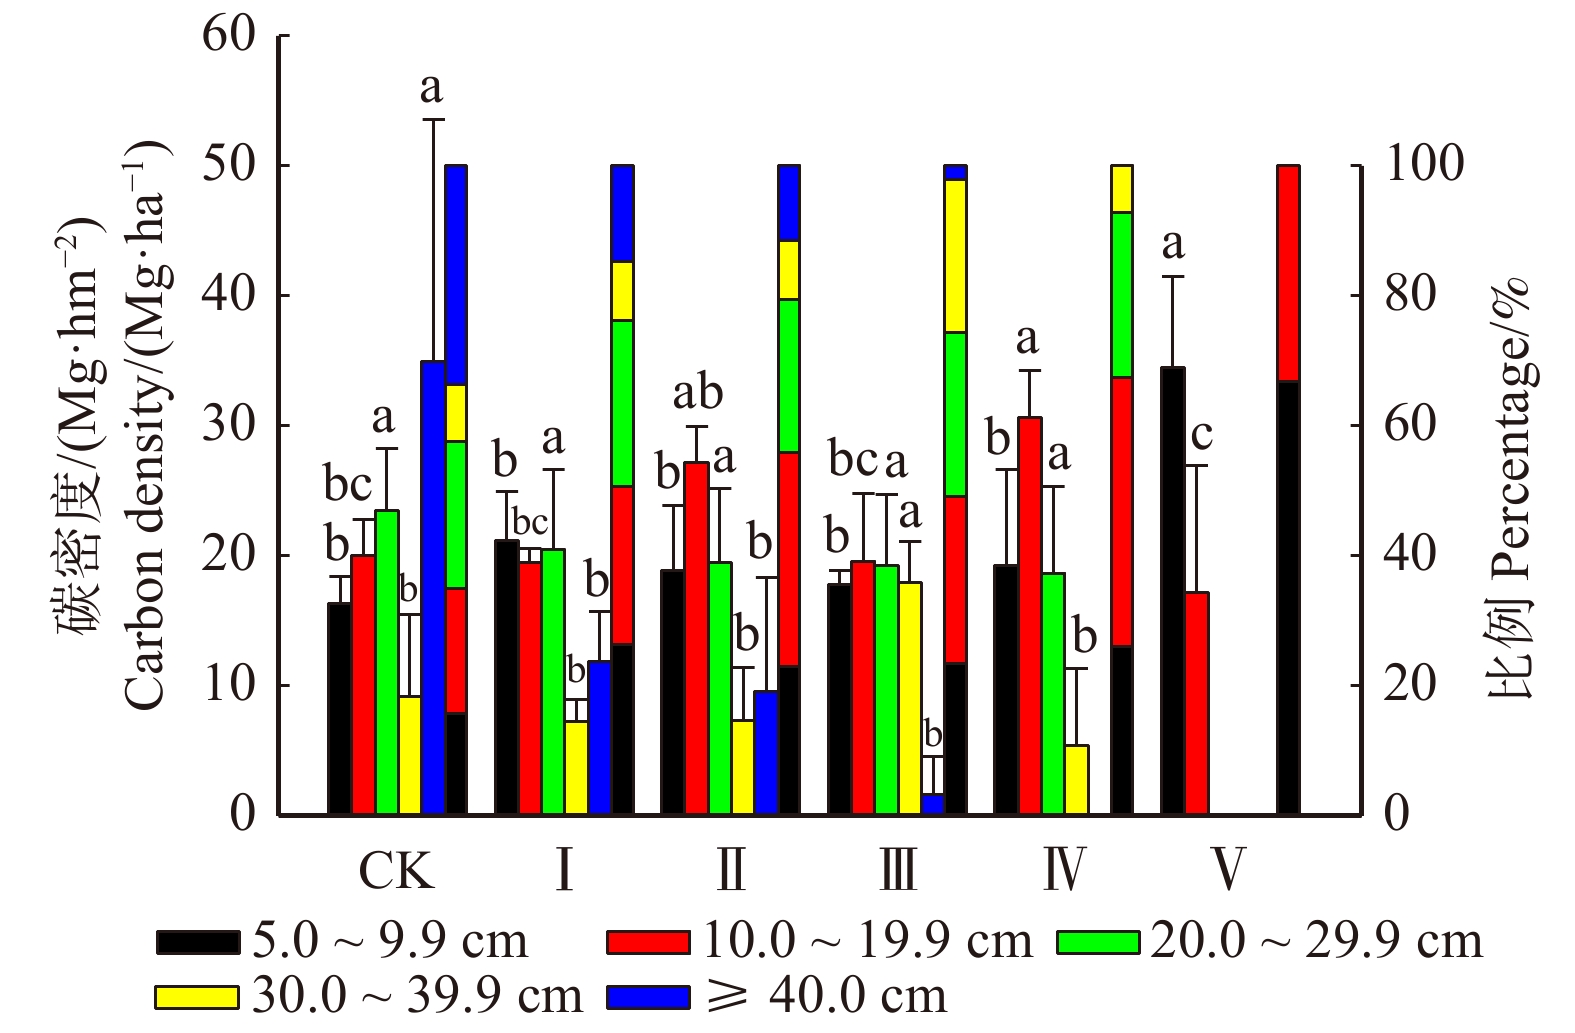
图 1 不同采伐强度干扰的乔木层碳密度径级分布及比例(DBH ≥ 5 cm)
a、b、c 表示相同径级变量在不同采伐处理下的差异,相同的字母表示没有显著差异,不同的字母表示差异显著。 a, b, and c indicate the difference of same diameter class variable under different logging treatments, the same letter indicates no significant difference, while different letters indicate significant difference.
Figure 1. Carbon density and percentage of tree layer in different diameter classes under different logging treatments (DBH ≥ 5 cm)
![]()
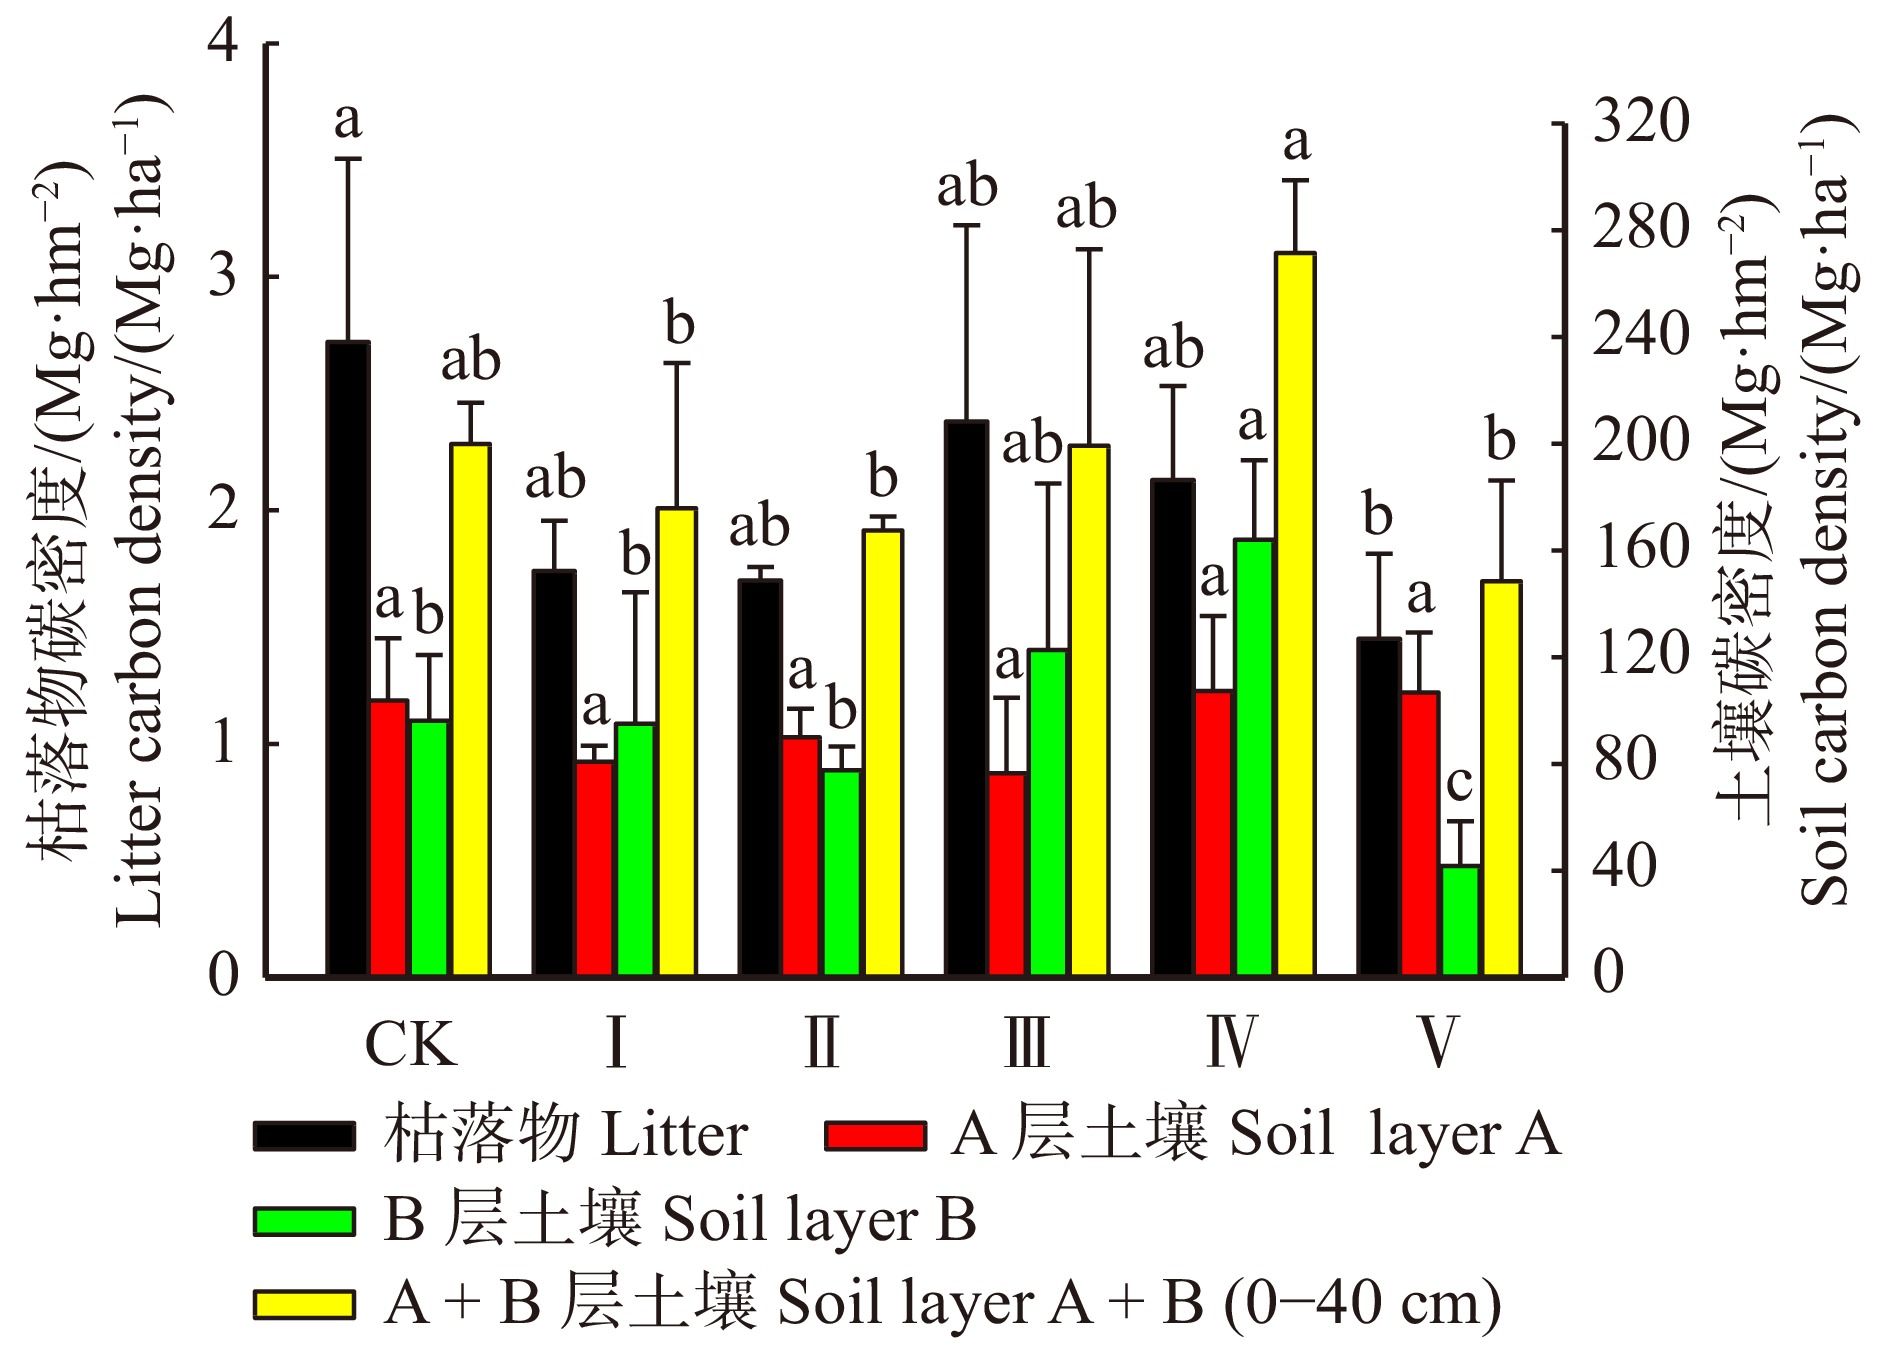
图 2 不同采伐强度干扰的枯落物和土壤碳密度
a、b、c 表示同类变量在不同采伐处理下的差异,相同的字母表示没有显著差异,不同的字母表示差异显著。a, b and c indicate the difference of each same variable under different logging treatments, the same letter indicates no significant difference, while different letters indicate significant difference.
Figure 2. Litter and soil carbon density under different logging treatments
![]()
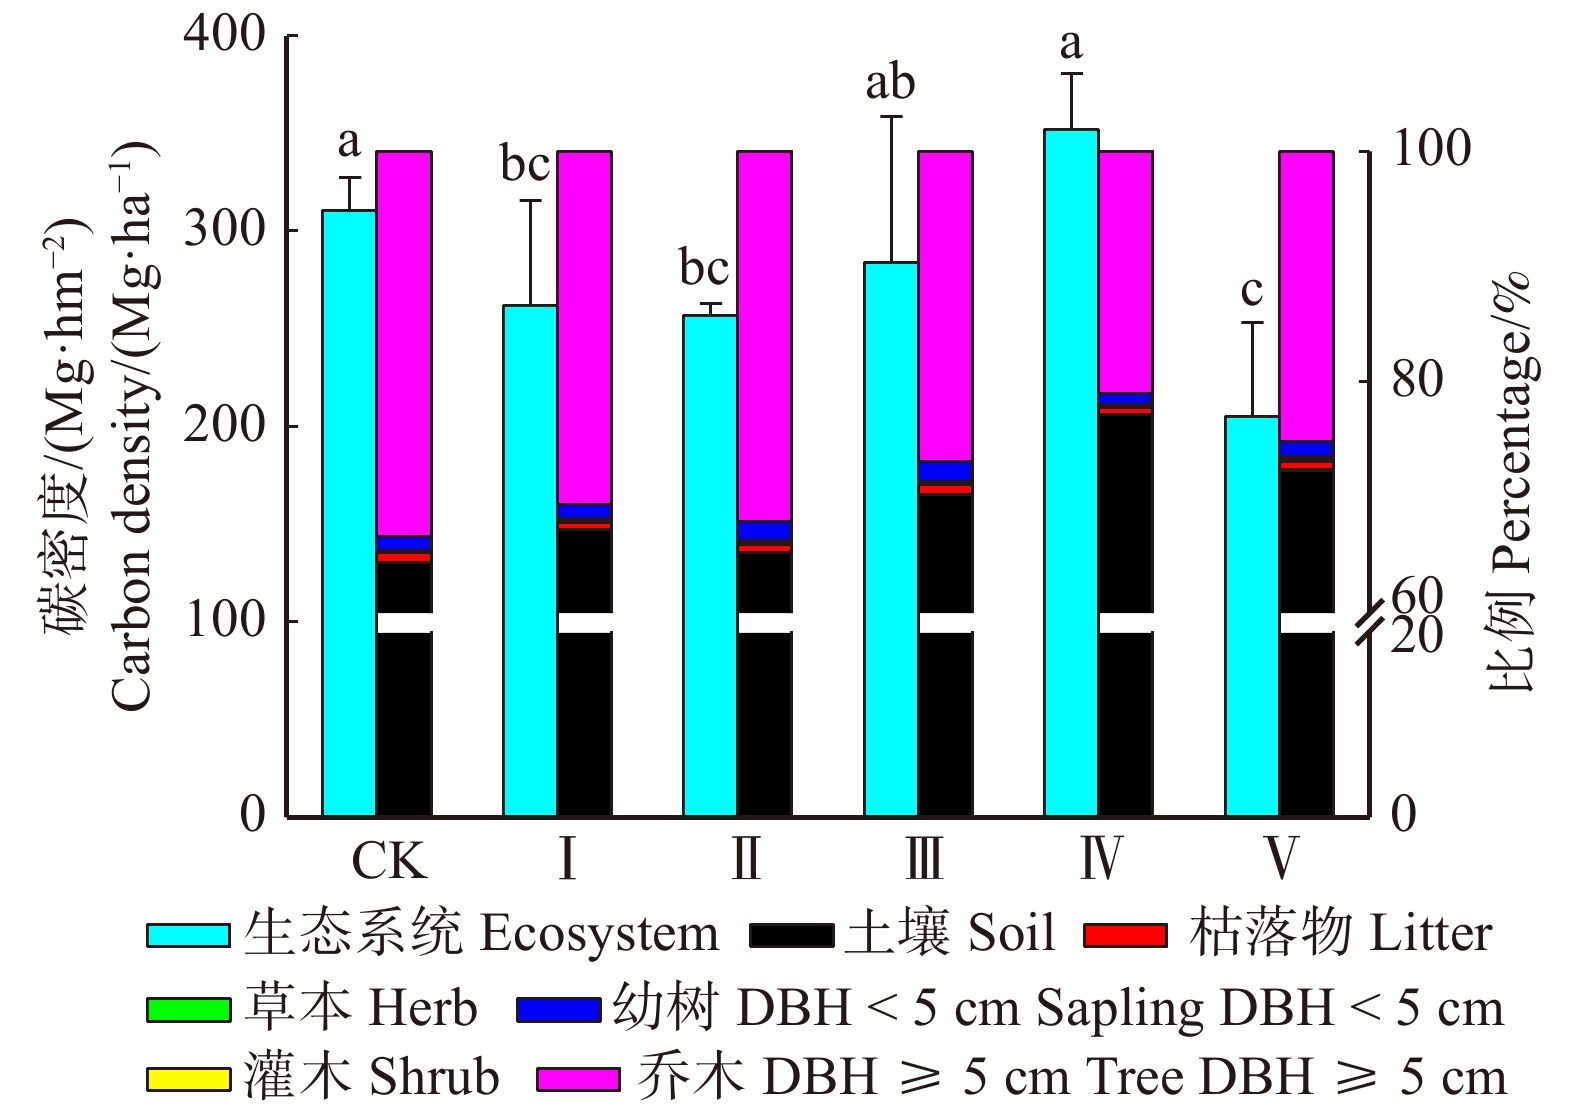
图 3 不同采伐干扰的生态系统碳密度及其组成比例
a、b、c 表示各变量在不同采伐处理下的差异,相同的字母表示没有显著差异,不同的字母表示差异显著。a, b, and c indicate the difference of each variable under different logging treatments, the same letter indicates no significant difference, while different letters indicate significant difference.
Figure 3. Carbon density and composition ratio of ecosystem under different logging treatments
表 1 样地基本情况
Table 1 Basic information of the sample plots
样地
Sample plot树种组成
Tree species composition采伐强度
Logging
intensity/%恢复时间/a
Restoration time/
year乔木密度/
(株·hm−2)
Tree density/
(tree·ha−1)平均胸径
Mean
DBH/cm蓄积/(m3·hm−2)
Accumulation/
(m3·ha−1)草本物种数
Species
number
of herb灌木物种数
Species
number
of shrub乔木物种数
Species
number
of treeCK1 4PK 4T1A1B < 5 30 1 111 15.04 257.81 17 11 15 CK2 4T3PK1AN2O < 5 33 1 222 15.59 249.99 15 7 17 CK3 4PK2T1A1P2O < 5 31 1 233 14.30 251.58 16 9 21 Ⅰ1 5PK2B1P1L1T 31 31 1 567 12.20 225.16 26 6 28 Ⅰ2 3PK3B2T1P1A 31 28 1 356 13.72 205.85 23 14 18 Ⅰ3 3PK2B2A1F1Q1O 29 30 1 178 14.36 199.07 24 5 23 Ⅱ1 4PK2T2A1AN1O 36 28 1 400 13.85 228.80 25 9 21 Ⅱ2 3PK3B2U1F1O 40 34 933 16.97 213.70 27 4 25 Ⅱ3 3PK3T1F1AN1A1O 42 28 1 233 16.15 217.27 28 11 29 Ⅲ1 5P2B1PK1A1O 51 30 1 878 10.60 189.34 23 10 28 Ⅲ2 3T2B2A1PK1F1O 49 30 1 211 14.03 164.54 27 10 21 Ⅲ3 5PK1T1AN1B1A1O 48 30 1 456 12.90 202.64 29 14 22 Ⅳ1 3B2PK2AN1A1U1O 67 28 1 311 14.35 187.97 21 4 12 Ⅳ2 2PK2T2B1AN1L1A 64 33 1 689 12.21 193.49 29 12 19 Ⅳ3 4PK2AN2B1PA1O 69 32 889 16.35 210.33 34 13 32 V1 5B3P1U1O 100 30 1 922 12.00 155.71 21 4 18 Ⅴ2 3P2J2T2Q1A 100 30 1 878 10.96 114.76 26 9 21 Ⅴ3 5J2P2T1A 100 30 2 000 10.37 115.58 26 10 23 注:PK.红松;T. 椴;A. 槭;B. 白桦;AN. 臭冷杉;P. 杨;L. 落叶松;F. 水曲柳;Q. 蒙古栎;U. 榆;PA. 黄檗;J. 胡桃楸;O. 其他。Notes: PK. Pinus koraiensis;T. Tilia sp.;A. Acer sp.;B. Betula platyphylla;AN. Abies nephrolepis;P. Populus sp.;L. Larix olgensis;F. Fraxinus mandschurica;Q. Quercus mongolica;U. Ulmus sp.;PA. Phellodendron amurense;J. Juglans mandshurica;O. Others.  下载: 导出CSV
表 2 不同采伐强度的植被碳密度 Mg/hm2
Table 2 Carbon density of vegetation with different logging intensities
Mg/ha 采伐强度
Logging intensity乔木层 DBH ≥ 5 cm Trees DBH ≥ 5 cm 冠下层植被 Understory vegetation 合计
Total地上
Aboveground地下
Belowground小计
Sub-total幼树 DBH < 5 cm
Sapling DBH < 5 cm灌木
Shrub草本
HerbCK 83.90 ± 6.31a 19.97 ± 0.28a 103.87 ± 6.54a 3.57 ± 0.83a 0.17 ± 0.02b 0.42 ± 0.12a 108.04 ± 6.93a Ⅰ 62.94 ± 1.30b 17.21 ± 0.50b 80.15 ± 1.21b 3.13 ± 1.24a 0.20 ± 0.05b 0.69 ± 0.27a 84.18 ± 0.69b Ⅱ 65.09 ± 2.09b 17.22 ± 0.80b 82.31 ± 1.53b 4.22 ± 2.65a 0.24 ± 0.05b 0.70 ± 0.02a 87.47 ± 3.57b Ⅲ 60.87 ± 2.23b 15.33 ± 0.56b 76.20 ± 2.29b 4.99 ± 1.98a 0.27 ± 0.05b 0.62 ± 0.14a 82.08 ± 0.76b Ⅳ 58.66 ± 0.14b 15.24 ± 1.29b 73.90 ± 1.21b 3.40 ± 0.73a 0.31 ± 0.04b 0.60 ± 0.47a 78.22 ± 2.09b Ⅴ 40.83 ± 7.60c 10.82 ± 3.20c 51.65 ± 10.73c 2.62 ± 0.73a 0.48 ± 0.19a 0.47 ± 0.17a 55.21 ± 10.15c 注:采伐强度: CK(< 5%)、Ⅰ级(30%)、Ⅱ级(40%)、Ⅲ级(50%)、Ⅳ级(> 60%)和Ⅴ级(皆伐)。a、b、c 表示各变量在不同采伐处理下的差异,相同的字母表示没有显著差异,不同的字母表示差异显著。Notes: logging intensities: CK (< 5%), class Ⅰ (30%), class Ⅱ (40%), class Ⅲ (50%), class Ⅳ (> 60%) and class Ⅴ (clear cut). a, b, and c indicate the difference of each variable under different logging treatments, the same letter indicates no significant difference, while different letters indicate significant difference.
下载: 导出CSV
表 3 采伐强度、生态系统各组分碳密度及其与林分结构的相关分析
Table 3 Correlation analysis of thinning intensity, component carbon density of ecosystem and stand structure
指标 Index 采伐强度
Logging intensity乔木地下
碳密度
Belowground
carbon density of tree乔木地上
碳密度
Aboveground
carbon density of tree乔木碳密度
Tree carbon density幼树碳密度
Sapling carbon density灌木碳密度
Shrub carbon density草本碳密度
Herb carbon density枯落物
碳密度
Litter carbon density土壤碳密度
Soil carbon density乔木地下碳密度
Belowground carbon density of tree−0.898** 乔木地上碳密度
Aboveground carbon density of tree−0.921** 0.926** 乔木碳密度
Tree carbon density−0.927** 0.951** 0.997** 幼树碳密度
Sapling carbon density−0.170 0.138 0.139 0.141 灌木碳密度
Shrub carbon density0.797** −0.720** −0.727** −0.734** −0.150 草本碳密度
Herb carbon density−0.010 0.146 −0.021 0.010 0.077 −0.205 枯落物碳密度
Litter carbon density−0.443 0.461 0.557* 0.545* −0.031 −0.297 0.125 土壤碳密度
Soil carbon density−0.063 0.249 0.250 0.253 −0.199 −0.111 0.146 0.640** 树种香农指数
Shannon index of
tree species0.047 −0.187 −0.180 −0.188 0.408 0.037 −0.276 −0.325 0.005 树种均匀度指数
Eveness index of
tree species−0.196 0.062 0.060 0.062 0.292 −0.185 −0.315 −0.256 0.077 树高香农指数
Shannon index of
tree height−0.375 0.381 0.414 0.392 −0.283 −0.483* 0.330 0.340 0.115 树高均匀度指数
Eveness index of
tree height−0.569* 0.548* 0.555* 0.556* −0.241 −0.579* 0.070 0.247 0.164 胸径香农指数
Shannon index of DBH−0.572* 0.580* 0.621** 0.594** −0.168 −0.536* 0.061 0.087 0.205 胸径均匀度指数
Eveness index of DBH−0.578* 0.567* 0.590** 0.578* −0.124 −0.544* −0.008 0.085 0.176 草本丰富度
Richness of herb0.466 −0.506* −0.555* −0.552* 0.014 0.280 −0.061 −0.477* −0.062 灌木丰富度
Richness of shrub−0.059 −0.086 0.004 −0.013 0.114 0.025 −0.570* 0.100 0.163 乔木丰富度
Richness of tree0.053 −0.249 −0.154 −0.174 0.125 0.028 −0.094 −0.348 −0.300 注:**P< 0.01极显著,*P< 0.05显著。Notes: ** means P < 0.01, extremely significant; * means P < 0.05, significant.
下载: 导出CSV
-
[1] Mackey B G, Prentice I C, Steffen W, et al. Untangling the confusion around land carbon science and climate change mitigation policy[J]. Nature Climate Change, 2013(3): 552−557. doi: 10.1038/nclimate1804
[2] Keith H, Lindenmayer D, Mackey B, et al. Managing temperate forests for carbon storage: impacts of logging versus forest protection on carbon stocks[J]. Ecosphere, 2014, 5(6): 1−34.
[3] Richards K R, Stokes C. A review of forest carbon sequestration cost studies: a dozen years of research[J]. Climatic Change, 2004, 63: 1−48. doi: 10.1023/B:CLIM.0000018503.10080.89
[4] 张煜星, 王雪军. 全国森林蓄积生物量模型建立和碳变化研究[J]. 中国科学:生命科学, 2021, 51(2): 199−214. Zhang Y X, Wang X J. Study on forest volume-to-biomass modeling and carbon change in forest dynamics in China[J]. Scientia Sinica Life Sciences, 2021, 51(2): 199−214.
[5] 张煜星, 王雪军, 蒲莹, 等. 1949−2018年中国森林资源碳储量变化研究[J]. 北京林业大学学报, 2021, 43(5): 1−14. doi: 10.12171/j.1000-1522.20200237 Zhang Y X, Wang X J, Pu Y, et al. Changes in forest resource carbon storage in China between 1949 and 2018[J]. Journal of Beijing Forestry University, 2021, 43(5): 1−14. doi: 10.12171/j.1000-1522.20200237
[6] 张颖, 李晓格, 温亚利. 碳达峰碳中和背景下中国森林碳汇潜力分析研究[J]. 北京林业大学学报, 2022, 44(1): 38−47. doi: 10.12171/j.1000-1522.20210143 Zhang Y, Li X G, Wen Y L. Forest carbon sequestration potential in China under the background of carbon emission peak and carbon neutralization[J]. Journal of Beijing Forestry University, 2022, 44(1): 38−47. doi: 10.12171/j.1000-1522.20210143
[7] Peng Y, Thomas S C. Soil CO2 efflux in uneven-aged managed forests: temporal patterns following harvest and effects of edaphic heterogeneity[J]. Plant Soil, 2006, 289: 253−264. doi: 10.1007/s11104-006-9133-0
[8] Aun K, Kukumgi M, Varik M, et al. Short-term effect of thinning on the carbon budget of young and middle-aged silver birch (Betula pendula Roth) stands[J]. Forest Ecology and Management, 2021, 480: 1−11.
[9] Stas S M, Le T C, Tran H D, et al. Logging intensity drives variability in carbon stocks in lowland forests in Vietnam-supplementary material[J]. Forest Ecology and Management, 2020, 460: 2−17.
[10] 魏安然, 张雨秋, 谭凌照, 等. 抚育采伐对针阔混交林林分结构及物种多样性的影响[J]. 北京林业大学学报, 2019, 41(5): 148−158. Wei A R, Zhang Y Q, Tan L Z, et al. Effects of tending felling on stand structure and species diversity of mixed coniferous and broadleaved forest[J]. Journal of Beijing Forestry University, 2019, 41(5): 148−158.
[11] 李明鲁, 吴兆飞, 邱华, 等. 采伐对吉林蛟河阔叶红松林生态功能的短期影响[J]. 北京林业大学学报, 2019, 41(9): 40−49. Li M L, Wu Z F, Qiu H, et al. Short-term effects of tending felling on ecological services of mixed broadleaved-Korean pine forests at Jiaohe in Jilin Province, northeastern China[J]. Journal of Beijing Forestry University, 2019, 41(9): 40−49.
[12] 陈永富, 乔婷, 雷渊才, 等. 采伐对海南霸王岭热带山地雨林乔木碳储量影响初步研究[J]. 林业科学研究, 2013, 26(3): 337−343. doi: 10.3969/j.issn.1001-1498.2013.03.012 Chen Y F, Qiao T, Lei Y C, et al. Analysis on early stage trees carbon storage change of tropical montane rain forest in Bawangling of Hainan Island[J]. Forest Research, 2013, 26(3): 337−343. doi: 10.3969/j.issn.1001-1498.2013.03.012
[13] Dodson E K, Ares A, Puettmann K J. Early responses to thinning treatments designed to accelerate late successional forest structure in young coniferous stands of western Oregon, USA[J]. Canadian Journal of Forest Research, 2012, 42: 345−355. doi: 10.1139/x11-188
[14] Ares A, Neill A R, Puettmann K J. Understory abundance, species diversity and functional attribute response to thinning in coniferous stands[J]. Forest Ecology and Management, 2010, 260: 1104−1113. doi: 10.1016/j.foreco.2010.06.023
[15] Burton J I, Ares A, Mulford S E, et al. Above-ground carbon storage, down wood, and understory plant species richness after thinning in western Oregon[J]. USDA Forest Service-General Technical Report PNW, 2013, 880: 91−100.
[16] Dore S, Montes-Helu M, Hart S C, et al. Recovery of ponderosa pine ecosystem carbon and water fluxes from thinning and stand-replacing fire[J]. Global Change Biology, 2012, 18: 3171−3185. doi: 10.1111/j.1365-2486.2012.02775.x
[17] 何怀江. 采伐干扰对吉林蛟河针阔混交林碳储量和碳平衡的影响[D]. 北京: 北京林业大学, 2018. He H J. Effects of thinning disturbance on carbon storage and carbon balance in coniferous and broadleaved mixed forest in Jiaohe, Jilin Province[D]. Beijing: Beijing Forestry University, 2018.
[18] 齐麟, 于大炮, 周旺明, 等. 采伐对长白山阔叶红松林生态系统碳密度的影响[J]. 生态学报, 2013, 33(10): 3065−3073. doi: 10.5846/stxb201203060303 Qi L, Yu D P, Zhou W M, et al. Impact of logging on carbon density of broadleaved-Korean pine mixed forests on Changbai Mountains[J]. Acta Ecologica Sinica, 2013, 33(10): 3065−3073. doi: 10.5846/stxb201203060303
[19] Pinard M A, Cropper W P. Simulated effects of logging on carbon storage in dipterocarp forest[J]. Journal of Applied Ecology, 2000, 37: 267−283. doi: 10.1046/j.1365-2664.2000.00488.x
[20] Harmon M E, Moreno A, Domingo J B. Effects of partial harvest on the carbon stores in Douglas-fir/western hemlock forests: a simulation study[J]. Ecosystems, 2009, 12: 777−791. doi: 10.1007/s10021-009-9256-2
[21] 范春楠, 刘强, 于舒洋, 等. 天然落叶阔叶林不同年龄紫椴径生长差异及其对气候暖化的响应[J]. 河南师范大学学报(自然科学版), 2021, 49(6): 32−38. Fan C N, Liu Q, Yu S Y, et al. The DBH growth difference and response of Tilia amurensis in different ages in natural deciduous broad-leaved forest to climate warming[J]. Journal of Henan Normal University (Natural Science Edition), 2021, 49(6): 32−38.
[22] 阳含熙, 谢海生. 长白山红松混交林干扰历史的重构研究[J]. 植物生态学报, 1994, 18(3): 201−208. doi: 10.3321/j.issn:1005-264X.1994.03.007 Yang H X, Xie H S. Study on the reconstruction of disturbance history of Pinus koraiensis mixed forest in Changbai Mountain[J]. Acta Phytoecologica Sinica, 1994, 18(3): 201−208. doi: 10.3321/j.issn:1005-264X.1994.03.007
[23] 范春楠. 吉林省森林植被碳估算及其分布特征[D]. 哈尔滨: 东北林业大学, 2014. Fan C N. The carbon distribution characteristic and storage of forest vegetation in Jilin Province[D]. Harbin: Northeast Forestry University, 2014.
[24] 国家林业局. 森林土壤有机质的测定及碳氮化的计算: LY/T 1237—1999[S]. 北京: 中国标准出版社, 1999. State Forestry Administration. Determination of organic matter in forest soil and calculation carbon-nitrogen ratio: LY/T 1237−1999[S]. Beijing: China Standard Press, 1999.
[25] Wang C K. Biomass allometric equations for 10 co-occurring tree species in Chinese temperate forests[J]. Forest Ecology and Management, 2006, 222: 9−16. doi: 10.1016/j.foreco.2005.10.074
[26] 陈传国, 朱俊凤. 东北主要林木生物量手册[M]. 北京: 中国林业出版社, 1989: 158–173. Chen C G, Zhu J F. The manual for main tree biomass in northeast China[M]. Beijing: China Forestry Publishing House, 1989: 158–173.
[27] 范春楠, 庞圣江, 郑金萍, 等. 长白山林区14种幼树生物量估测模型[J]. 北京林业大学学报, 2013, 35(2): 1−9. Fan C N, Pang S J, Zheng J P, et al. Biomass estimating models of saplings for 14 species in Changbaishan Mountains, Northeastern China[J]. Journal of Beijing Forestry University, 2013, 35(2): 1−9.
[28] Vesala T, Suni T, Rannik Ü, et al. Effect of thinning on surface fluxes in a boreal forest[J]. Global Biogeochemical Cycles, 2005, 19: 1−11.
[29] Sist P, Mazzei L, Blanc L, et al. Large trees as key elements of carbon storage and dynamics after selective logging in the eastern Amazon[J]. Forest Ecology and Management, 2014, 318: 103−109. doi: 10.1016/j.foreco.2014.01.005
[30] 雷蕾, 肖文发. 采伐对森林土壤碳库影响的不确定性[J]. 林业科学研究, 2015, 28(6): 892−899. doi: 10.3969/j.issn.1001-1498.2015.06.020 Lei L, Xiao W F. Uncertainty effect of forest harvest on soil carbon pool: a review[J]. Forest Research, 2015, 28(6): 892−899. doi: 10.3969/j.issn.1001-1498.2015.06.020
[31] 周新年, 巫志龙, 郑丽凤, 等. 天然林择伐10年后凋落物现存量及其养分含量[J]. 林业科学, 2008, 44(10): 25−28. doi: 10.3321/j.issn:1001-7488.2008.10.005 Zhou X N, Wu Z L, Zheng L F, et al. Biomass and nutrient content of forest litter in natural forest of different intensity harvesting after ten years[J]. Scientia Silvae Sinicae, 2008, 44(10): 25−28. doi: 10.3321/j.issn:1001-7488.2008.10.005
[32] 曹旭平, 于世川, 张文辉, 等. 间伐对黄龙山辽东栎林下枯落物持水性的影响[J]. 水土保持通报, 2016, 36(6): 247−251. Cao X P, Yu S C, Zhang W H, et al. Effects of thinning on litter’s water holding capacity of Quercus wutaishanica forest understory in Huanglong Mountain[J]. Bulletin of Soil and Water Conservation, 2016, 36(6): 247−251.
[33] 杨曾奖, 曾杰, 徐大平, 等. 森林枯枝落叶分解及其影响因素[J]. 生态环境学报, 2007, 16(2): 649−654. doi: 10.3969/j.issn.1674-5906.2007.02.075 Yang Z J, Zeng J, Xu D P, et al. The processes and dominant factors of forest litter decomposition: a review[J]. Ecology and Environment, 2007, 16(2): 649−654. doi: 10.3969/j.issn.1674-5906.2007.02.075
[34] Grand S, Lavkulich L M. Effects of forest harvest on soil carbon and related variables in Canadian spodosols[J]. Soil Science Society of America Journal, 2012, 76(5): 1816−1827. doi: 10.2136/sssaj2012.0103
[35] Jiang H, Apps M J, Peng C, et al. Modeling the influence of harvesting on Chinese boreal forest carbon dynamics[J]. Forest Ecology and Management, 2002, 169: 65−82. doi: 10.1016/S0378-1127(02)00299-2
[36] Gong C, Tan Q, Liu G, et al. Forest thinning increases soil carbon stocks in China[J]. Forest Ecology and Management, 2021, 482: 118812. doi: 10.1016/j.foreco.2020.118812
[37] 郑丽凤, 周新年. 择伐强度对天然林树种组成及物种多样性影响动态[J]. 山地学报, 2008, 26(6): 699−706. doi: 10.3969/j.issn.1008-2786.2008.06.008 Zheng L F, Zhou X N. Dynamics effects of selective cutting intensity on the species composition and diversity of natural forest[J]. Journal of Mountain Science, 2008, 26(6): 699−706. doi: 10.3969/j.issn.1008-2786.2008.06.008
[38] 周梦丽, 张青, 亢新刚, 等. 云冷杉天然林乔木树种组成及物种多样性对择伐强度的动态响应[J]. 植物科学学报, 2016, 34(1): 56−66. doi: 10.11913/PSJ.2095-0837.2016.10056 Zhou M L, Zhang Q, Kang X G, et al. Dynamic response to selective cutting intensity on tree species structure and species diversity in a natural spruce-fir forest[J]. Plant Science Journal, 2016, 34(1): 56−66. doi: 10.11913/PSJ.2095-0837.2016.10056
[39] 王凯, 马履一, 贾忠奎, 等. 不同林龄油松人工林林下植物对不同间伐强度的短期响应[J]. 东北林业大学学报, 2013, 41(10): 1−9. doi: 10.3969/j.issn.1000-5382.2013.10.001 Wang K, Ma L Y, Jia Z K, et al. Short-term responses of undergrowth of Pinus tabulaeformis plantation at different stand ages to different thinning intensities[J]. Journal of Northeast Forestry University, 2013, 41(10): 1−9. doi: 10.3969/j.issn.1000-5382.2013.10.001
[40] 龚固堂, 牛牧, 慕长龙, 等. 间伐强度对柏木人工林生长及林下植物的影响[J]. 林业科学, 2015, 51(4): 8−15. Gong G T, Niu M, Mu C L, et al. Impacts of different thinning intensities on growth of Cupressus funebris plantation and understory plants[J]. Scientia Silvae Sinicae, 2015, 51(4): 8−15.
[41] Seedre M, Taylor A R, Brassard B W, et al. Recovery of ecosystem carbon stocks in young boreal forests: a comparison of harvesting and wildfire disturbance[J]. Ecosystems, 2014, 17: 851−863. doi: 10.1007/s10021-014-9763-7
[42] Nilsen P, Strand L T. Thinning intensity effects on carbon and nitrogen stores and fluxes in a Norway spruce (Picea abies (L.) Karst.) stand after 33 years[J]. Forest Ecology and Management, 2008, 256: 201−208. doi: 10.1016/j.foreco.2008.04.001
[43] 何怀江, 张忠辉, 张春雨, 等. 采伐强度对东北针阔混交林林分生长和物种多样性的短期影响[J]. 林业科学, 2019, 55(2): 1−12. He H J, Zhang Z H, Zhang C Y, et al. Short-term effects of thinning intensity on stand growth and species diversity of mixed coniferous and broad-eaved forest in northeastern China[J]. Scientia Silvae Sinicae, 2019, 55(2): 1−12.
-
期刊类型引用(1)
1. 周肖,陈昊,时映,陈烽,王叶,王垚,杨亮. 膨润土改性及其在缓释农药载体上的应用研究与展望. 植物医学. 2023(03): 31-40 .  百度学术
百度学术
其他类型引用(2)


计量
- 文章访问数: 626
- HTML全文浏览量: 124
- PDF下载量: 109
- 被引次数: 3
