
Study on carbon sequestration rates of typical tree species in temperate forest
-
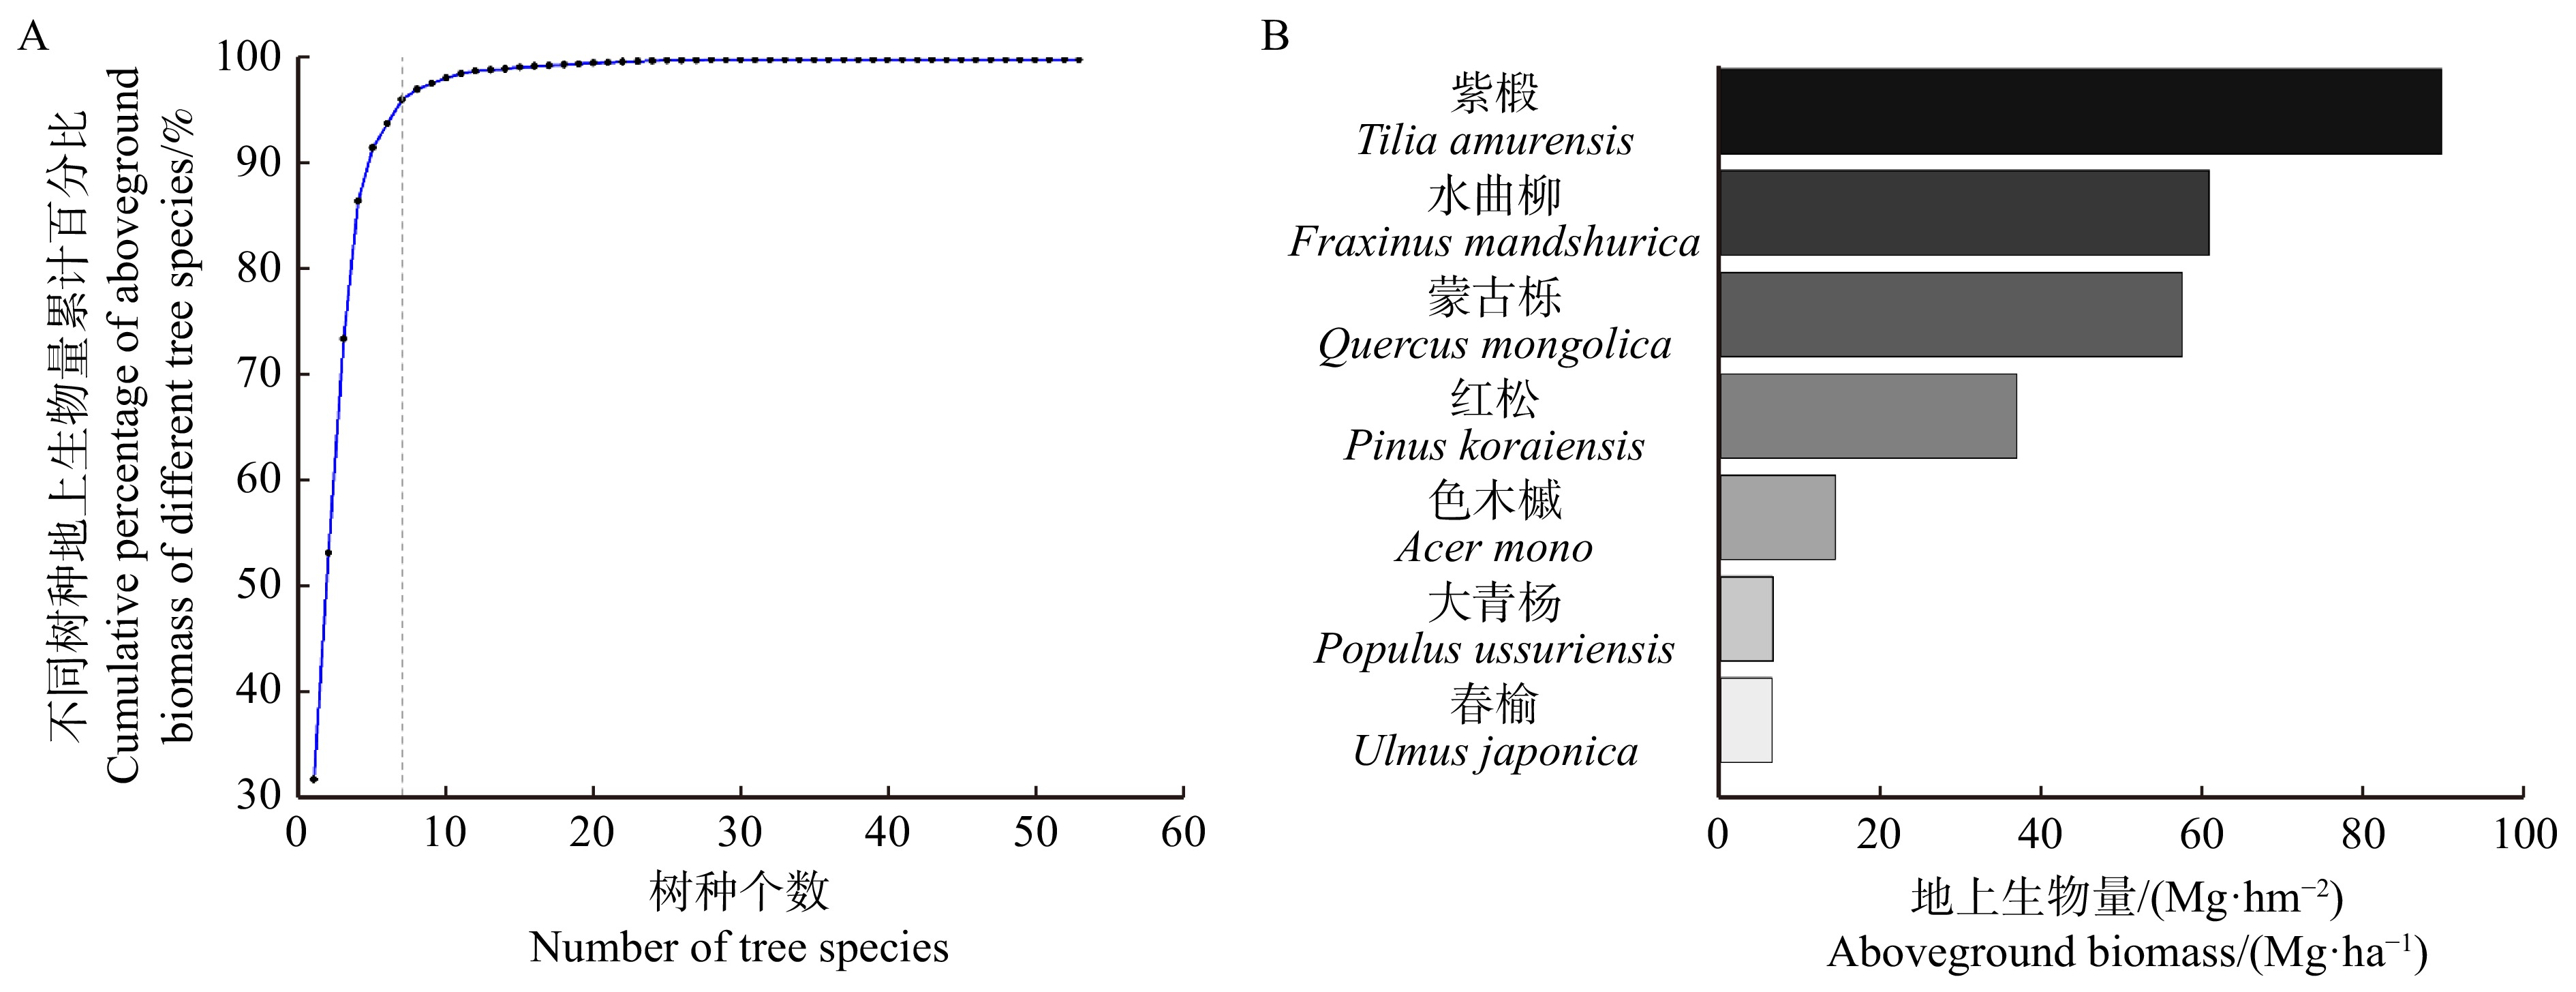
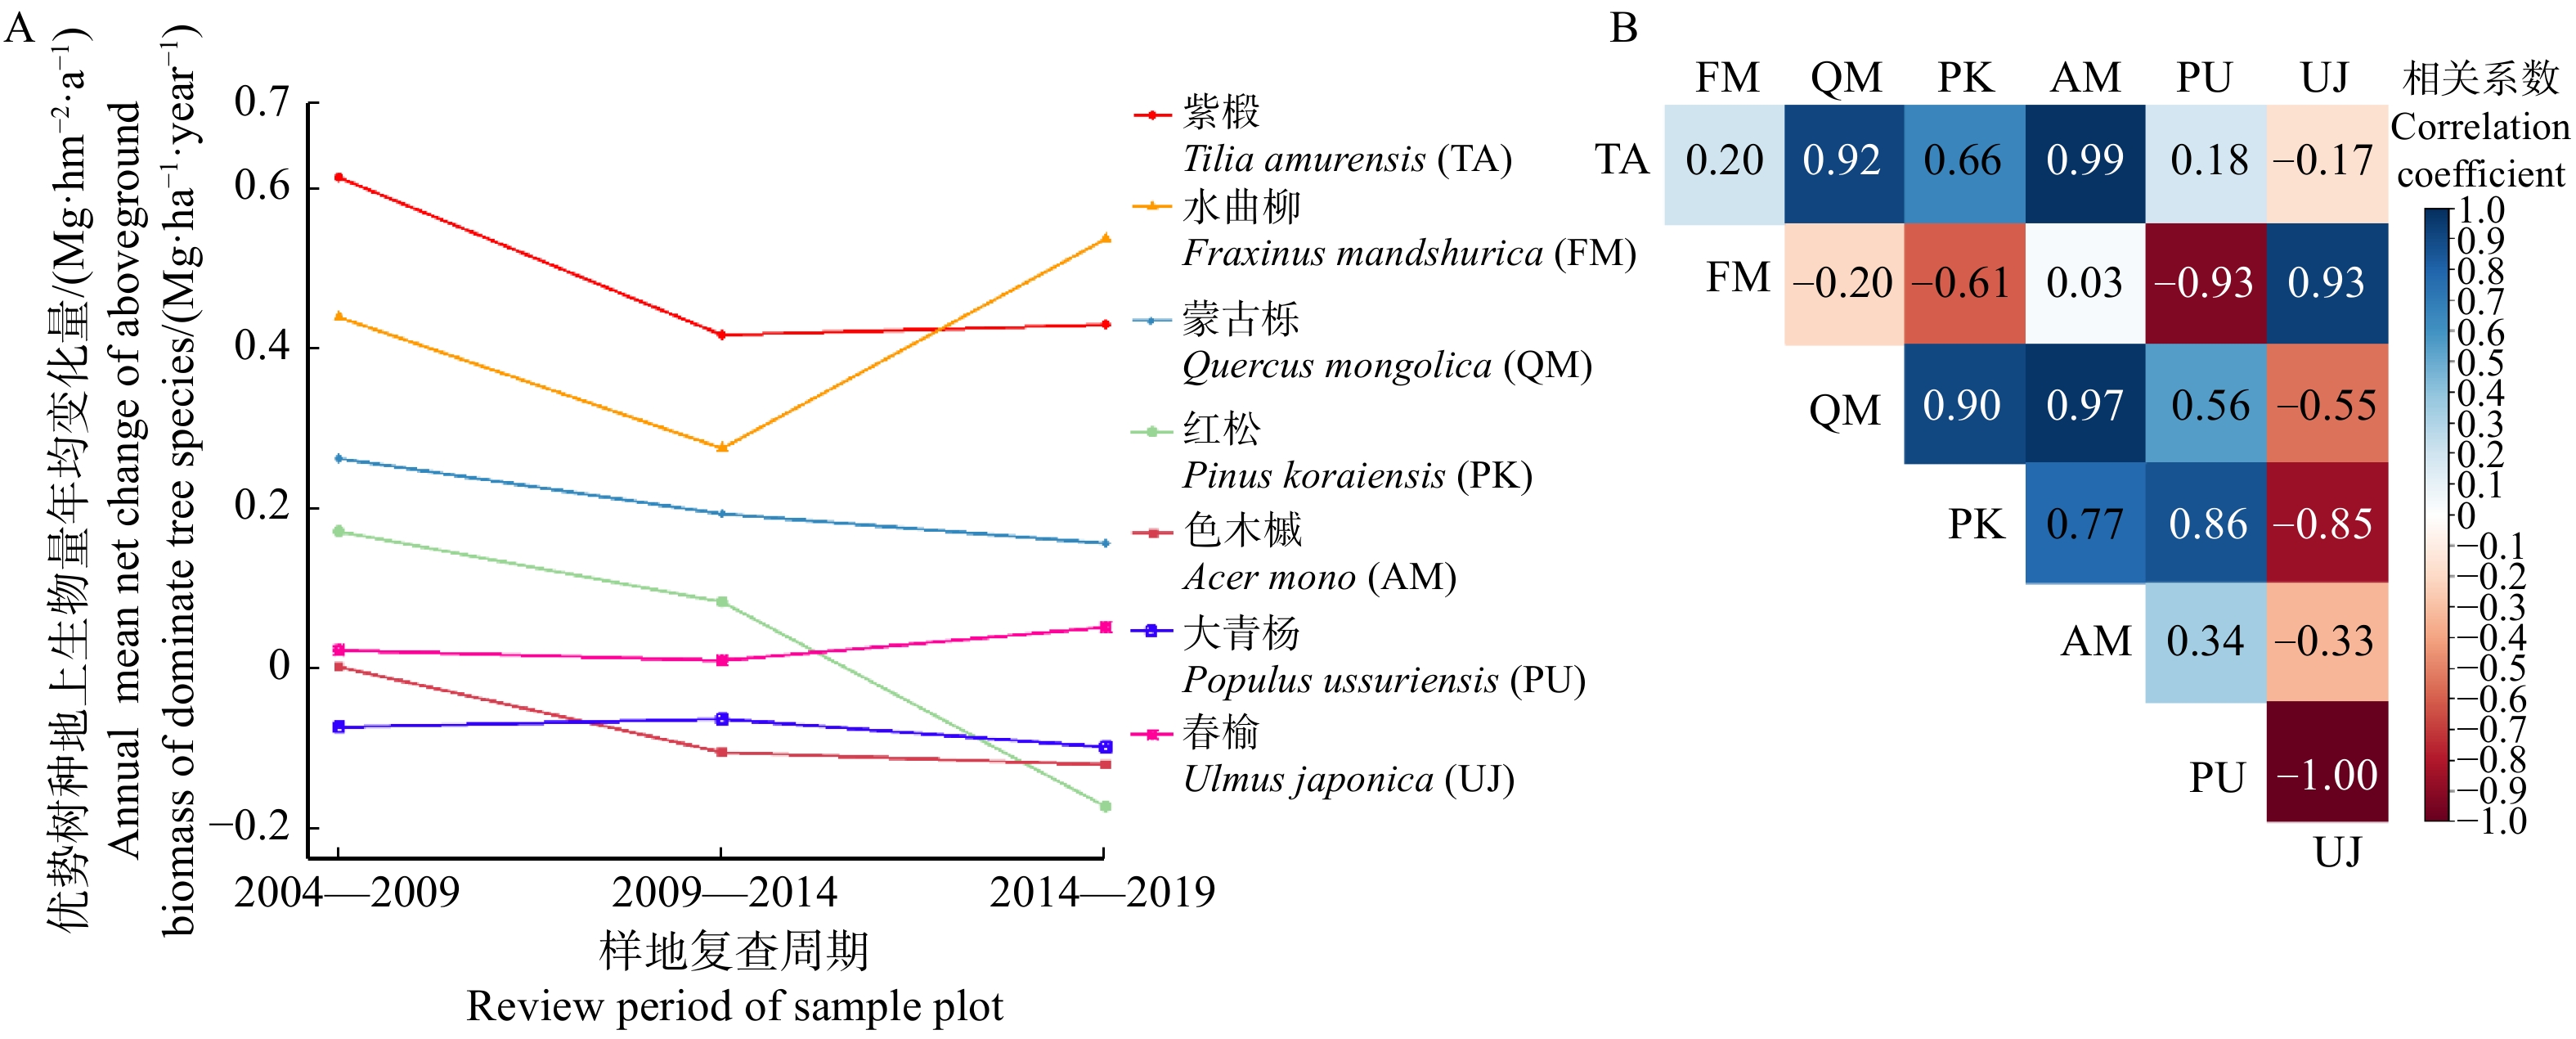
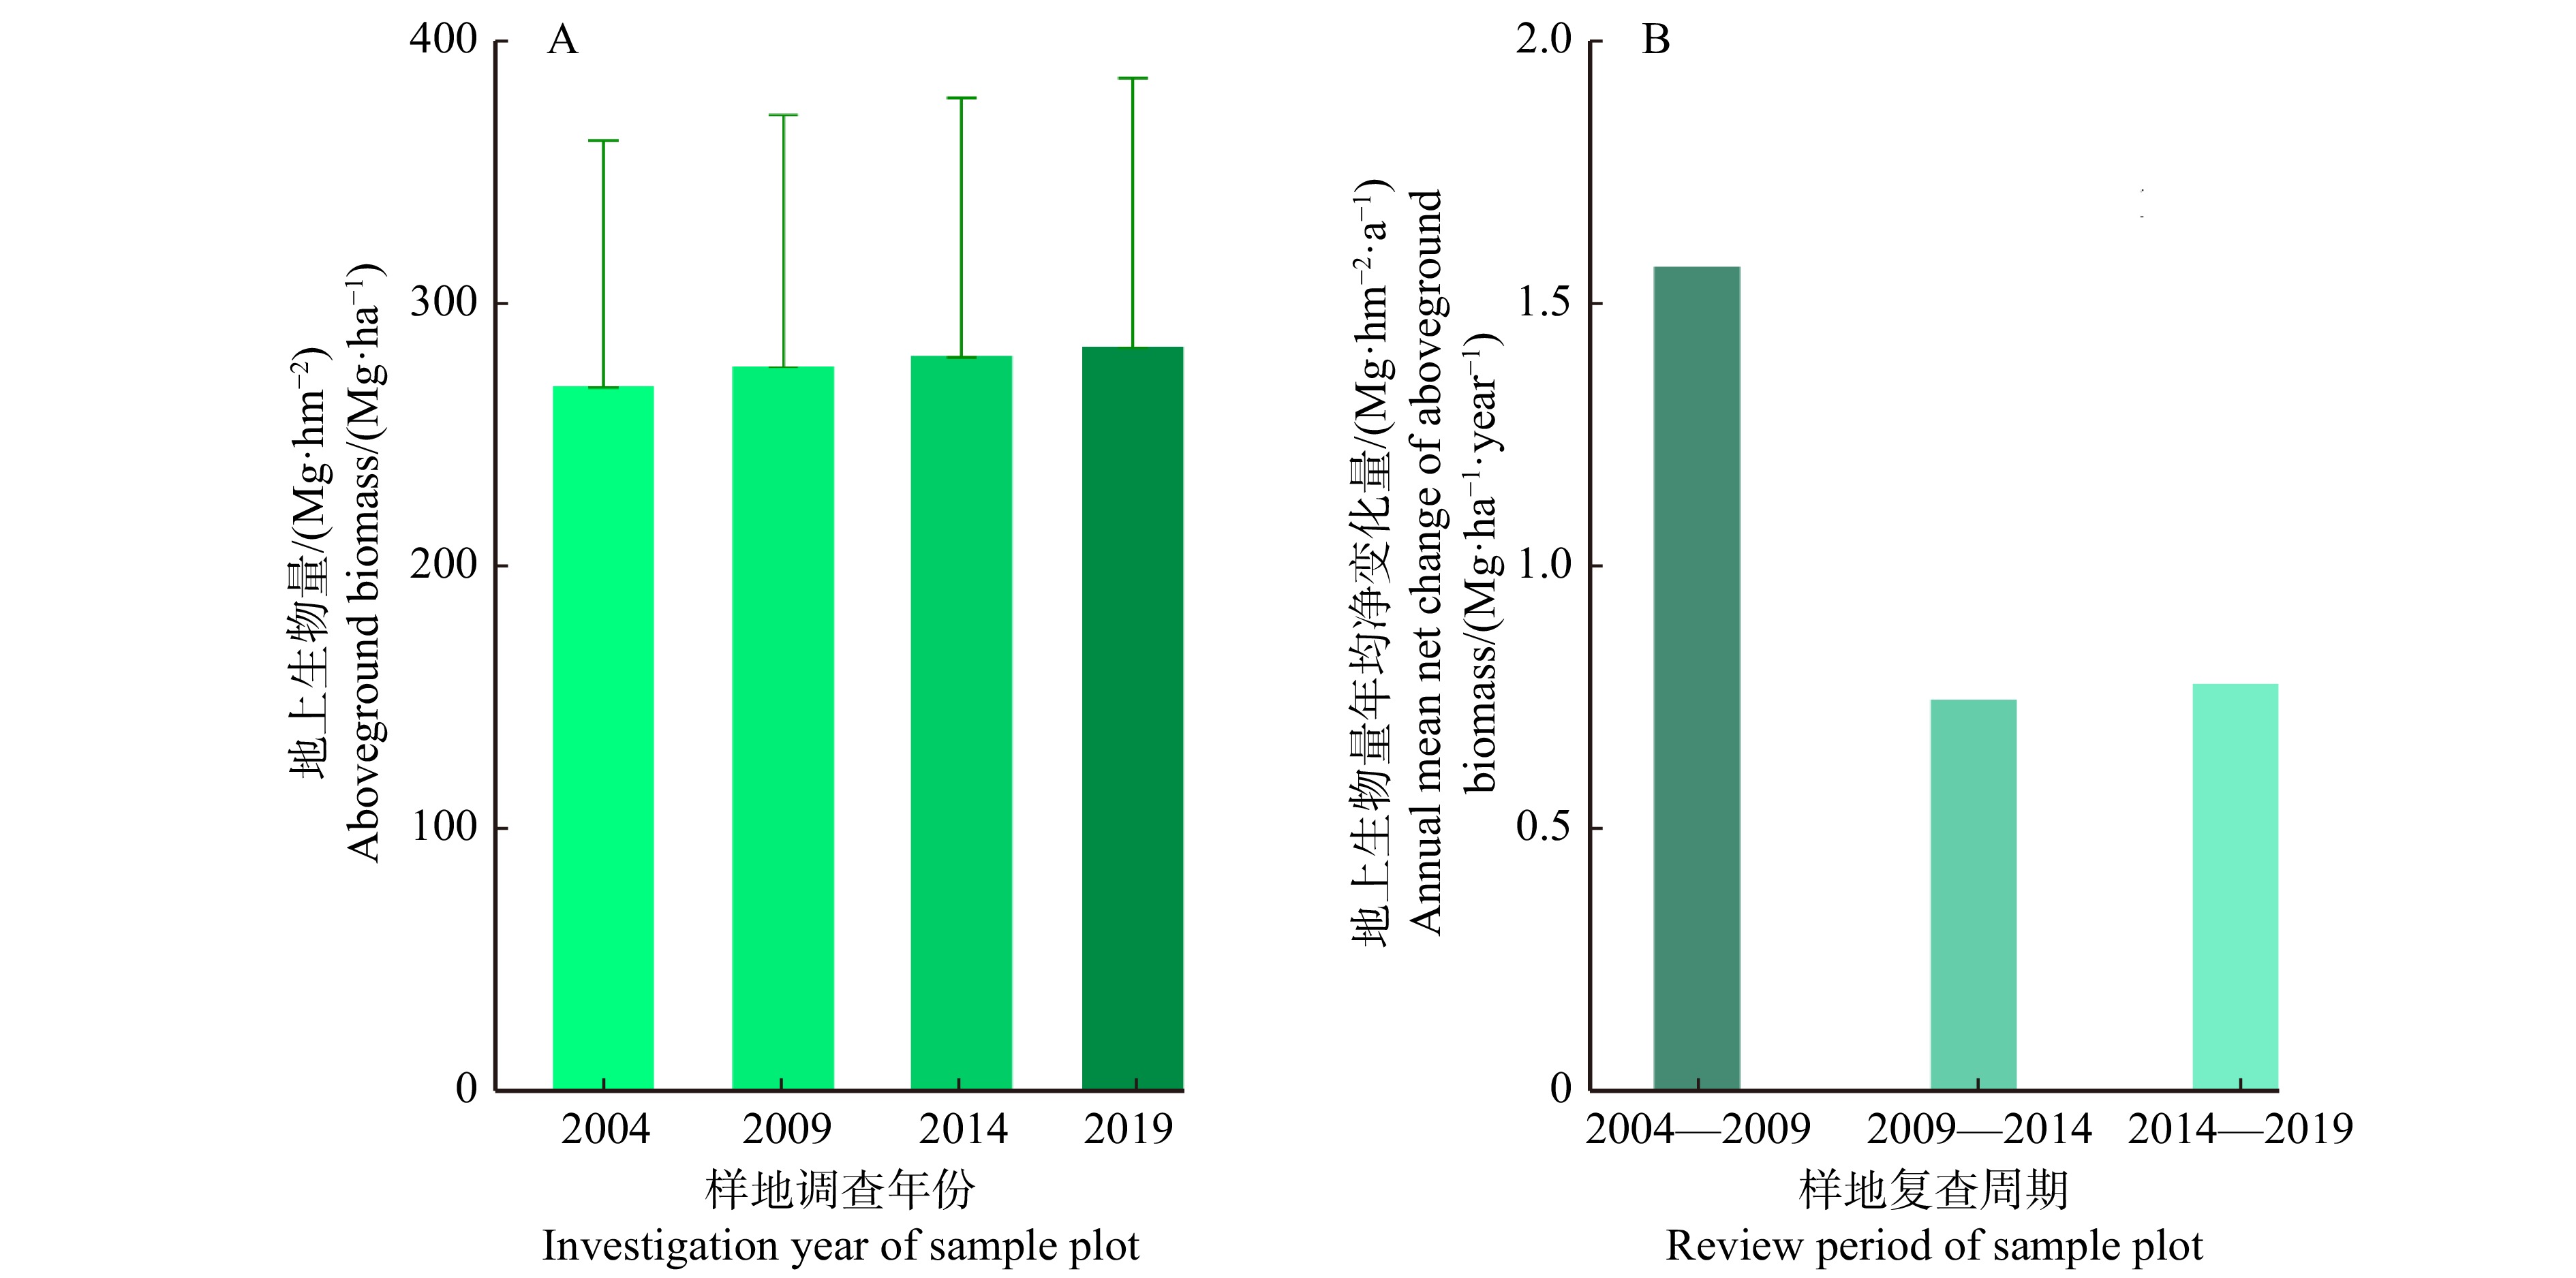
摘要:目的 森林是陆地生态系统的主体,在陆地碳循环中起着关键作用,因此在碳中和背景下,如何持续增加森林碳库储量以及提高森林碳汇功能,已成为各方关注的热点。合理的树种配置是提升森林质量和碳汇能力的基础。方法 以长白山阔叶红松林25 hm2固定样地连续15年(2004—2019年)4次群落调查数据为基础,分析了主要树种对地上生物量碳库储量贡献,比较不同树种固碳速率差异及在时间上的相关性。结果 (1)2019年阔叶红松林地上生物量为(282.5 ± 102.8) Mg/hm2,过去15年间年均净固碳速率约为1.0 Mg/hm2,在3个监测周期(2004—2009年、2009—2014年和2014—2019年)内的固碳速率分别为1.54、0.73和0.76 Mg/(hm2·a);(2)样地内地上生物量最高的7个树种(紫椴、红松、蒙古栎、水曲柳、春榆、色木槭和大青杨)累计贡献量占整个群落总地上生物量的96.2%,其中紫椴、水曲柳和蒙古栎3个树种贡献了73.6%;(3)紫椴、水曲柳、蒙古栎、红松和春榆5个树种种群数量持续下降,而其平均胸径和地上生物量均呈现增加趋势,表明其大径级个体的固碳作用持续增强;(4)主要树种固碳速率存在明显差异(−0.97% ~ 0.77%),其中具有复叶结构的水曲柳是地上生物量积累速率最快的树种,年均增速约为0.77%,其后依次是紫椴(0.60%)、春榆(0.54%)、蒙古栎(0.38%)、红松(0.09%)、色木槭(−0.46%)和大青杨(−0.97%);(5)7个种群在3个监测周期内表现出不同的增长动态,其中紫椴和色木槭、蒙古栎和红松、水曲柳和春榆之间表现出较高的正向波动关系,大青杨和春榆呈负向关系。因此,固碳速率在树种间存在时间上的异步性。结论 该研究揭示的典型温带树种固碳规律、树种间固碳速率在时间上的异步性特点可为本地区植树造林实践中树种选择及配置提供一定的参考。Abstract:Objective How to improve the carbon sink role of forests under the background of carbon neutrality and continue to increase forest carbon storage has become a focus of attention of all parties. Reasonable tree species mixture is the basis for improving forest quality and carbon sink capacity.Method Based on the 15 years (2004−2019) consecutive data of four forest inventories in a 25 hectare dynamic sample plot of broadleaved Korean pine forest in Changbai Mountain of northeastern China, we analyzed the contribution of different tree species to aboveground biomass carbon storage, and compared the differences in carbon sequestration rates of different tree species as well as their interspecific asynchrony.Result (1) The aboveground biomass of broadleaved Korean pine forest in the latest inventory was about (282.5 ± 102.8) Mg/ha, and the annual mean net carbon sequestration rate of aboveground biomass was about 1.0 Mg/ha in the past 15 years. The carbon sequestration rates among the three periods (2004−2009, 2009−2014, 2014−2019) were 1.54, 0.73 and 0.76 Mg/(ha·year), respectively. (2) The aboveground biomass of the seven dominant tree species accounted for about 96.2% of the total aboveground biomass of the entire community, and the three most important tree species (i.e., Tilia amurensis, Fraxinus mandshurica and Quercus mongolica) contributed 73.6% of the total aboveground biomass. (3) The population number of five tree species, including Tilia amurensis, Fraxinus mandshurica, Quercus mongolica, Pinus koraiensis and Ulmus japonica, continued to decline, while their average DBH and aboveground biomass showed a directional increasing trend. (4) The aboveground biomass carbon sequestration rate of the seven dominant tree species ranged from −0.97% to 0.77%, and Fraxinus mandshurica with compound leaf character had the fastest aboveground biomass accumulation rate (0.77%), followed by Tilia amurensis (0.60%), Ulmus japonica (0.54%), Quercus mongolica (0.38%), Pinus koraiensis (0.09%), Acer mono (−0.46%), Populus ussuriensis (−0.97%). (5) The seven most important populations showed different growth dynamics during three monitoring periods, and the relationships between Tilia amurensis and Acer mono, Quercus mongolica and Pinus koraiensis, Fraxinus mandshurica and Ulmus japonica showed a relative higher positive correlation relationship, whereas a negative relationship existed between Populus ussuriensis and Ulmus japonica.Conclusion The temporal asynchrony of carbon sequestration rates among tree species could provide a certain reference for tree species selection and configuration in afforestation practice in this area.
-
近自然森林经营理论是经过了法正林−恒续林−近自然森林经营一百多年的不断发展而形成的[1],是实现森林可持续经营的有效途径。目标树经营是近自然经营的主要技术体系,把所有林木分类为目标树、特殊目标树、干扰树和其他树木等4种类型[2]。目标树经营的核心技术体系是以选择的目标树为培育对象,通过采伐干扰树来实现林地的综合效益。国外已经开展了很多关于目标树经营的实践和研究[3],国内由于开展时间较晚,干扰树采伐对林分的影响研究较少,目前针对传统采伐对林分的影响研究较多[4−6]。
森林生长的周期很长,一些传统特征指标,如蓄积、生长量等对森林经营措施的响应较慢,而空间结构是森林经营过程可以调控的因子[7],通过对空间结构的影响研究可以及时反映出经营效果,为森林精准经营提供基础。森林空间结构在很大程度上决定了森林发展的状态、林分稳定性和经营空间的大小[8],目前国际上模拟森林经营的主要研究内容之一便是空间结构的分析和比较。国内外针对目标树经营效果的研究主要集中在一些传统指标上[9−14],对空间结构的研究尚不多见。
森林空间结构指标的研究较多,许多学者选取不同的指标研究了林分空间结构对环境因素以及人类经营活动的响应[15−16]。然而选择的指标不同,关注的角度就不同,在评判空间结构的优劣时得出的结论可能不一致[17−18]。因此选取合适的指标,并实现各个空间结构要素之间的联立,构建一个定量化综合指标来对林分空间结构进行综合分析,才能对森林空间结构进行更为客观全面的描述,从而为经营决策提供准确依据。
蒙古栎(Quercus mongolica)属壳斗科(Fagaceae)栎属(Quercus)植物,又称柞木、柞树,在我国主要分布于东北和华北地区,是我国温带地区落叶阔叶林及针阔混交林的主要树种[19−22]。相关研究发现,栎属树种平均生长季的日用水量明显低于其他树种[23],许多栎属树种能适应较温暖和更加极端的气候,在森林经营中,栎类的生态学和经济学地位很可能会因此得以提升[24−26]。殷晓洁等[27]研究发现未来气候变化将使蒙古栎的地理分布范围扩大,成为我国大兴安岭和小兴安岭最主要的树种。但由于人们对蒙古栎的生长特性认识不足,而且大部分蒙古栎林的现实林分生长不良,没有充分发挥其多种效益。蒙古栎次生林在我国分布面积很大,如何通过经营来改善其林分状况,实现其经济价值和生态效益具有重要意义。
基于以上因素,本研究采取基于相邻木关系的混交度(M)、大小比数(U)、角尺度(W)和密集度(C)等4个常用的林分空间结构指标,构建空间结构综合指数(comprehensive spatial structure index,CSSI)。以吉林省汪清林业局塔子沟林场蒙古栎次生林传统经营和目标树经营样地为研究对象,分别采用4个空间结构指标以及CSSI从目标树水平和林分水平分析了基于目标树经营的抚育间伐与传统抚育间伐对蒙古栎次生林空间结构的影响,以期为蒙古栎次生林的空间结构优化和确定合理目标树选择密度提供借鉴。
1. 材料与方法
1.1 研究地区概况
研究区位于吉林省延边朝鲜族自治州汪清林业局塔子沟林场,地形以低山丘陵为主,地理坐标为129°56′ ~ 131°04′E,43°05′ ~ 43°40′N。该区属于温带大陆性季风气候,年均气温3.9 ℃,年平均降水量500 ~ 600 mm,且主要集中在夏季。研究区森林覆盖率达到90%以上,主要乔木树种有蒙古栎、红松(Pinus koraiensis)、白桦(Betula platyphylla)、黑桦(Betula dahurica)、大青杨(Populus ussuriensis)、色木槭(Acer mono)、长白落叶松(Larix olgensis)、紫椴(Tilia tuan)、臭冷杉(Abies nephrolepis)、春榆(Ulmus japonica)、水曲柳(Fraxinus mandschurica)等。主要灌木树种有:山葡萄(Vitis amurensis)、毛榛(Corylus mandshurica)、暴马丁香(Syringa reticulata var. amurensis)、五味子(Schisandra chinensis)、忍冬(Lonicera japonica)、刺五加(Acanthopanax senticosus)等。
1.2 数据来源
在吉林省汪清林业局塔子沟林场选取林分条件相对一致的蒙古栎次生林,设置9块面积为1 hm2(100 m × 100 m)的试验样地,并用森林罗盘仪将每块样地划分100个10 m × 10 m的网格单元。在每个网格单元内,对胸径5 cm以上的树木进行了每木调查,记录树种,测量胸径、树高、枝下高、东西南北冠幅、林木健康状况等因子,并利用徕卡激光测距仪测定每木的坐标(X,Y)。选取的样地林分均处于中龄林阶段,主林层蒙古栎的林龄介于40 ~ 70年之间。样地基本概况和林分基本信息见表1和表2。
表 1 样地基本概况Table 1. General description of sample plot样地号
Sample plot No.海拔
Altitude/m坡位
Slope position坡度
Slope gradient/(°)郁闭度
Canopy density密度/(株·hm− 2)
Stand density/(tree·ha− 1)树种组成
Species composition处理
Treatment1 705 中 Middle 8 0.70 766 6蒙1桦1杨1红1其他 T1 2 738 中 Middle 8 0.71 896 4蒙2杨1桦1色1椴1红 T2 3 721 中 Middle 7 0.72 1 038 5蒙2桦1色1杨1椴 T3 4 741 中 Middle 8 0.83 992 4蒙2桦1色1椴1红1其他 T2 5 637 中 Middle 8 0.85 998 5蒙2桦1红1黑1其他 T1 6 635 中 Middle 8 0.88 1 047 5蒙3桦1黑1红 T3 7 677 中 Middle 7 0.90 800 6蒙1黑1胡1水1其他 T1 8 685 中 Middle 7 0.77 929 6蒙2桦1黑1其他 T3 9 703 中 Middle 6 0.87 995 4蒙3桦1杨2其他 T2 注:蒙代表蒙古栎,桦代表白桦,杨代表大青杨,红代表红松,色代表色木槭,椴代表紫椴,落代表长白落叶松,黑代表黑桦,胡代表胡桃楸,水代表水曲柳,其他代表其他树种。Notes: 蒙 stands for Quercus mongolica, 桦 stands for Betula platyphylla, 杨 stands for Populus ussuriensis, 红 stands for Pinus koraiensis, 色 stands for Acer mono, 椴 stands for Tilia tuan, 落 stands for Larix olgensis, 黑 stands for Betula dahurica, 胡 stands for Juglans mandshurica, 水 stands for Fraxinus mandschurica, 其他 stands for other tree species. 表 2 蒙古栎次生林林分基本信息Table 2. General information of oak secondary forest样地号
Sample plot No.胸径 DBH/cm 树高 Tree height/m 优势平均高
Mean dominant height/m蓄积
Volume/m3最小 Min. 平均 Average 最大 Max. 最小 Min. 平均 Average 最大 Max. 1 5.0 14.6 66.0 2.0 11.0 29.6 22.2 150.72 2 5.0 13.7 59.1 0.5 11.2 24.1 21.5 162.31 3 5.0 13.0 55.7 1.3 10.25 28.5 21.6 172.00 4 5.0 13.6 50.2 1.5 10.9 25.8 21.2 176.10 5 5.0 13.1 50.9 1.5 8.9 22.4 21.5 162.30 6 5.0 12.8 58.5 3.2 11.5 31.1 22.2 173.91 7 5.0 14.3 52.2 1.4 9.8 24.9 21.8 154.45 8 5.0 14.3 70.1 3.1 12.6 24.2 22.9 179.20 9 5.0 14.1 58.2 2.2 11.0 26.5 22.7 186.90 注:采用汪清林业局一元立木材积表[28]计算单木材积和林分蓄积,选取样地最高的5株林木计算优势高平均值。Notes: volume of wood was calculated by the tree volume table of Wangqing Forestry Bureau, and the mean dominant height was calculated by choosing five highest trees in each sample plot. 在完成上述因子调查后采取完全随机区组设计,确保随机区组后各组林分的基本特征没有显著差异。试验设置3种处理,3次重复,共9块固定监测样地。3种处理包括:(1)传统经营,即T1处理(1、5、7号样地),遵循《森林抚育规程》(GB/T15781-2009)的规定进行抚育间伐设计,采伐强度控制在25%以下,采伐对象主要是生长不良的林木,伐后郁闭度在0.6以上;(2)目标树经营密度1,即T2处理(2、4、9号样地),按照目标树单株木集约经营理念制定采伐设计,用材目标树选取密度约为70株/hm2,将影响目标树生长的林木确定为干扰木并进行采伐;(3)目标树经营密度2,即T3处理(3、6、8号样地),用材目标树选取密度为100株/hm2,其余措施与T2一致。采伐前林木分布如图1所示。干扰树采伐与传统采伐的根本区别在于采伐对象不同,常规采伐主要是针对没有培育前途的林木,多是林分中密度过大,质量低劣的林木,而干扰树采伐的对象是影响用材目标树生长的林木,可能是林层中的优势木和亚优势木,对不影响目标树生长的其他林木不采取任何措施。
考虑到样地边缘林木的相邻木可能处于边界以外,空间结构单元并不完整[29],为消除边缘效应,将样地距离边界线5 m以内的林木作为缓冲区林木,只作为相邻木来参与计算。其他区域视为核心区(90 m × 90 m),计算核心区内每株林木的空间结构参数。本研究以任一中心木和其周围的4株最近的相邻木组成空间结构单元,以此来计算空间结构指标[30]。
1.3 分析方法
1.3.1 空间结构综合指数
森林空间结构的研究主要集中在3个方面[31]:(1)树种空间隔离程度,即不同树种的混交程度;(2)林木间的竞争状况,也即立木的大小差异程度和密集程度;(3)林木的空间分布格局,也即林木在地面上的空间分布形式,这3个方面构成了森林结构的三要素。目前评价林分空间结构的指标很多,但许多指标之间存在重复,综合计算时难以科学界定权重。一些学者提出了基于相邻木关系的混交度(M)、大小比数(U)和角尺度(W)3个指标,这3个指标便于计算,可以较完整的表达出单木和林分的空间结构,在国内外应用广泛,效果较好[32−36]。但这3个指标都与距离无关,假如2株参照木周围分布的相邻木在树种混交、大小差异程度以及空间分布形式上均一致,但相邻木与参照木的距离不同,这时如果只采用这3个指标就会对空间结构造成误判,误认为2株参照木的空间结构一致。为解决这一问题,胡艳波等[37]在基于空间结构单元的基础上,提出了密集度(C)的概念。密集度直观表达了林分的疏密程度,也反映了林木间的竞争情况。
本文采用以上4个指标,在董灵波等[38]提出的天然林空间结构指数的基础上进行了修改。以W、U、M和C为“投入”,将林分的空间结构作为“产出”构建了空间结构综合指数(CSSI)。结合4个空间结构指标的定义,可以认为林分的M越大,U和C越小,角尺度中等的条件下林分的空间结构最佳(CSSI = 100),鉴于U和C均是体现林木竞争关系的指标,因此两者权重各取50%来作为“投入”。函数表达式如下:
CSSI=3√¯M(100−2×|¯W−50|)×√(100−¯U)(100−¯C) (1) 式中:
CSSI 为空间结构综合指数,¯M 、¯W 、¯U 、¯C 分别为林分平均混交度、平均角尺度、平均大小比数和平均密集度。本研究中0 ≤ CSSI ≤ 100,0 ≤¯M ≤ 100,0 ≤¯U ≤ 100,0 ≤¯W ≤ 100,0 ≤¯C ≤ 100。1.3.2 混交度
本研究采用混交度(M)表示树种空间隔离程度,其概念是由Gadow[39]和Füldner[40]提出的,定义为参照树i周围4株相邻木j中与其不是同一树种的个体所占的比例。认为林分的稳定性与M呈正相关关系。计算公式如下[8]:
Mi=144∑j=1vij (2) 式中:
Mi 为第i株个体的混交度,vij 表示参照木与相邻木的树种是否相同,如相同,则vij = 0;反之则为1。林分的平均混交度
¯M 计算公式如下:¯M=1NN∑i=1Mi (3) 式中:
N 为林分中消除边缘效应后的有效个体数量。1.3.3 角尺度
本研究选用角尺度(
W )来对林木空间分布格局进行计算,角尺度表示参照树i 周围的相邻木的均匀性,其定义是任意两株相邻木与参照木构成的夹角α小于标准角α0(α0 = 72°)的个数占相邻木(n )的比例,公式如下[41−43]:Wi=1nn∑j=1Zij (4) 式中:
Zij 表示夹角α是否小于标准角α0,当第j 个α角小于标准角α0时,Zij = 1,反之为0。用
¯W 表示林分整体的平均角尺度,当¯W < 0.475时林分为均匀分布,¯W ∈[0.475,0.517]时为随机分布,当¯W > 0.517时为聚集分布。1.3.4 大小比数
本文采用大小比数(
U )来表示林木间的大小差异程度及空间优势程度,选用胸径作为比较指标。计算公式如下[44]:Ui=14n∑j=1kij (5) 式中:
Ui 表示比参照木大的相邻木数量所占4株最近相邻木的比例,kij 表示参照木与相邻木的大小,如果参照木i 比相邻木j 大,那么kij=0 ;反之则为1。由定义可知,Ui 值越小,参照木的优势越明显,林分的平均大小比数用¯U 来表示。1.3.5 密集度
本研究采用密集度(
C )来表示林木的密集程度,其定义为所考察的相邻木与参照木树冠相接的株数的比例,计算公式为[37]:Ci=144∑j=1yij (6) 式中:
yij 表示参照树i与相邻木j的树冠投影是否重叠,重叠时yij 取值为1,反之为0。密集程度的高低反映了林木间的竞争程度,当计算林分密集度时将格局因子考虑进去,计算公式为:
¯C=1nn∑i=1CiλWi (7) 式中:
λWi 为格局权重因子,其赋值由林木的角尺度取值所决定。¯C 值与林分的密集程度呈正相关关系。2. 结果与分析
2.1 目标树结构单元的空间结构指标
T2、T3样地干扰树采伐前后目标树结构单元的混交度(M)、角尺度(W)、大小比数(U)和密集度(C)均值如表3所示。采伐干扰树后,目标树的M平均值提高,空间隔离程度增大,T3的提升幅度略高于T2。T2、T3目标树结构单元的W平均值都大于0.5,干扰树间伐对目标树的W均值影响不大:T3目标树W平均值略有上升,更趋向聚集分布;T2则有所下降,趋近随机分布。表明林木空间分布格局对干扰树采伐的响应具有不确定性。
表 3 采伐前后目标树结构单元的各个空间结构指标Table 3. Spatial structure indexes of target trees before and after thinning抚育间伐方式
Thinning treatment类型
TypeM平均值
Mean uniform angle indexW平均值
Mean neighborhood patternU平均值
Mean uniform angel indexC平均值
Mean crowding degreeT2 伐前 Before thinning 0.615 5 0.529 2 0.184 0 0.415 1 伐后 After thinning 0.638 3 0.524 1 0.177 7 0.409 4 T3 伐前 Before thinning 0.509 9 0.533 2 0.226 7 0.407 4 伐后 After thinning 0.529 7 0.536 0 0.216 7 0.395 3 注:M代表混交度;W代表角尺度;U代表大小比数;C代表密集度;T2代表目标树经营密度1;T3代表目标树经营密度2。下同。Notes: M represents for mingling degree, W represents for uniform angel index, U represents for neighborhood comparison, C represents for crowding degree, T2 represents for target tree management with density 1, T3 represents for target tree management with desity 2. Same as below. 目标树的
U 平均值在0.2左右,这是由于目标树选取的大都是优势木,竞争力较强。目标树结构单元的U 平均值均有一定程度的下降,说明干扰树间伐提高了目标树的空间优势度以及大小分化程度,T3的下降幅度大于T2。目标树结构单元的C 平均值都有所下降,T3下降幅度最大。U 和C 的变化说明干扰树采伐降低了目标树结构单元的竞争压力。2.2 林分树种空间隔离程度
不同抚育间伐方式林分采伐前后M分布及林分平均混交度(
¯M )的变化情况如表4所示。3种抚育间伐后样地中零度混交的林木比例下降,极强度混交的林木比例上升,¯M 都有所提高。其中T3处理后¯M 提升幅度略高于T2,T3和T2处理后¯M 提升幅度均显著高于T1,说明相对于传统经营采取的抚育间伐,以培育目标树为导向的干扰树间伐更有利于提高林分混交度,改善林分树种间隔离程度。表 4 不同抚育间伐方式林分采伐前后M 频率分布及林分平均混交度(¯M )Table 4. M frequency distribution and mean mingling degree of different thinning treatments before and after thinning抚育间伐方式
Thinning treatment伐前 Before thinning 伐后 After thinning 频率分布 Frequency distribution ¯M 频率分布 Frequency distribution ¯M 0.00 0.25 0.50 0.75 1.00 0.00 0.25 0.50 0.75 1.00 T1 0.159 2 0.190 1 0.242 1 0.248 0 0.160 5 0.515 1 0.150 3 0.192 0 0.252 7 0.243 3 0.161 7 0.518 5 T2 0.071 0 0.173 1 0.250 0 0.277 9 0.228 0 0.604 7 0.062 3 0.165 3 0.253 9 0.289 5 0.229 0 0.614 4 T3 0.107 9 0.193 9 0.258 5 0.255 1 0.184 6 0.553 7 0.092 2 0.194 5 0.267 3 0.259 2 0.186 9 0.563 5 注:T1代表传统经营措施。Note: T1 represents for traditional management. 2.3 林分空间分布格局
不同抚育间伐方式林分采伐前后的
W 分布及林分平均角尺度(¯W )的变化情况如表5所示。3种处理下,采伐前后¯W 均大于0.517,说明林分的空间分布格局呈聚集分布。W 取值为0.5的林木比例高于50%,说明大多数林木呈随机分布,3种处理的抚育间伐均降低了林分中绝对聚集分布的林木比例。T1、T2、T3处理采伐后¯W 更靠近随机分布的取值范围,林分空间分布格局趋向合理。3种处理对林分空间分布格局的改善情况为T2 > T3 > T1,其中T2和T3的改善程度显著优于T1。说明相对于传统经营采取的抚育间伐,以培育目标树为导向的干扰树间伐更有利于改善林分的空间分布格局。表 5 不同抚育间伐方式林分采伐前后W 频率分布及林分平均角尺度(¯W )Table 5. W frequency distribution and mean value of stand uniform angel index of different thinning treatments before and after thinning抚育间伐方式
Tninning treatment伐前 Before thinning 伐后 After thinning 频率分布 Frequency distribution ¯W 频率分布 Frequency distribution ¯W 0.00 0.25 0.50 0.75 1.00 0.00 0.25 0.50 0.75 1.00 T1 0.005 9 0.167 8 0.553 3 0.196 1 0.077 0 0.542 6 0.006 7 0.165 1 0.558 6 0.196 8 0.072 8 0.540 9 T2 0.003 6 0.179 9 0.580 9 0.163 7 0.071 9 0.530 1 0.004 2 0.185 0 0.583 6 0.165 3 0.061 8 0.523 9 T3 0.004 9 0.164 2 0.578 2 0.191 4 0.061 2 0.535 0 0.006 1 0.168 0 0.584 5 0.184 3 0.057 0 0.529 5 2.4 林分大小分化程度
不同抚育间伐方式林分采伐前后的
U 分布及林分平均大小比数(¯U )变化情况如表6所示。T1、T2、T3处理的¯U 均接近0.5,说明整体大小分化程度和优势度都接近于中等水平。且U 各个取值的林木分布频率相对一致,都在20%左右。采伐后U 为0的林木比例增加,其他取值的频率分布变化无明显规律。总体上讲,3种抚育间伐对林分的大小分化度影响不大,T1、T3处理后¯U 的大小比数平均值略有下降,T2基本无变化。表 6 不同抚育间伐方式林分采伐前后U 频率分布及林分平均大小比数(¯U )Table 6. U frequency distribution and mean value of neighborhood comparison of different thinning treatments before and after thinning抚育间伐方式
Thinning treatment伐前 Before thinning 伐后 After thinning 频率分布 Frequency distribution ¯U 频率分布 Frequency distribution ¯U 0.00 0.25 0.50 0.75 1.00 0.00 0.25 0.50 0.75 1.00 T1 0.207 2 0.196 1 0.205 9 0.194 7 0.196 1 0.494 1 0.212 3 0.196 8 0.202 2 0.195 4 0.193 4 0.490 2 T2 0.207 7 0.204 6 0.194 2 0.192 0 0.201 4 0.493 7 0.209 8 0.197 2 0.201 4 0.190 6 0.200 9 0.493 9 T3 0.204 6 0.206 5 0.191 9 0.201 2 0.195 8 0.494 3 0.209 8 0.201 6 0.193 0 0.198 6 0.197 0 0.492 9 2.5 林分密集程度
不同抚育间伐方式下林分采伐前后的
C 分布及林分平均密集度(¯C )均值变化情况如表7所示,T1、T2、T3处理样地中C 取值为1.0的树木所占比例最大,说明林木很密集的结构单元较多。3种处理下¯C 都有不同程度的下降,下降幅度从高到底依次是T3、T2、T1。所有样地中C 取值为0、0.25、0.50的林木比例上升,C 取值为1的林木比例下降,说明林分的密集程度得到了改善,由很密集逐渐向比较密集过渡。表 7 不同抚育间伐方式林分采伐前后C 频率分布及林分平均密集度(¯C )Table 7. C frequency distribution and mean value of crowding degree of different thinning treatments before and after thinning抚育间伐方式
Thinning treatment伐前 Before thinning 伐后 After thinning 频率分布 Frequency distribution ¯C 频率分布 Frequency distribution ¯C 0.00 0.25 0.50 0.75 1.00 0.00 0.25 0.50 0.75 1.00 T1 0.059 9 0.138 8 0.166 4 0.221 7 0.413 2 0.338 3 0.063 3 0.140 8 0.175 2 0.217 0 0.403 6 0.336 3 T2 0.021 6 0.072 4 0.141 2 0.216 3 0.548 6 0.391 8 0.023 9 0.078 2 0.158 3 0.221 5 0.518 0 0.389 3 T3 0.018 5 0.074 8 0.163 8 0.221 1 0.521 9 0.384 1 0.021 9 0.080 4 0.183 3 0.235 7 0.478 6 0.378 1 2.6 空间结构综合指数
以上4个森林空间结构指标从不同角度说明了常规经营和目标树经营的抚育间伐对单木及林分的影响,但所得出的最优抚育间伐方式的结论并不统一。因此用空间结构综合指数(CSSI)计算各个指标的综合值,为评判森林经营措施的优劣提供直接依据。图2展示了3种抚育间伐处理下CSSI的变化。
![]() 图 2 林分空间结构综合指数(CSSI)变化情况Figure 2. Changes of comprehensive index of spatial structure (CSSI)
图 2 林分空间结构综合指数(CSSI)变化情况Figure 2. Changes of comprehensive index of spatial structure (CSSI)由图2可以看出,3种抚育间伐措施后,CSSI都得以提高,林分空间结构均有不同程度的优化,说明抚育间伐没有破坏样地中林木的空间结构情况,而是促使其更加合理。T1、T2、T3措施下CSSI的增加量分别为0.51%、1.04%和1.19%,表明基于目标树经营的抚育间伐对林分空间结构的改善情况优于传统抚育间伐,T2处理对林分的优化程度略高于T3。
3. 讨 论
相关研究表明目标树经营对促进林木生长、物种多样性并改善群落结构有积极的作用[45−47]。本研究结果表明干扰树间伐对蒙古栎次生林目标树以及林分的空间结构都有改善作用,且影响效果优于传统的抚育间伐,说明目标树经营是合理且成功的措施,与陈科屹等[48]的研究结果一致。
抚育间伐对目标树及林分林木分布格局的影响并不统一,这与吴建强等[49]的研究结果一致。认为林木分布格局具有一定的规律性,无论初始如何分布,最后都会有聚集分布转为随机分布,随机分布转为均匀分布的趋势[50−51]。大小比数这一空间结构指标在分析目标树抚育间伐前后大小分化程度时变化趋势明显,而抚育间伐前后林分的大小分化程度变化具有一定的不确定性。这与李建等[17]、赵中华等[52]的研究结果一致:大小比数更适合用于研究种群间的大小分化程度,从而确定某个或是几个种群的优势度。
本文中各个指标以及空间结构综合指数的变化幅度不大,且T2、T3差别较小。这可能是由于以下两个方面的原因:(1)研究结果体现的是蒙古栎次生林采伐初期的空间结构状况,部分林分空间结构对抚育间伐的响应需要较长时间;(2)本研究所选取的蒙古栎次生林处于中龄阶段,原则上已经晚于标准的选取目标树的时间,而此时的干扰树也较大,采伐后可能会对林分造成过大的扰动,为避免这种情况,本次抚育间伐的强度均控制在10%以内。对于之前未经过持续间伐的蒙古栎中龄林来说,为目标树生长释放足够的空间可能需要更高的采伐强度。
影响森林空间结构的因素很复杂,指标也很多,目前尚未有大家公认的统一的评价方法。本研究中所构建的林分空间综合指数是基于林分空间结构研究的3个方面和常用的4个指标,且认为林木空间分布格局、林木竞争关系与林分中间隔离程度对空间结构的贡献是相同的,这与董灵波等[38]、李建军等[53]的研究结果相一致,与曾群英等[54]、胡艳波等[55]提出的结构参数的决策优先性不一致。曹小玉等[16]认为林分的垂直结构参数近年来也被广泛研究,但鉴于研究区所在地为温带地区,林层结构相对单一,抚育间伐后的变化微乎其微,因此本研究所采用的空间结构评价指标未考虑垂直结构参数。如何加入其他表征空间结构合理指标,以及这些指标间如何进行联立值得更深入的研究。
本文侧重基于目标树经营和传统经营的抚育间伐对空间结构的初期效应,而这种初期效应可以持续多久,以及不同的抚育间伐方式和强度对森林空间结构和其他特征指标的长期影响,都值得进一步研究,为蒙古栎次生林的经营提供指导和依据。
4. 结 论
从目标树空间结构的变化来看,干扰树采伐后目标树的种间隔离程度、大小分化程度和密集程度3个方面明显改善,林木空间分布格局的变化不明显。从林分的空间结构变化来看,3种抚育间伐均提高了林分内种间隔离程度、降低了密集度,使林分空间分布格局趋向于随机分布。通过空间结构综合指数的分析来看,3种抚育间伐均对林分空间结构的改善起到了积极作用,其中基于目标树经营的抚育间伐对林分的综合空间结构改善效果要优于传统经营的抚育间伐。T3处理,即目标树选择密度约为100 株/hm2情况下采取的抚育间伐最有利于优化林分的空间结构,据此建议蒙古栎次生林可以选择目标树经营体系作业,目标树选择密度约为100 株/hm2。
-
![]()
图 1 长白山25 hm2样地地上生物量及其时间动态
Figure 1. Aboveground biomass and its temporal dynamics of 25 ha sample plot in Changbai Mountain
![]()
图 2 2019年长白山样地内不同树种地上生物量的累计百分比(A)及主要优势树种地上生物量储量(B)
Figure 2. Cumulative percentage of aboveground biomass of different tree species (A), and the aboveground biomass stock of dominate species (B) in 2019
![]()
图 3 不同调查周期内主要优势树种地上生物量年均净变化速率(A)、及其树种间生长速率在时间上的相关性(B)
Figure 3. Annual average net change rate of aboveground biomass of main dominant tree species in different survey cycles (A), and the temporal correlation of their growth rates among tree species (B)
表 1 25 hm2样地内主要优势树种种群数量、平均胸径及地上生物量年均动态变化
Table 1 Annual average dynamic change of population number, average DBH and aboveground biomass of main dominant tree species in 25 ha sample plot
树种
Tree species初始
个体数
Initial
individual number种群数量年变化
Annual change of population quantity/%初始平均
胸径
Initial
average DBH/cm
种群平均胸径年变化率
Annual change rate of population average DBH/%初始
地上生物量/
(Mg·hm−2)
Initial
aboveground
biomass/
(Mg·ha−1)地上生物量年均变化
Annual average change of aboveground biomass/%2004—
20092009—
20142014—
20192004—
20192004—
20092009—
20142014—
20192004—
20192004—
20092009—
20142014—
20192004—
2019紫椴
Tilia
amurensis3 288 −0.95 −2.08 −2.12 −1.58 28.00 1.1 1.9 1.7 1.7 82.28 0.75 0.49 0.50 0.60 水曲柳
Fraxinus
mandshurica702 −0.68 −0.53 −0.85 −0.66 47.43 0.8 0.4 1.0 0.8 54.42 0.81 0.49 0.93 0.77 蒙古栎
Quercus
mongolica937 −0.38 −0.57 −1.19 −0.69 41.62 0.4 0.5 0.8 0.6 54.27 0.49 0.35 0.28 0.38 红松
Pinus
koraiensis2 486 −0.69 −0.9 −1.44 −0.96 32.40 0.6 0.6 0.6 0.6 36.40 0.48 0.23 −0.48 0.09 色木槭
Acer mono6 767 0.09 0.89 −0.65 0.10 7.32 0.4 −1.0 0.1 −0.2 15.33 0.04 −0.66 −0.78 −0.46 大青杨
Populus
ussuriensis36 −1.11 −1.18 −3.13 −1.67 100.80 0.1 −0.2 1.6 0.5 7.63 −0.91 −0.81 −1.35 −0.97 春榆
Ulmus
japonica1 152 −0.38 0.71 −1.56 −0.39 13.95 0.8 −0.7 1.5 0.5 5.90 0.45 0.24 0.91 0.54  下载: 导出CSV
-
[1] FAO. Global forest resources assessment 2020: main report[M]. Rome: FAO Forestry Paper, 2020.
[2] Wang J, Feng L, Palmer P I, et al. Large Chinese land carbon sink estimated from atmospheric carbon dioxide data[J]. Nature, 2020, 586: 720−723. doi: 10.1038/s41586-020-2849-9
[3] Ghosh P K, Mahanta S K, Mandal D, et al. Carbon management in tropical and sub-tropical terrestrial systems[M]. Singapore: Springer, 2020.
[4] Friedlingstein P, O’sullivan M, Jones M W, et al. Global carbon budget 2020[J]. Earth System Science Data, 2020, 12(4): 3269−3340. doi: 10.5194/essd-12-3269-2020
[5] Dixon R K, Solomon A, Brown S, et al. Carbon pools and flux of global forest ecosystems[J]. Science, 1994, 263: 185−190. doi: 10.1126/science.263.5144.185
[6] Pan Y, Birdsey R A, Fang J, et al. A large and persistent carbon sink in the world’s forests[J]. Science, 2011, 333: 988−993. doi: 10.1126/science.1201609
[7] Fang J, Yu G, Liu L, et al. Climate change, human impacts, and carbon sequestration in China[J]. Proceedings of the National Academy of Sciences of the United States of America, 2018, 115(16): 4015−4020. doi: 10.1073/pnas.1700304115
[8] Tang X, Zhao X, Bai Y, et al. Carbon pools in China’s terrestrial ecosystems: new estimates based on an intensive field survey[J]. Proceedings of the National Academy of Sciences of the United States of America, 2018, 115(16): 4021−4026. doi: 10.1073/pnas.1700291115
[9] Prentice I C, Farquhar G D, Fasham M J R, et al. The carbon cycle and atmospheric carbon dioxide[M]. Cambridge: Cambridge University Press, 2001: 183−237.
[10] 郑兴波, 于大炮, 王安志, 等. 长期监测与野外控制试验揭示温带典型森林结构, 功能及演变规律[J]. 中国科学院院刊, 2019, 34(8): 948−961. Zheng X B, Yu D P, Wang A Z, et al. Long-term monitoring and field control experiments reveal the structure, function and evolution of typical temperate forests[J]. Bulletin of Chinese Academy of Sciences, 2019, 34(8): 948−961.
[11] 王清奎, 田鹏, 孙兆林, 等. 森林土壤有机质研究的现状与挑战[J]. 生态学杂志, 2020, 39(11): 3829−3843. doi: 10.13292/j.1000-4890.202011.033 Wang Q K, Tian P, Sun Z L, et al. Research on soil organic matter in forest ecosystems: Status and challenge[J]. Chinese Journal of Ecology, 2020, 39(11): 3829−3843. doi: 10.13292/j.1000-4890.202011.033
[12] 马学威, 熊康宁, 张俞, 等. 森林生态系统碳储量研究进展与展望[J]. 西北林学院学报, 2019, 34(5): 62−72. doi: 10.3969/j.issn.1001-7461.2019.05.10 Ma X W, Xiong K N, Zhang Y, et al. Research progresses and prospects of carbon storage in forest ecosystems[J]. Journal of Northwest Forestry University, 2019, 34(5): 62−72. doi: 10.3969/j.issn.1001-7461.2019.05.10
[13] 杨元合, 石岳, 孙文娟, 等. 中国及全球陆地生态系统碳源汇特征及其对碳中和的贡献[J]. 中国科学:生命科学, 2022, 52(4): 1−41. Yang Y H, Shi Y, Sun W J, et al. Terrestrial carbon sinks in China and around the world and their contribution to carbon neutrality[J]. Science China Life Sciences, 2022, 52(4): 1−41.
[14] 张颖, 李晓格, 温亚利. 碳达峰碳中和背景下中国森林碳汇潜力分析研究[J]. 北京林业大学学报, 2022, 44(1): 38−47. doi: 10.12171/j.1000-1522.20210143 Zhang Y, Li X G, Wen Y L. Forest carbon sequestration potential in China under the background of carbon emission peak and carbon neutralization[J]. Journal of Beijing Forestry University, 2022, 44(1): 38−47. doi: 10.12171/j.1000-1522.20210143
[15] Lutz J A, Furniss T J, Johnson D J, et al. Global importance of large-diameter trees[J]. Global Ecology and Biogeography, 2018, 27(7): 849−864. doi: 10.1111/geb.12747
[16] Ali A, Lin S L, He J K, et al. Big-sized trees overrule remaining trees’ attributes and species richness as determinants of aboveground biomass in tropical forests[J]. Global Change and Biology, 2019, 25(8): 2810−2824. doi: 10.1111/gcb.14707
[17] Yuan Z, Ali A, Sanaei A, et al. Few large trees, rather than plant diversity and composition, drive the above-ground biomass stock and dynamics of temperate forests in northeast China[J/OL]. Forest Ecology and Management, 2021, 481: 118698[2022−02−01]. https://doi.org/10.1016/j.foreco.2020.118698.
[18] 韩大校, 金光泽. 地形和竞争对典型阔叶红松林不同生长阶段树木胸径生长的影响[J]. 北京林业大学学报, 2017, 39(1): 9−19. doi: 10.13332/j.1000-1522.20160218 Han D X, Jin G Z. Influences of topography and competition on DBH growth in different growth stages in a typical mixed broadleaved-Korean pine forest, northeastern China[J]. Journal of Beijing Forestry University, 2017, 39(1): 9−19. doi: 10.13332/j.1000-1522.20160218
[19] 刘世荣. 提升林草碳汇潜力, 助力碳达峰碳中和目标实现[J]. 经济管理文摘, 2021(22): 3−6. Liu S R. Enhance the carbon sequestration potential of forest and grass, and help achieve the goal of carbon peak and carbon neutralization[J]. Economic Management Abstracts, 2021(22): 3−6.
[20] 郝占庆, 郭水良, 曹同. 长白山植物多样性及其格局[M]. 沈阳: 辽宁科学技术出版社, 2002. Hao Z Q, Guo S L, Cao T. Plant diversity and distribution patterns in Changbai Mountain[M]. Shenyang: Liaoning Science and Technology Publishing House, 2002.
[21] Yang H. Distribution patterns of dominant tree species on northern slope of Changbai Mountain[J]. Research of Forest Ecosystem, 1985, 5: 1−14.
[22] 姜萍, 叶吉, 吴钢. 长白山阔叶红松林大样地木本植物组成及主要树种的生物量[J]. 北京林业大学学报, 2005, 27(增刊2): 112−115. doi: 10.13332/j.1000-1522.2005.s2.029 Jiang P, Ye J, Wu G. Woody species composition and biomass of main tree species in a 25 ha plot of broad-leaved and Korean pine mixed forests of Changbai Mountain, northeast China[J]. Journal of Beijing Forestry University, 2005, 27(Suppl.2): 112−115. doi: 10.13332/j.1000-1522.2005.s2.029
[23] 郝占庆, 赵士洞, 陶大立, 等. 长白山北坡椴树红松林高等植物物种多样性[J]. 生态学杂志, 1993, 12(6): 1−5. doi: 10.3321/j.issn:1000-4890.1993.06.001 Hao Z Q, Zhao S D, Tao D L, et al. Species diversity of higher plants in lime Korean pine forest on northern slope of Changbai Mountain[J]. Chinese Journal of Ecology, 1993, 12(6): 1−5. doi: 10.3321/j.issn:1000-4890.1993.06.001
[24] Condit R. Tropical forest census plots: methods and results from Barro Colorado Island, Panama and a comparison with other plots[M]. Berlin: Springer Science & Business Media, 1998.
[25] 郝占庆, 李步杭, 张健, 等. 长白山阔叶红松林样地 (CBS): 群落组成与结构[J]. 植物生态学报, 2008, 32(2): 238−250. doi: 10.3773/j.issn.1005-264x.2008.02.002 Hao Z Q, Li B H, Zhang J, et al. Broad-leaved Korean pine (Pinus koraiensis) mixed forest plot in Changbaishan (CBS) of China: community composition and structure[J]. Chinese Journal of Plant Ecology, 2008, 32(2): 238−250. doi: 10.3773/j.issn.1005-264x.2008.02.002
[26] 王利伟, 李步杭, 叶吉, 等. 长白山阔叶红松林树木短期死亡动态[J]. 生物多样性, 2011, 19(2): 260−270. doi: 10.3724/SP.J.1003.2011.11279 Wang L W, Li B H, Ye J, et al. Dynamics of short-term tree mortality in broad-leaved Korean pine (Pinus koraiensis) mixed forest in the Changbai Mountains[J]. Biodiversity Science, 2011, 19(2): 260−270. doi: 10.3724/SP.J.1003.2011.11279
[27] Brown S. Measuring carbon in forests: current status and future challenges[J]. Environmental Pollution, 2002, 116(3): 363−372. doi: 10.1016/S0269-7491(01)00212-3
[28] 李晓娜, 国庆喜, 王兴昌, 等. 东北天然次生林下木树种生物量的相对生长[J]. 林业科学, 2010, 46(8): 22−32. doi: 10.11707/j.1001-7488.20100804 Li X N, Guo Q X, Wang X C, et al. Allometry of understory tree species in a natural secondary forest in northeast China[J]. Scientia Silvae Sinicae, 2010, 46(8): 22−32. doi: 10.11707/j.1001-7488.20100804
[29] Wang C. Biomass allometric equations for 10 co-occurring tree species in Chinese temperate forests[J]. Forest Ecology and Management, 2006, 222(1−3): 9−16. doi: 10.1016/j.foreco.2005.10.074
[30] 刘文慧. 长白山阔叶红松林不同演替阶段灌木层在群落生产力中的地位及其与更新的关系[D]. 北京: 北京林业大学, 2012. Liu W H. The status of shrub in community productivity and the relevance with regeneration of broad-leaved Korean pine forest in Changbai Mountains at its different succession stages[D]. Beijing: Beijing Forestry University, 2012.
[31] Loreau M, de Mazancourt C. Species synchrony and its drivers: neutral and nonneutral community dynamics in fluctuating environments[J]. American Naturalist, 2008, 172(2): E48−E66. doi: 10.1086/589746
[32] Chave J, Réjou-Méchain M, Búrquez A, et al. Improved allometric models to estimate the aboveground biomass of tropical trees[J]. Global Change Biology, 2014, 20(10): 3177−3190. doi: 10.1111/gcb.12629
[33] Anderson-Teixeira K J, Davies S J, Bennett A C, et al. CTFS-Forest GEO: a worldwide network monitoring forests in an era of global change[J]. Global Change Biology, 2015, 21(2): 528−549. doi: 10.1111/gcb.12712
[34] 马克平, 徐学红. 中国森林生物多样性监测网络有力支撑生物群落维持机制研究[J]. 中国科学:生命科学, 2020, 50(4): 359−361. Ma K P, Xu X H. Chinese forest biodiversity monitoring network well developed for community assembly studies[J]. Science China Life Sciences, 2020, 50(4): 359−361.
[35] 徐远杰, 林敦梅, 米湘成, 等. 古田山不同干扰程度森林的群落恢复动态[J]. 生物多样性, 2014, 22(3): 358−365. doi: 10.3724/SP.J.1003.2014.13202 Xu Y J, Lin D M, Mi X C, et al. Recovery dynamics of secondary forests with different disturbance intensity in the Gutianshan National Nature Reserve[J]. Biodiversity Science, 2014, 22(3): 358−365. doi: 10.3724/SP.J.1003.2014.13202
[36] 林豹雨. 广东省黑石顶亚热带森林地上生物量分布和变异的研究[D]. 广州: 中山大学, 2017. Lin B Y. Aboveground biomass distribution and variation in a subtropical forest of China [D]. Guangzhou: Sun Yat-sen University, 2017.
[37] Bastin J F, Rutishauser E, Kellner J R, et al. Pan-tropical prediction of forest structure from the largest trees[J]. Global Ecology and Biogeography, 2018, 27(11): 1366−1383. doi: 10.1111/geb.12803
[38] Phillips O L, Brienen R J J C B. Carbon uptake by mature Amazon forests has mitigated Amazon nations’ carbon emissions[J]. Carbon Balance and Management, 2017, 12(1): 1−9. doi: 10.1186/s13021-016-0069-2
[39] Feeley K J, Joseph W S, Nur S M N, et al. Decelerating growth in tropical forest trees[J]. Ecology Letters, 2007, 10(6): 461−469. doi: 10.1111/j.1461-0248.2007.01033.x
[40] Pregitzer K S, Euskirchen E S. Carbon cycling and storage in world forests: biome patterns related to forest age[J]. Global Change Biology, 2004, 10(12): 2052−2077. doi: 10.1111/j.1365-2486.2004.00866.x
[41] Chave J, Condit R, Lao S, et al. Spatial and temporal variation of biomass in a tropical forest: results from a large census plot in Panama[J]. Journal of Ecology, 2003, 91(2): 240−252. doi: 10.1046/j.1365-2745.2003.00757.x
[42] van der Heijden M G, Streitwolf-Engel R, Riedl R, et al. The mycorrhizal contribution to plant productivity, plant nutrition and soil structure in experimental grassland[J]. New Phytologist, 2006, 172(4): 739−752. doi: 10.1111/j.1469-8137.2006.01862.x
[43] Smith S E, Read D J. Mycorrhizal symbiosis[M]. New York: Academic Press, 2010.
[44] Lebauer D S, Treseder K K. Nitrogen limitation of net primary productivity in terrestrial ecosystems is globally distributed[J]. Ecology, 2008, 89(2): 371−379. doi: 10.1890/06-2057.1
[45] Lilleskov E A, Kuyper T W, Bidartondo M I, et al. Atmospheric nitrogen deposition impacts on the structure and function of forest mycorrhizal communities: a review[J]. Environmental Pollution, 2019, 246: 148−162. doi: 10.1016/j.envpol.2018.11.074
[46] Shi L, Wang J, Liu B, et al. Ectomycorrhizal fungi reduce the light compensation point and promote carbon fixation of Pinus thunbergii seedlings to adapt to shade environments[J]. Mycorrhiza, 2017, 27(8): 823−830. doi: 10.1007/s00572-017-0795-7
[47] Niinemets Ü, Bilger W, Kull O, et al. Acclimation to high irradiance in temperate deciduous trees in the field: changes in xanthophyll cycle pool size and in photosynthetic capacity along a canopy light gradient[J]. Plant, Cell and Environment, 1998, 21(12): 1205−1218. doi: 10.1046/j.1365-3040.1998.00364.x
[48] Malhado A C, Whittaker R J, Malhi Y, et al. Are compound leaves an adaptation to seasonal drought or to rapid growth? Evidence from the Amazon rain forest[J]. Global Ecology and Biogeography, 2010, 19(6): 852−862. doi: 10.1111/j.1466-8238.2010.00567.x
[49] Yang D, Zhang Y J, Song J, et al. Compound leaves are associated with high hydraulic conductance and photosynthetic capacity: evidence from trees in Northeast China[J]. Tree Physiology, 2019, 39(5): 729−739. doi: 10.1093/treephys/tpy147
[50] Song J, Trueba S, Yin X H, et al. Hydraulic vulnerability segmentation in compound-leaved trees: evidence from an embolism visualization technique[J]. Plant Physiology, 2022, 189(1): 204−214. doi: 10.1093/plphys/kiac034
[51] Wilson R, Anchukaitis K, Briffa K R, et al. Last millennium northern hemisphere summer temperatures from tree rings (Part I): the long term context[J]. Quaternary Science Reviews, 2016, 134: 1−18. doi: 10.1016/j.quascirev.2015.12.005
[52] Fritts H. Tree rings and climate [M]. New York: Academic Press, 1976.
[53] Yu D, Liu J, Zhou L, et al. Spatial variation and temporal instability in the climate-growth relationship of Korean pine in the Changbai Mountain region of Northeast China[J]. Forest Ecology and Management, 2013, 300: 96−105. doi: 10.1016/j.foreco.2012.06.032
[54] 于健. 长白山阔叶红松林主要树种径向生长对气候变化响应及温度重建[D]. 北京: 北京林业大学, 2019. Yu J. Rosponse of radial growth of main tree species of broadleaved Korean pine forest to climate change in Changbai Mountain and temperature reconstruction[D]. Beijing: Beijing Forestry University, 2019.
[55] 朱良军. 4 个温带硬阔导管特征与径向生长对气候变化的响应[D]. 哈尔滨: 东北林业大学, 2019. Zhu L J. Response to climtate change of vessel features and radial growth of four hardwood spcies from temperate forests of Northeast China [D]. Harbin: Northeast Forestry University, 2019.
[56] 蔡礼蓉, 匡旭, 房帅, 等. 长白山阔叶红松林 3 个常见树种径向生长的影响因素[J]. 应用生态学报, 2017, 28(5): 1407−1413. Cai L R, Kuang X, Fang S, et al. Factors influencing tree radial growth of three common species in broad-leaved Korean pine mixed forests in Changbai Mountains, China[J]. Chinese Journal of Applied Ecology, 2017, 28(5): 1407−1413.
[57] 韩艳刚, 周旺明, 齐麟, 等. 长白山树木径向生长对气候因子的响应[J]. 应用生态学报, 2019, 30(5): 1513−1520. Han Y G, Zhou W M, Qi L, et al. Tree radial growth-climate relationship in Changbai Mountain, Northeast China[J]. Chinese Journal of Applied Ecology, 2019, 30(5): 1513−1520.
[58] Sherry R A, Zhou X, Gu S, et al. Divergence of reproductive phenology under climate warming[J]. Proceedings of the National Academy of Sciences of the United States of America, 2007, 104(1): 198−202. doi: 10.1073/pnas.0605642104
[59] Loreau M, de Mazancourt C. Biodiversity and ecosystem stability: a synthesis of underlying mechanisms[J]. Ecology Letters, 2013, 16: 106−115. doi: 10.1111/ele.12073
[60] Yuan Z, Ali A, Wang S, et al. Temporal stability of aboveground biomass is governed by species asynchrony in temperate forests[J/OL]. Ecological Indicators, 2019, 107: 105661[2021−11−21]. https://doi.org/10.1016/j.ecolind.2019.105661.
[61] Qiao X, Geng Y, Zhang C, et al. Spatial asynchrony matters more than alpha stability in stabilizing ecosystem productivity in a large temperate forest region[J]. Global Ecology and Biogeography, 2022, 31(6): 1133−1146.
[62] 于贵瑞, 郝天象, 朱剑兴. 中国碳达峰, 碳中和行动方略之探讨[J]. 中国科学院院刊, 2022, 37(4): 423−434. Yu G R, Hao T X, Zhu J X. Discussion on action strategies of China’s carbon peak and carbon neutrality[J]. Bulletin of Chinese Academy of Sciences, 2022, 37(4): 423−434.
-
期刊类型引用(1)
1. 周肖,陈昊,时映,陈烽,王叶,王垚,杨亮. 膨润土改性及其在缓释农药载体上的应用研究与展望. 植物医学. 2023(03): 31-40 .  百度学术
百度学术
其他类型引用(2)


计量
- 文章访问数: 1059
- HTML全文浏览量: 218
- PDF下载量: 170
- 被引次数: 3
