
Research on the assessment of riverfront green space based on urban vitality impact: taking Beijing Haidian District as an example
-
摘要:目的
基于活力影响构建城市滨河绿地评价体系,从不同维度探讨滨河绿地对其自身及周边街区活力的影响,为城市滨河绿地的评价方法及更新策略提供科学依据。
方法(1)构建递阶层次城市滨河绿地评价模型,运用层次分析法-熵值法组合赋权,TOPIS法进行数据综合。(2)采用地理探测器因子探测,评估滨河绿地准则层各维度质量、各指标层单一环境要素对场地和周边街区活力影响。(3)采用交互探测,评估各环境要素评价维度交互作用对场地和周边街区活力影响。
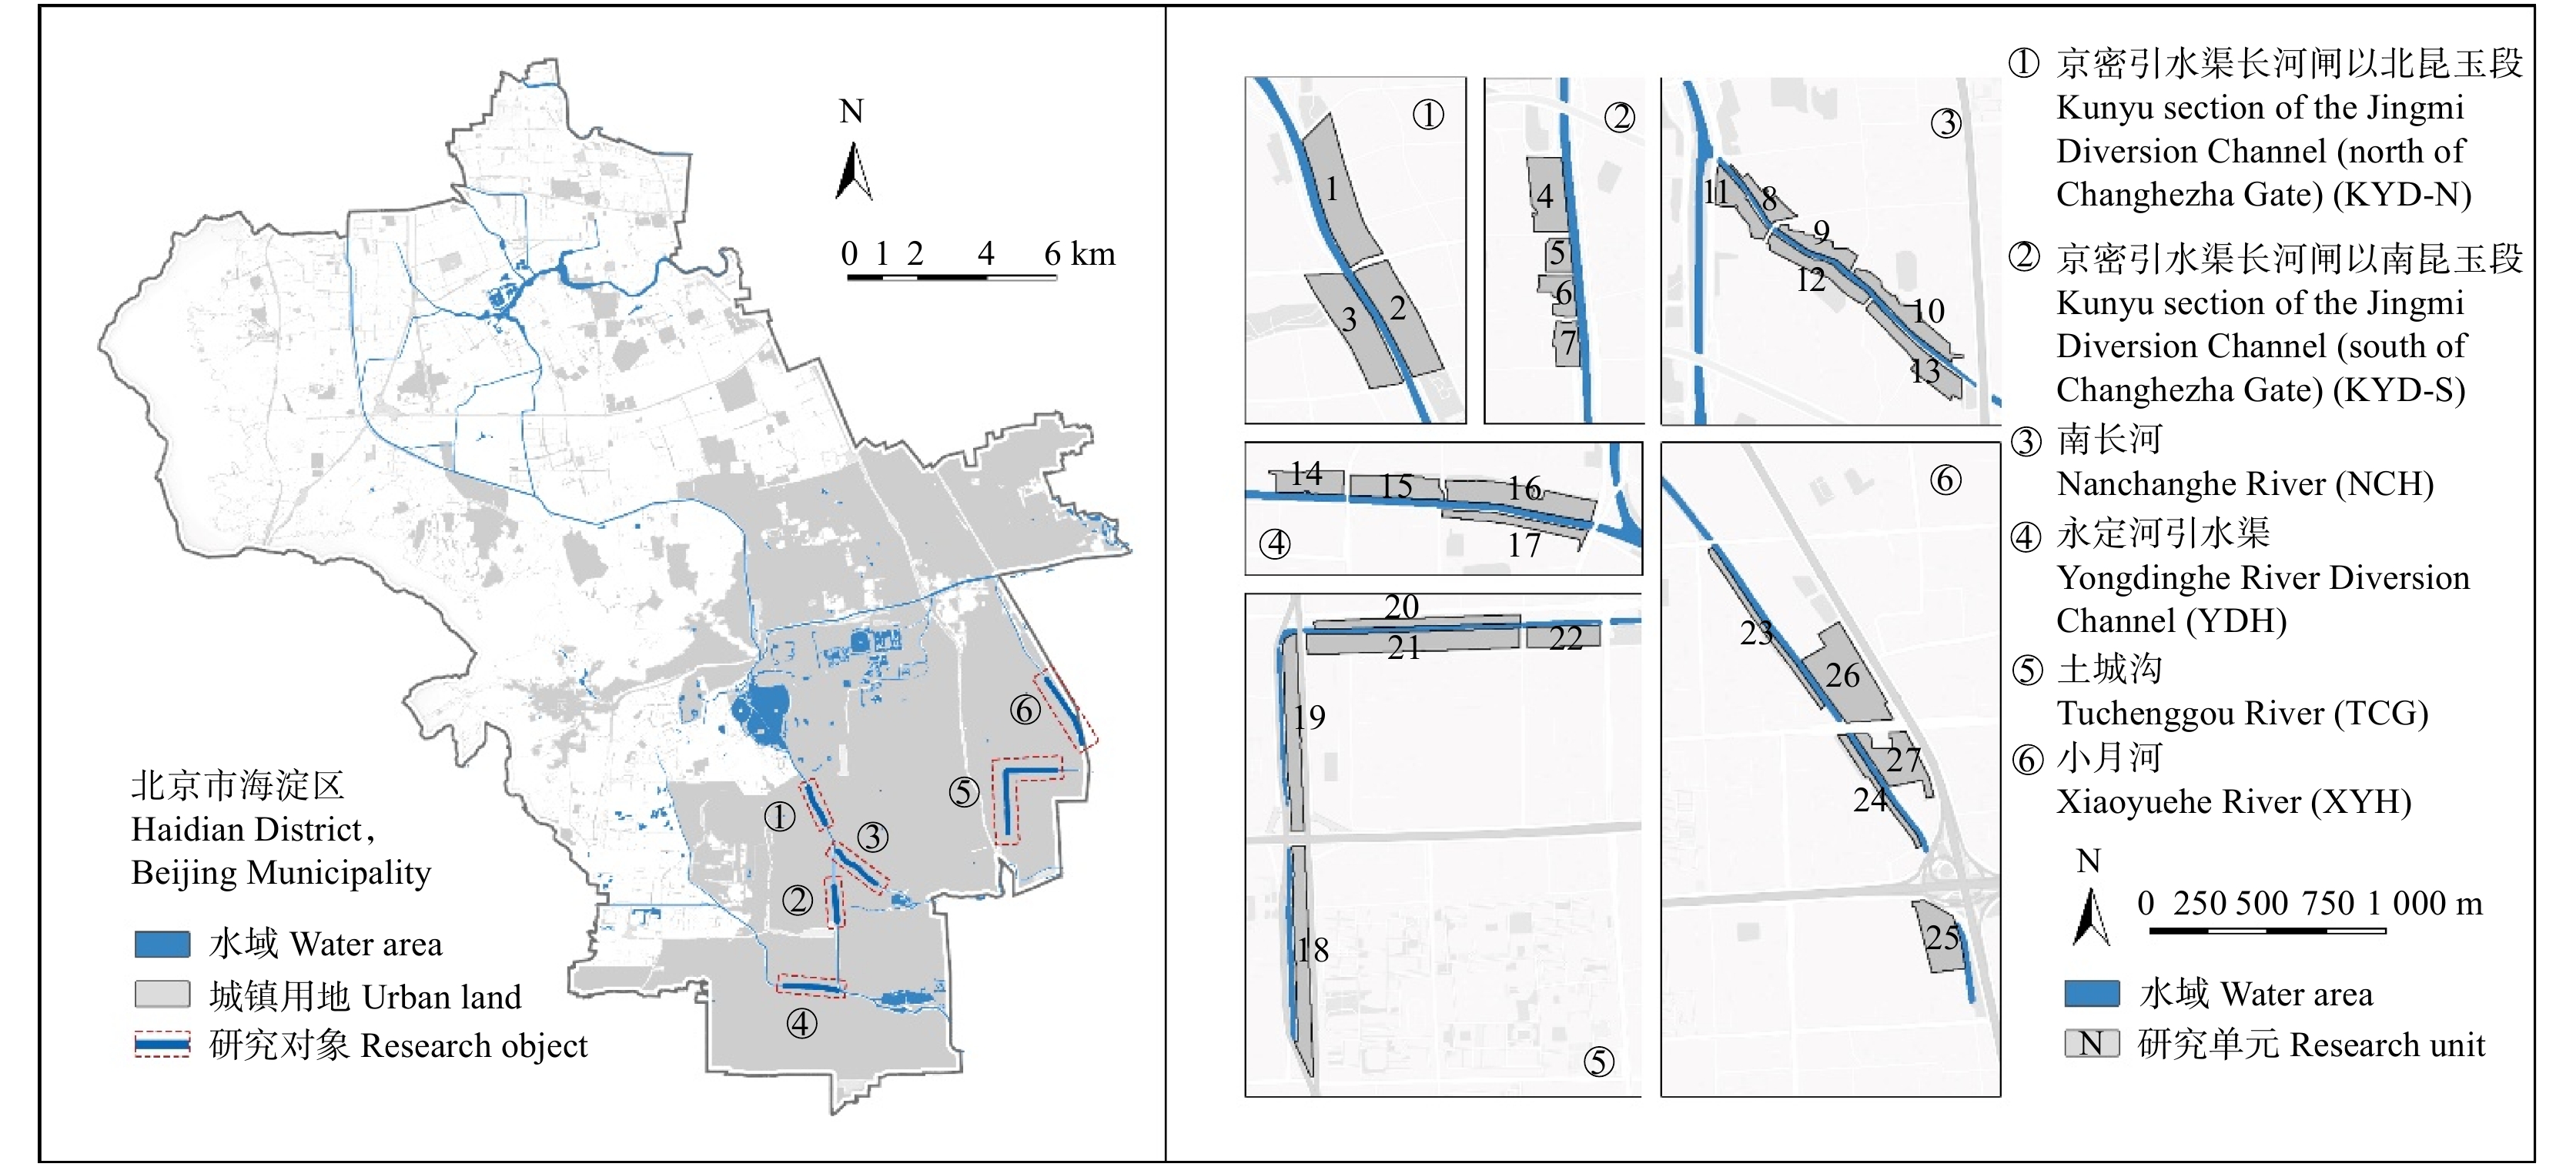
结果(1)研究构建包含区位环境、河道空间形态、水岸空间形态、生态环境质量、设施服务质量、可达性6个准则层31个指标的城市滨河绿地评价模型。(2)海淀6段典型河段27个研究单元的评价结果显示:研究单元中,研究单元21最佳,研究单元26最差。河段中,土城沟、南长河评价较好;京密引水渠由于区位环境与可达性不佳,评价居中;永定河引水渠、小月河评价较差,归因于河道空间形态的局限性和生态环境质量较差。(3)指标层方面,场地活力与周边街区建筑密度、单元形状指数、外侧道路等级值显著相关,而周边建筑密度、单元文化和休憩设施密度对周边街区活力体现出高解释力。(4)准则层方面,单一维度准则层环境要素对场地活力影响有限,周围街区活力与设施服务质量相关性显著;双因子交互探测均呈现对活力解释的增强作用。区位环境与设施服务质量两者协同对场地活力和周边街区活力都有着最高解释水平。
结论(1)研究构建的评价体系能够一定程度支撑城市滨河绿地系统性评估,并提供优化参考。(2)南长河和土城沟的总体品质较高,京密引水渠昆玉段需通过降低道路等级、增加人行天桥等方式提升滨河绿地可达性,而小月河、永定河引水渠等河段则应通过覆绿、近自然化改造等方式改善现状硬质驳岸,营建多类型亲水场所,并通过塑造多种乡土植物群落以提供健康的生态环境和多样自然风景。(3)总体建议方面,应重视区位环境条件,强调形态、品质与可达性的均衡发展,而在部分维度受限时,则应优先关注设施服务质量和生态环境质量建设。(4)实施策略方面,提升绿地边界形状不规则度,降低绿地与周边街区间的道路等级,是增强滨河绿场地活力的有效途径;而增加滨河绿地内部文化、休憩场所设施类型与密度,增加民众亲水机会,塑造更为开敞体验感受等则是提升周边街道活力的多种方式。
Abstract:ObjectiveThis paper aims to construct an assessment system for urban riverfront green spaces based on the influence of vitality and to explore the impact of riverfront green spaces on their own and surrounding neighborhood vitality from different dimensions, and provide a scientific basis for the assessment methods and renewal strategies of urban riverfront green areas.
Method(1) This study constructed a model of urban riverfront green space assessment, applying analytic hierarchy process-entropy value method combined with weighting and TOPIS method for data synthesis. (2) Geodetector factor detection was used to assess the influence of quality of each dimension of the riverfront green space criterion layer and the single environmental factor of each index layer. (3) Interaction detection was used to assess the interaction between two dimensions of the criterion layer on vitality.
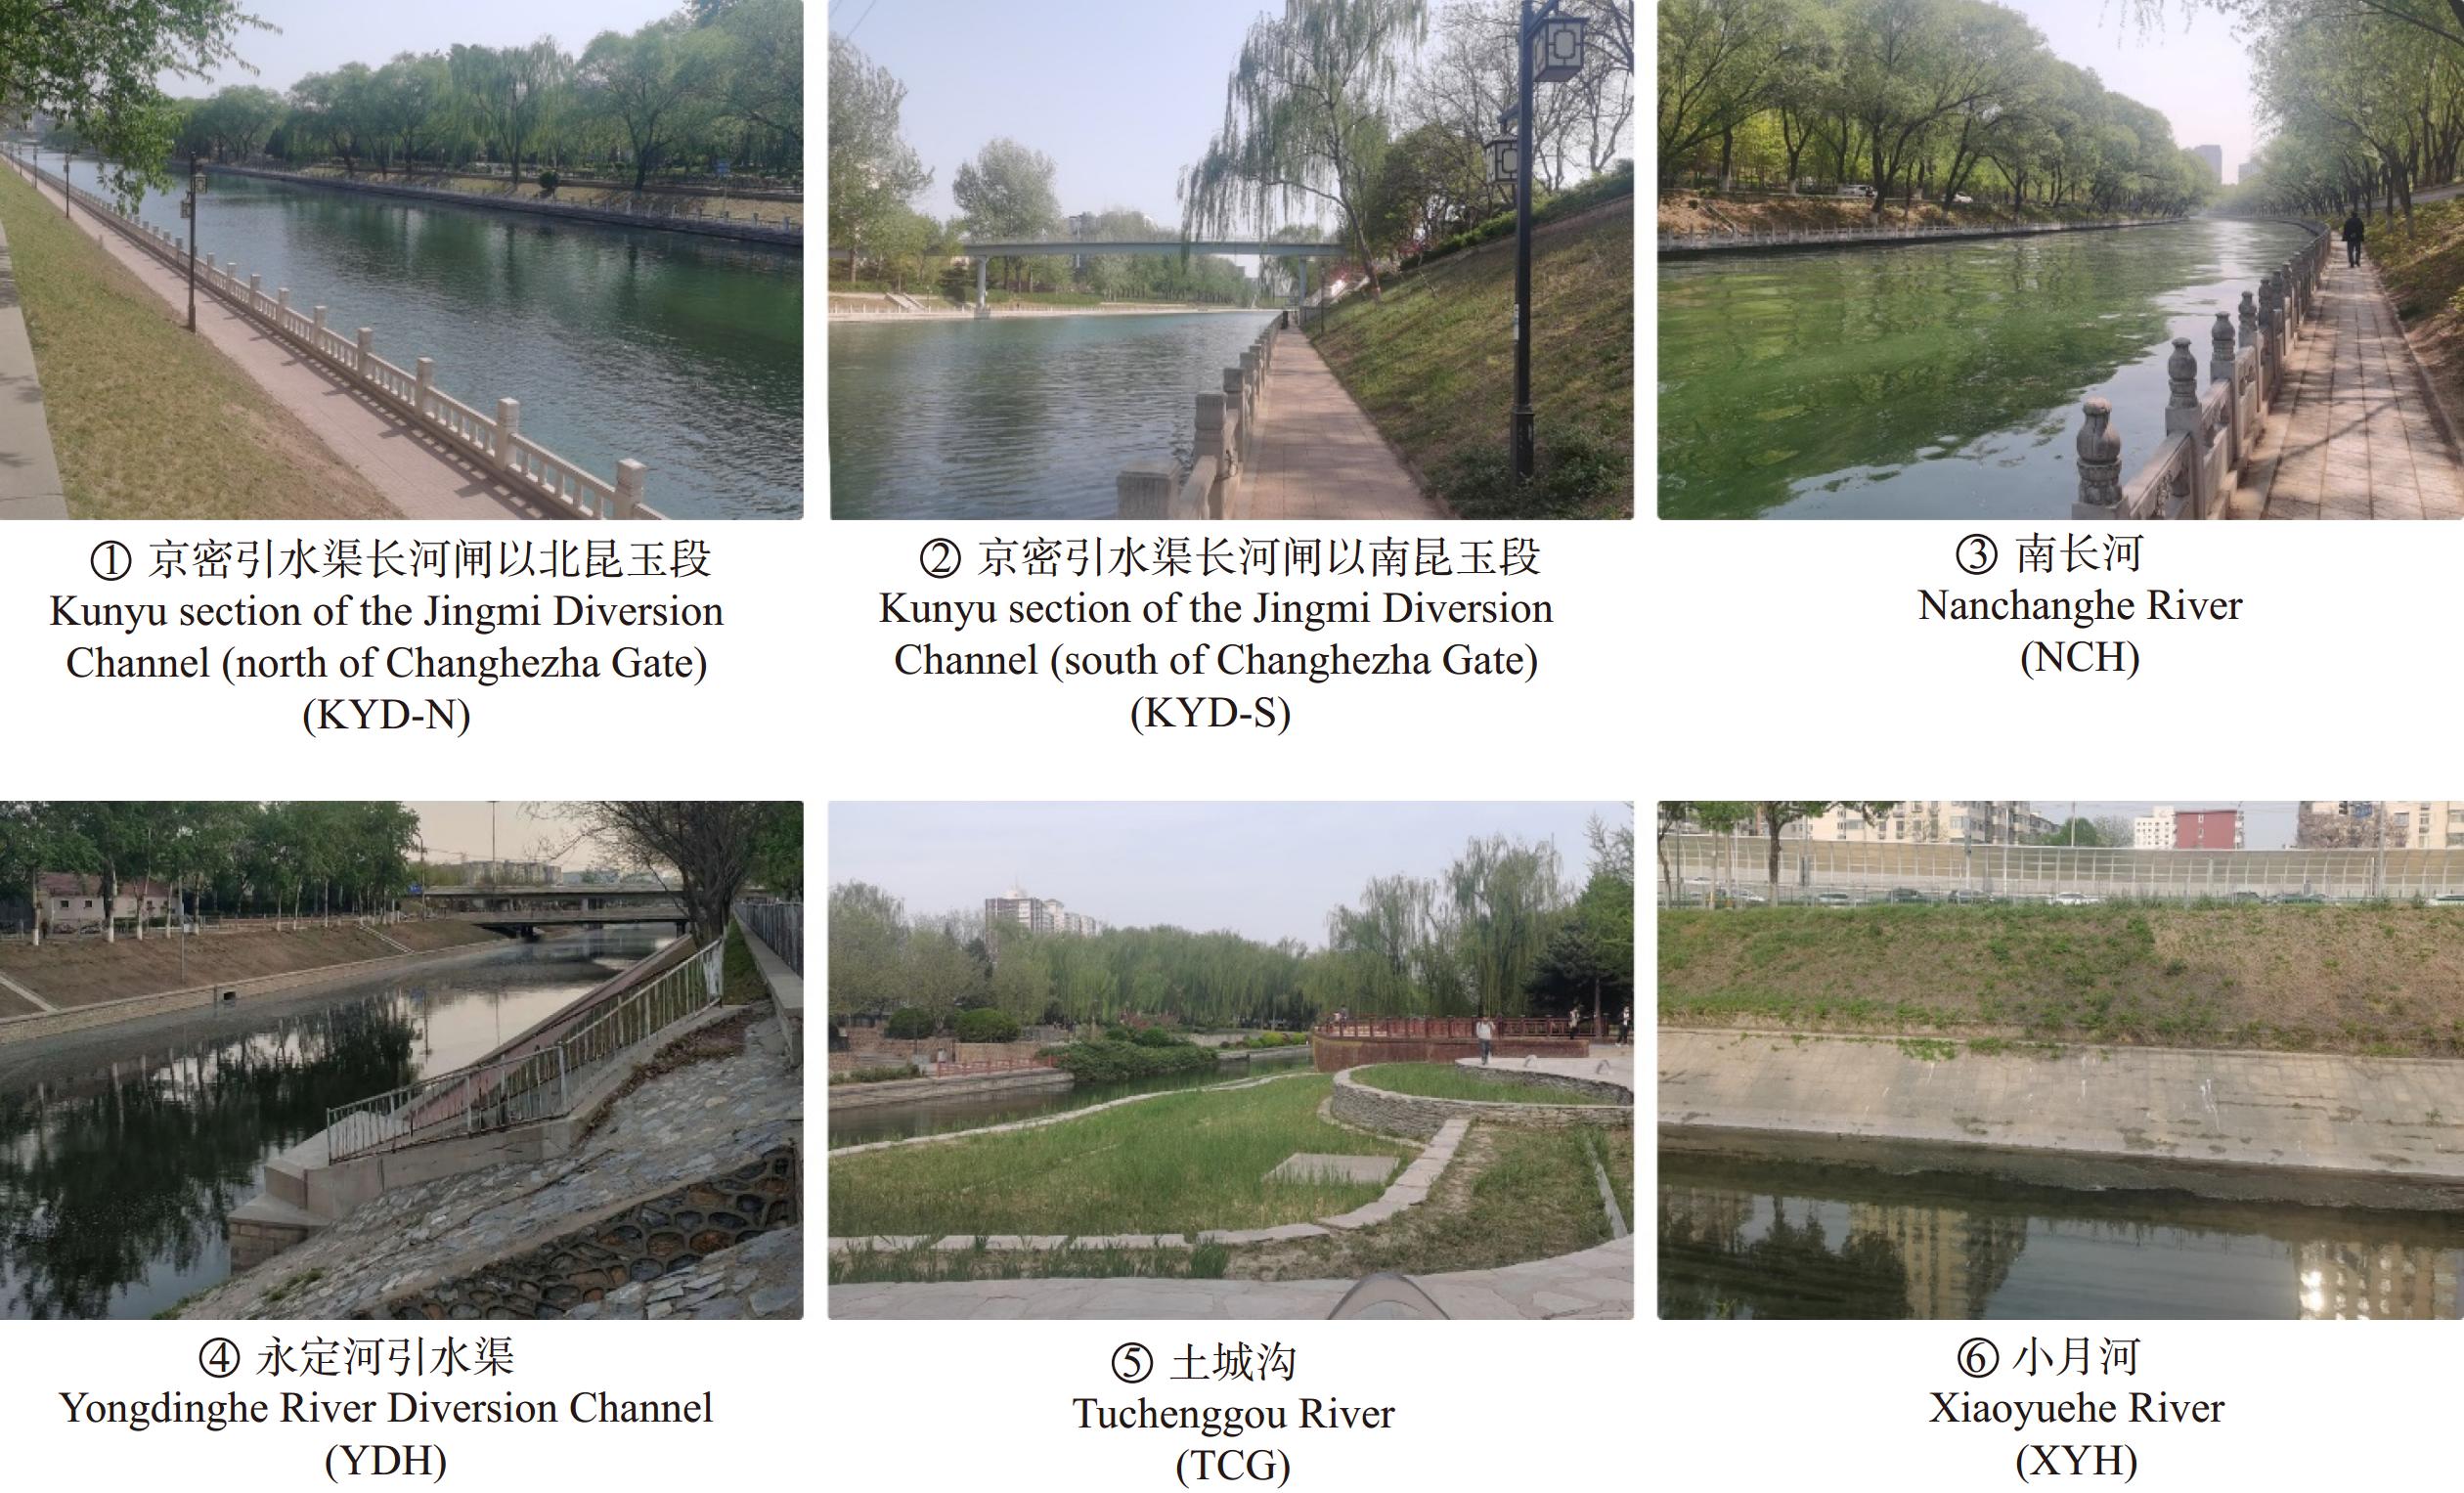
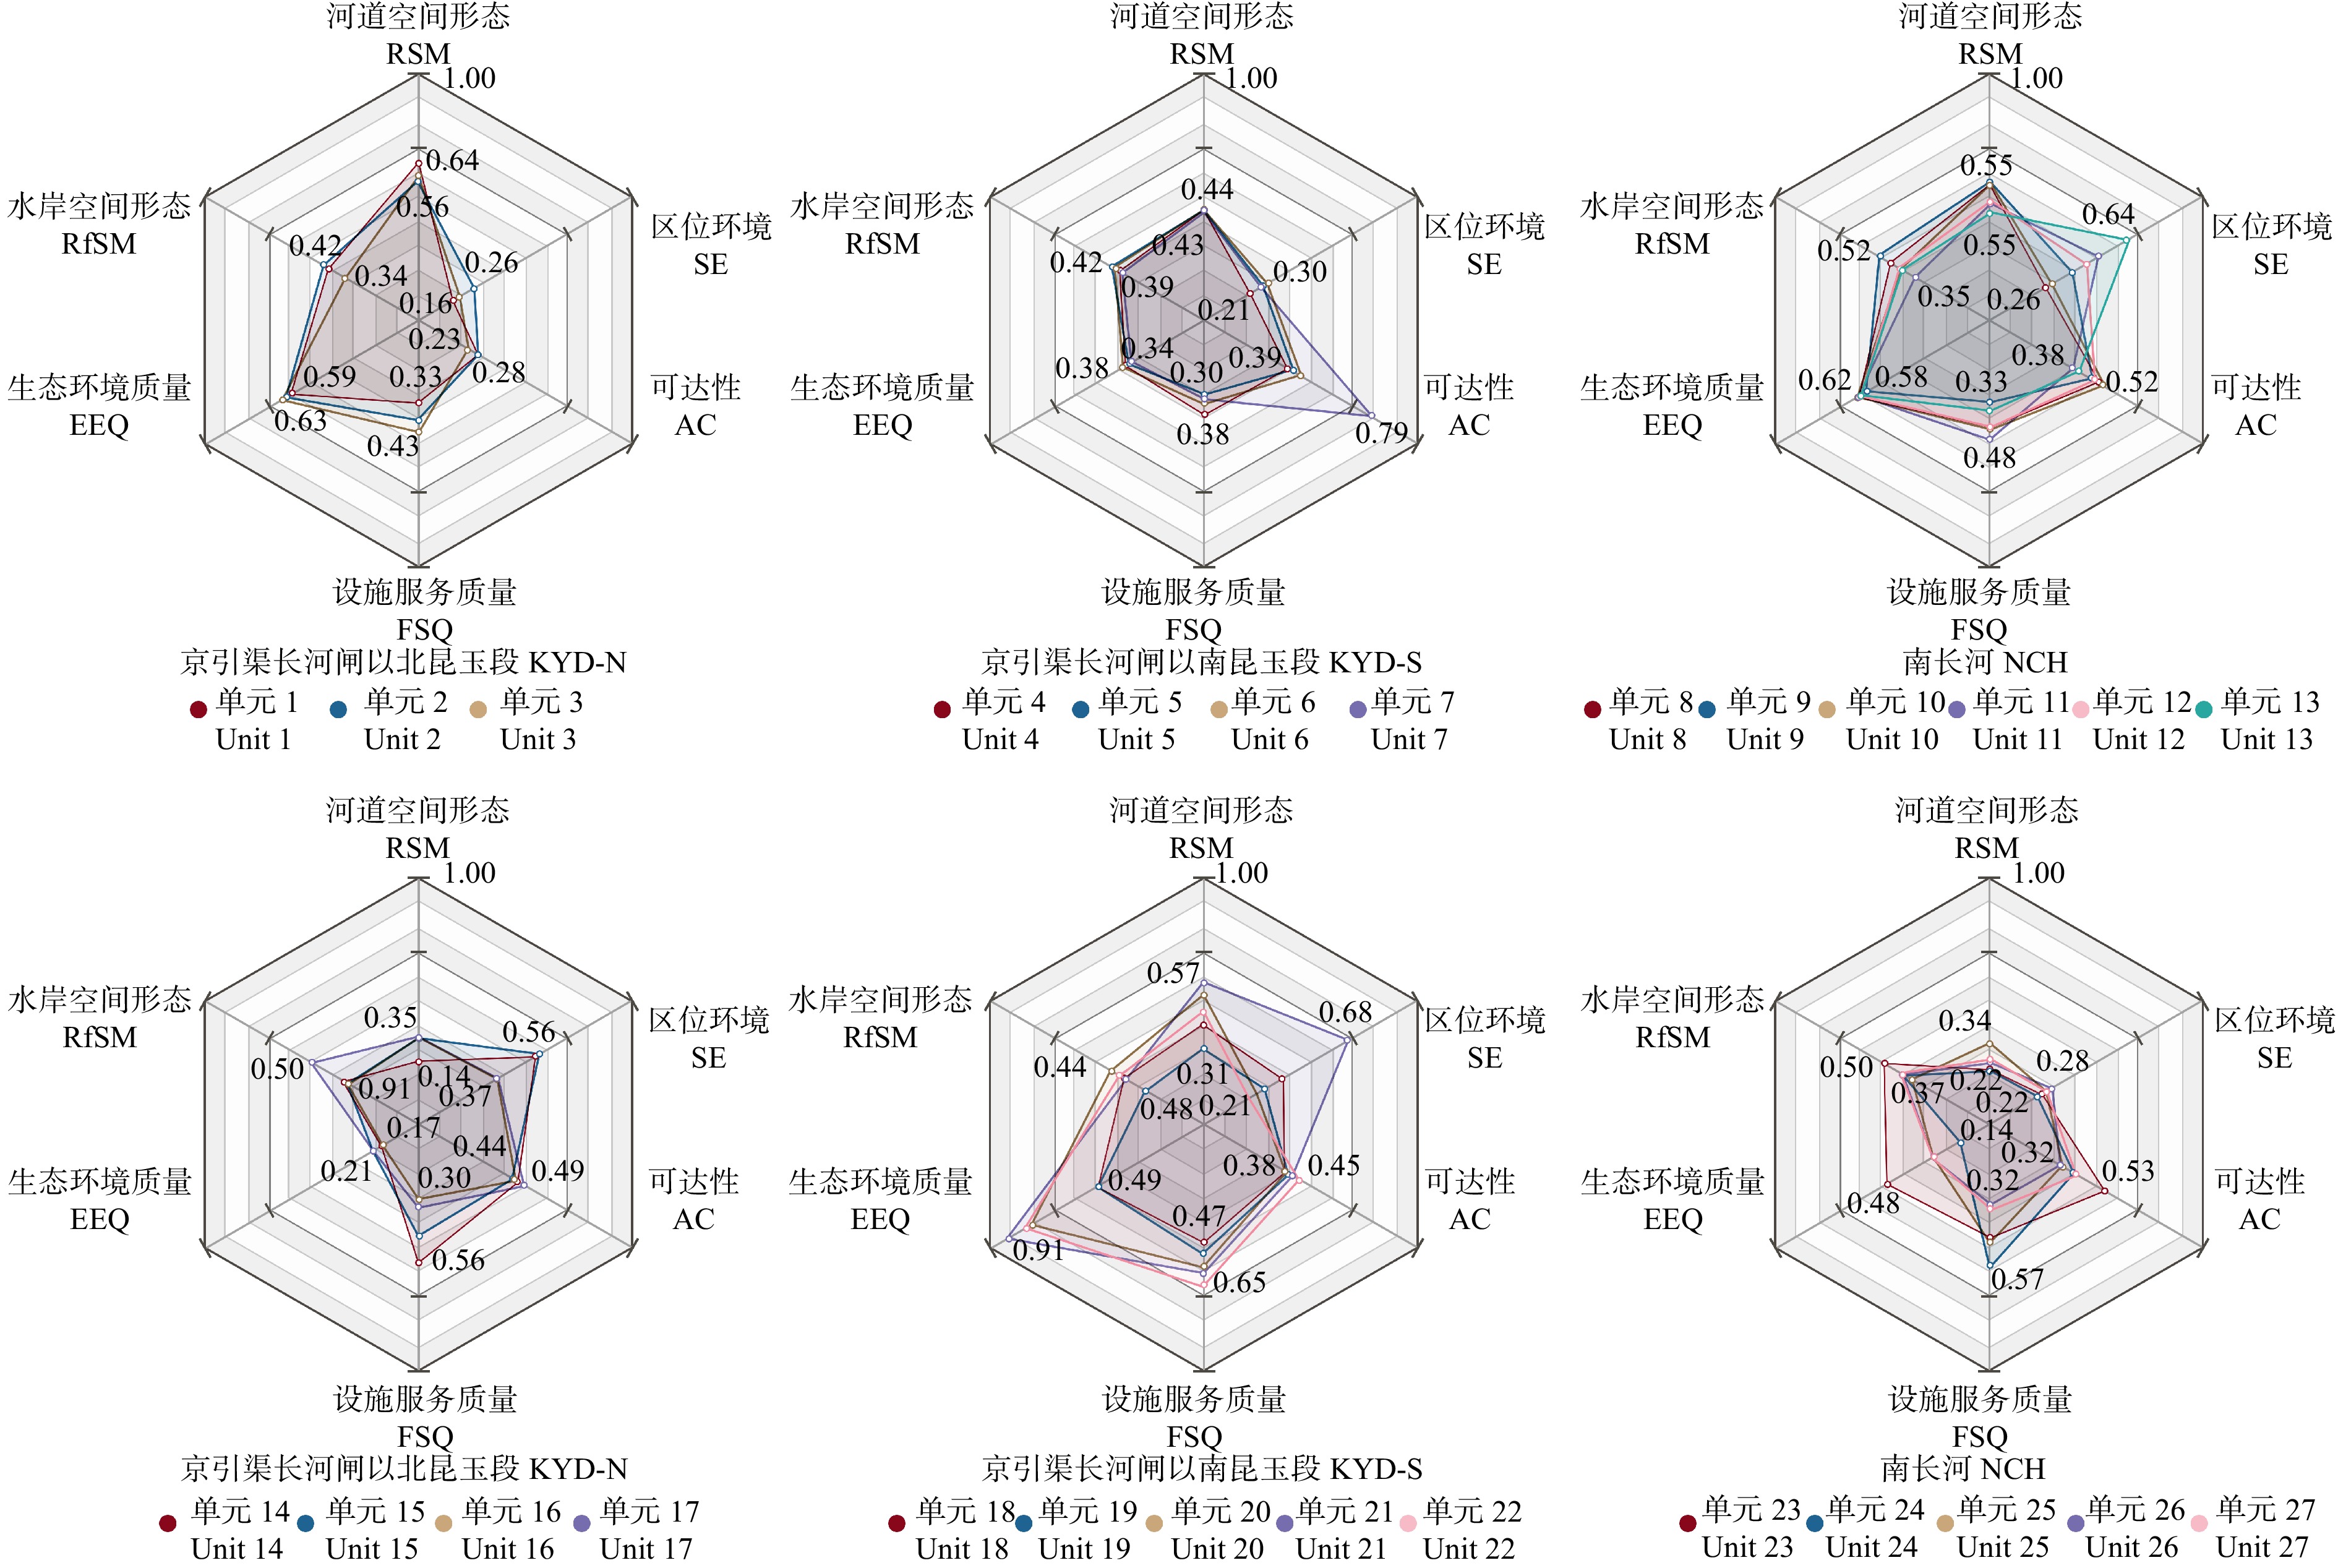
Result(1) The study constructed an urban riverfront green space assessment model containing 31 indicators in 6 criteria layers: surrounding environment, river spatial morphology, waterfront spatial morphology, ecological environment quality, facility service quality and accessibility. (2) The assessment results of 27 study units in 6 typical river sections in Haidian District of Beijing showed that among the study units, unit 21 was the best and unit 26 was the worst. Among the river sections, Tuchenggou and Nanchanghe River were better assessed; Jingmi Diversion Channel was in the middle due to its poor location and accessibility; Yongdinghe River Diversion Channel and Xiaoyuehe River were poorly assessed, which was attributed to the limitation of the river spatial morphology and the poor quality of ecological environment. (3) In the indicator layer, site vitality was significantly correlated with the building density of surrounding neighbourhoods, unit shape index and external road grade, while the density of cultural and leisure facilities had the highest explanatory power for the surrounding neighbourhood vitality. (4) For the criterion layer, the environmental factors of the single-dimensional criterion layer had limited influence on site vitality, and the surrounding neighborhood vitality was significantly correlated with the quality of facility services. The two-factor interaction of the criterion layers all showed an enhanced effect on the explanation of vitality. The synergy between the surrounding environment and the facility service quality had the highest level of explanation for site vitality and surrounding neighbourhoods vitality.
Conclusion(1) The assessment system constructed by the study can, to a certain extent, support the comprehensive assessment of urban riverfront green spaces and provide a basis for renewal and optimisation at different levels. (2) The Nanchanghe River and Tuchenggou River are of high quality, while the Kunyu Section of the Jingmi Diversion Channel should be upgraded by lowering the road level and adding pedestrian bridges, while the Xiaoyuehe River and Yongdinghe Diversion Channel should be improved through greening and near-naturalisation, creating a variety of water-friendly places, and providing a healthy ecological environment and diverse natural scenery through the formation of a variety of native plant communities. (3) In terms of general recommendations, importance should be laid on the environmental conditions of the district, emphasizing the balanced development of form, quality and accessibility, while when some of the dimensions are limited, priority should be given to the construction of facility service quality and ecological environment quality. (4) In terms of specific implementation strategies, enhancing the irregularity of the green space boundary and reducing the road level between the green space and the surrounding neighbourhoods are effective ways to enhance the site vitality of the riverfront green space. Increasing the type and density of cultural and leisure facilities within the riverfront green space, increasing the waterfront opportunities for the public, and creating a more open experience are effective means to enhance the surrounding neighbourhood vitality.
-
土壤有机碳(soil organic carbon,SOC)是森林生态系统动力学的重要组成部分,是表征土壤生物化学质量的重要内容[1-2]。地球表层1 m土层深度的SOC储量(约1 400 ~ 1 500 Gt)超过了植被碳库和大气碳库的总量。其含量大小决定于有机质输入和土壤有机质分解速率的平衡调节[3-5]。林火干扰作为森林非连续的生态因子,是生物地球化学循环的关键驱动因子,其通过改变底物的数量和理化性质进而影响生态系统结构和功能,具有多种生态效应和环境影响[6]。SOC不仅影响土壤的物理化学和生物性质,同时在土壤结构和土壤肥力中也起到重要作用。
土壤活性有机碳(labile organic carbon,LOC)作为土壤有机碳的重要组分,亦是活跃成分,其在凋落物分解和土壤碳循环中发挥重要作用[7-8],已成为土壤养分转化的主要驱动力,同时亦是土壤微生物活动的主要能源[9]。活性有机碳在有机碳中所占比例较小,但对土壤养分的驱动反应比土壤有机碳更为敏感,可作为土壤有机碳变化的指示物。根据分离及测定方法的不同,土壤活性有机碳常用土壤微生物量碳(microbial biomass carbon,MBC),可溶性有机碳(dissolved organic carbon,DOC),易氧化有机碳(soil easily oxidizable carbon,EOC)和颗粒有机碳(particulate organic carbon,POC)等来表征[10-12]。林火干扰是森林生态系统中重要的生态干扰因子之一,燃烧过程中通过热量传播,烧毁地表可燃物,进而对土壤理化性质、有机碳各组分产生相应的影响[6,11]。火干扰改变了森林生态系统土壤和大气之间碳素的交换,将具有生物活性的物质转变成无机的芳香族大分子,同时土壤有机碳的不同组分对林火的响应与敏感性程度也不同。为此,研究土壤有机碳及其组分的动态变化是更好地理解气候—碳循环反馈的先决条件,已成为全球气候变化研究中学者们关注的三大热点之一[13-14]。
目前关于不同土地利用方式和林火干扰对土壤有机碳组分已有较多研究[9,15-18]。但许多研究只注意到林火干扰对表层土壤(0 ~ 20 cm)的影响,而对土壤浅层(20 ~ 40 cm),尤其是土壤深层(40 ~ 100 cm)的影响缺乏关注。因而定量研究林火干扰对森林土壤有机碳密度的影响,有利于减少全球碳平衡估算中的不确定性。为此本文针对广东省杉木林在林火干扰后土壤有机碳密度发生的变化进行定量化研究,探讨林火干扰对土壤有机碳密度的影响机制,从而有助于了解森林生态系统中各碳库的碳循环与碳分配过程,为制定科学合理的旨在减缓全球变化的林火管理措施具有重要意义。同时为了解林火干扰对生态系统碳平衡的影响提供参考数据,亦为火烧迹地恢复、森林的修复与碳减排增汇效应提供科学支持。
1. 材料与方法
1.1 研究区概况
广东省位于祖国大陆最南端,是自然资源大省(20°09′ ~ 25°31′N、109°45′ ~ 117°20′E)。截至2017年底,全省森林面积为1.088 × 10⁷ hm2,森林覆盖率达59.08%,森林蓄积量是5.83亿m3。年平均降水量为1 777 mm。年平均气温22.3 ℃,7月平均气温约为28 ~ 29 ℃,平均日照时数为1 745.8 h,属于热量较充足的地区,同时又具有温湿润的气候基本特征,属于东亚季风区。地带性土壤主要为赤红壤、砖红壤、红壤、黄壤等。现有森林植被分布为近似热带雨林型−亚热带常绿季雨林−亚热带常绿阔叶林经过人为因素的干扰,形成了次生植被及人工植被,代表着热带植被带和亚热带植被带,具有地带性森林植被特征。人工林以桉树(Eucalyptus robusta)、马尾松(Pinus massoniana)、杉木(Cunninghamia lanceolata)、木麻黄(Casuarina equisetifolia)、木荷(Schima superba)、竹林(Phyllostachys pubescens)等纯林为主。其次是人工栽培引进了一些其他经济植物。根据广东省28年(1990—2017年)森林火灾数据统计结果,全省共发生森林火灾6 275次,年均224.11次,火场总面积86 684.45 hm2,年均3 095.87 hm2。2017年4月4日,广东省佛冈县水头镇发生森林火灾,过火面积400 hm2,起火点经纬度为23°49′35″N、113°40′44″E,杉木林为火烧林型之一。
1.2 林火干扰强度划分
林火干扰强度的划分主要参考文献[19-20],结合历史森林火灾记录及在火烧迹地实际调查中可燃物实际消耗量的多少,以及树木的死亡率和树冠烧焦百分比,并结合乔木的烧焦高度,确定林火干扰强度分为3个等级(轻度、中度和重度)。重度林火干扰:火灾烧死木占70% ~ 100%,活立木(包括烧伤木)在30%以下,乔木熏黑高度 ≥ 5 m,林下灌木全部烧毁,凋落物烧光。中度林火干扰:火灾烧死木占30% ~ 70%,活立木(包括烧伤木)占30% ~ 70%,乔木熏黑高度在2 ~ 5 m,林下灌木几乎被烧毁(> 50%),凋落物几乎被烧毁(> 50%)。轻度林火干扰:火灾烧死木在30%以下,活立木(包括烧伤木)占70%以上,乔木熏黑高度 ≤ 2 m,林下灌木部分被烧毁(≤ 50%),凋落物部分被烧毁(≤ 50%)。
1.3 样地设置
根据广东省历史森林火灾时空间分布特点,结合广东省亚热带森林资源分布状况,选择广东省亚热带森林典型林型与森林火灾典型分布区域。按照2017年4月4日广东省佛冈县火烧迹地燃烧状况,火灾发生后1周内,按照1.2节林火干扰强度划分,选择不同林火干扰强度(同时分轻度、中度和重度3种林火干扰强度)样地,林火干扰样地基本情况见表1。分别在火烧迹地及相邻未火烧林分(对照样地),设置固定样地,于火后1年后(1个生长周期)进行外业调查及实验样品采集,调查采集植被生物量和凋落物生物量以及土壤样品。为了有效地获取广东省亚热带有代表性的典型人工成熟林林型的数据,选择杉木林(Cunninghamia lanceolata)典型林型进行采样,在未过火林地(未火烧样地即对照样地)和过火林地(划分为轻度、中度和重度)设置规格为20 m × 20 m的3个重复作为固定标准样地,共选设固定标准样地12块,即12块标准样地 = (3种林火干扰强度 + 1对照样地)× 3个重复。林火干扰样地基本情况见表1。
表 1 杉木林林火干扰样地基本情况Table 1. Basic situation of forest fire disturbance in sample plot of Cunninghamia lanceolata forest样地状况
Sample plot
condition林龄范围/a
Stand age
range/year平均胸径
Average DBH/cm平均树高
Average tree
height/m密度/
(株·hm− 2)
Stand
density/
(tree﹒ha− 1)郁闭度
Canopy
closure坡度
Slope degree/(°)坡位
Slope
position坡向
Slope
direction海拔
Altitude/
m土壤类型
Soil
type森林起源
Forest
origin对照样地 CK 27 ~ 29 18.27 ± 3.25 16.59 ± 4.23 1 426 ± 199 0.90 15 ~ 25 中坡 Middle slope 阳坡 Sunny slope 265 ~ 290 赤红壤 Lateritic red soil 人工林 Plantation 轻度林火干扰 L 27 ~ 29 18.27 ± 3.25 16.59 ± 4.23 1 426 ± 245 0.75 15 ~ 25 中坡 Middle slope 阳坡 Sunny slope 250 ~ 350 赤红壤 Lateritic red soil 人工林 Plantation 中度林火干扰 M 27 ~ 29 18.27 ± 3.25 16.59 ± 4.23 1 285 ± 127 0.55 15 ~ 25 中坡 Middle slope 阳坡 Sunny slope 250 ~ 350 赤红壤 Lateritic red soil 人工林 Plantation 重度林火干扰 H 27 ~ 29 18.27 ± 3.25 16.59 ± 4.23 939 ± 97 0.30 15 ~ 25 中坡 Middle slope 阳坡 Sunny slope 250 ~ 350 赤红壤 Lateritic red soil 人工林 Plantation 注:数据为平均值 ± 标准差。CK、L、M和H分别代表对照、轻度林火干扰、中度林火干扰和重度林火干扰。下同。Notes: data are mean ± SD. CK, L, M and H represent control check, light forest fire disturbance, moderate forest fire disturbance and high forest fire disturbance, respectively. The same below. 1.4 土壤样品的采集与处理
在标准样地内,沿“S”形选设3个土壤剖面(赤红壤),每个土壤剖面分为7个层次(0 ~ 10 cm、10 ~ 20 cm、20 ~ 30 cm、30 ~ 40 cm、40 ~ 60 cm、60 ~ 80 cm和80 ~ 100 cm)进行取样。土壤密度使用土壤环刀(100 cm3)法测定(105 ℃下烘干至恒质量)。在不同取样点分别取500 g土样带回实验室进行实验分析,用于分析测定土壤有机碳含量。火烧迹地每个固定标准样地取5个土样,3种林火干扰强度,7个土层共采样63个(每个标准样地3个采样点 × 3种林火干扰强度等级 × 7个土层)。对照样地共采集土壤样品21个(每个标准样地3个采样点 × 7个土层)。采用内径为10 cm的土钻,按细根直径 ≤ 2 mm根系分别采集0 ~ 10 cm、10 ~ 20 cm、20 ~ 30 cm和30 ~ 40 cm的土芯5个,分层混合装袋。通过流水漂洗和过筛等过程,挑选细根,风干后称质量,在85 ℃烘干并称质量。
1.5 指标测定及计算方法
1.5.1 土壤有机碳含量的测定
土壤有机碳含量的测定:土壤样品过100 目筛(0.15 mm),存放于玻璃瓶中。采用MultiN/C3100分析仪(Multi N/C3100, Analytik Jena AG, Jena, Germany)联用固体模块测定土壤有机碳含量。
1.5.2 土壤活性有机碳含量的测定
土壤微生物量碳(MBC)通过熏蒸提取−仪器法测定[21]。可溶性有机碳(DOC)采用高锰酸钾溶液氧化法测定[22]。土壤易氧化有机碳(EOC)采用日本岛津总有机碳分析仪测定,颗粒有机碳(POC)通过六偏磷酸钠提取法测定[23]。
1.5.3 单位面积碳密度的计算方法
单位面积某一土层中的有机碳密度计算公式为:
SOCd=n∑i=1Ti×θi×Ci×(1−δi)/10 (3) 式中:SOCd为土壤有机碳密度(t/hm2);i为土壤层数,n = 7;Ti为土壤剖面第i层的土层厚度(cm),即1 ~ 4层每层间隔为10 cm,5 ~ 7层每层间隔为20 cm;θi为土壤剖面第i层的土壤密度(g/cm3);Ci为土壤剖面第i层的有机碳含量(g/kg);δi为直径大于2 mm土壤剖面砾石百分比含量。
1.6 数据统计分析
数据统计分析采用Microsoft Excel 2003和SPSS 18.0软件处理。运用SPSS18.0软件进行单因素方差分析(One-way ANOVA),并采用LSD(the least-significant differenses)比较不同林火干扰强度样地与对照样地之间土壤碳密度的差异。用Origin9.1绘制图表。
2. 结果与分析
2.1 林火干扰对土壤有机碳密度的影响
2.1.1 土壤密度
从图1可知,杉木林在不同林火干扰后土壤密度与对照样地相比存在不同程度的差异。在不同林火干扰强度作用下,同一土层的土壤密度与对照样地相比整体呈上升趋势,其中土壤表层(0 ~ 20 cm)土壤密度变化幅度最大,土壤浅层(20 ~ 40 cm)土壤密度变化幅度次之,而土壤深层(40 ~ 100 cm)土壤密度变化幅度最小。各土层均表现为林火干扰后土壤密度大于对照样地,且随着林火干扰强度的增加而增大,即重度林火干扰 > 中度林火干扰 > 轻度林火干扰 > 对照。
![]() 图 1 林火干扰对杉木林土壤密度的影响不同小写字母表示相同土层不同林火干扰与对照样地之间差异显著(P < 0.05)。下同。Different lowercase letters indicate significant difference between different forest fire disturbance and control check plots in the same soil layer at P < 0.05 level. The same below.Figure 1. Effects of forest fire disturbance on soil bulk density of Cunninghamia lanceolata forest
图 1 林火干扰对杉木林土壤密度的影响不同小写字母表示相同土层不同林火干扰与对照样地之间差异显著(P < 0.05)。下同。Different lowercase letters indicate significant difference between different forest fire disturbance and control check plots in the same soil layer at P < 0.05 level. The same below.Figure 1. Effects of forest fire disturbance on soil bulk density of Cunninghamia lanceolata forest杉木林各土层(0 ~ 100 cm)土壤密度均呈现出随着林火强度增强,土壤密度增加的趋势。对照样地、轻度林火干扰、中度林火干扰和重度林火干扰样地土壤上表层(0 ~ 40 cm)的土壤密度分别为0.99 ~ 1.17 g/cm3、1.03 ~ 1.19 g/cm3、1.16 ~ 1.33 g/cm3和1.19 ~ 1.35 g/cm3,与对照样地相比,轻度林火干扰、中度林火干扰和重度林火干扰样地相应土层分别提高了4.04% ~ 10.89%、13.45% ~ 20.54%和13.53% ~ 19.36%。各林火干扰样地与对照相比仅中度和重度火干扰均存在显著差异(P < 0.05),而轻度林火干扰均不存在显著差异(P > 0.05)。对照样地、轻度林火干扰、中度林火干扰和重度林火干扰样地土壤深层(40 ~ 100 cm)的土壤密度分别为1.19 ~ 1.24 g/cm3、1.20 ~ 1.24 g/cm3、1.34 ~ 1.35 g/cm3和1.36 ~ 1.37 g/cm3,与对照样地相比,轻度林火干扰、中度林火干扰和重度林火干扰样地相应土层分别提高了0 ~ 0.84%、8.87% ~ 12.50%和9.63% ~ 12.69%。
2.1.2 土壤有机碳含量
林火干扰后,土壤有机碳含量均低于对照,同一土层随着林火干扰强度的增加而呈下降趋势,且随土壤剖面深度增加而逐渐减小(见图2)。相比对照,不同林火干扰对各土层(0 ~ 100 cm)土壤有机碳含量的影响差异均不显著(P > 0.05),但轻度林火干扰对土壤表层(0 ~ 20 cm)土壤有机碳密度的影响显著(P < 0.05),而中度和重度林火干扰对杉木林土壤表层和土壤浅层(20 ~ 40 cm)土壤有机碳含量的影响差异显著(P < 0.05)。杉木林土壤土层(40 ~ 60 cm)在中度和重度林火干扰下,土壤有机碳含量均表现为减少趋势(P < 0.05)。
![]() 图 2 林火干扰对土壤有机碳含量的影响Figure 2. Effects of forest fire disturbance on soil organic carbon content
图 2 林火干扰对土壤有机碳含量的影响Figure 2. Effects of forest fire disturbance on soil organic carbon content2.1.3 土壤有机碳密度
对比不同强度林火干扰样地土壤有机碳密度差异结果表明,林火干扰减少了杉木林土壤有机碳密度,各林火干扰强度样地土壤有机碳密度均低于对照,且减少幅度随土壤剖面深度增加而逐渐变小(图3)。相比对照,杉木林在轻度林火干扰、中度林火干扰和重度林火干扰后,土壤土层(0 ~ 100 cm)土壤有机碳密度分别为136.89、124.64和111.10 t/hm2,依次下降了8.85%、17.02%和26.03%。轻度林火干扰对土壤有机碳密度的影响不显著(P > 0.05),而中度和重度林火干扰显著降低土壤有机碳密度(P < 0.05)。土壤最表层(0 ~ 10 cm)土壤有机碳密度分别下降15.35%、31.95%和49.12%,土壤亚表层(10 ~ 20 cm)土壤有机碳密度分别下降17.02%、26.53%和34.84%,3种林火干扰强度后土壤表层(0 ~ 20 cm)有机碳密度均呈显著降低(P < 0.05)。土壤浅层(20 ~ 40 cm)土壤有机碳密度分别下降9.42%、20.44%和28.35%,仅中度和重度林火干扰显著降低土壤浅层土壤有机碳密度(P < 0.05)。土壤深层(40 ~ 100 cm)土壤有机碳密度分别下降1.86%、2.81%和8.62%,3种林火干扰对土壤深层土壤有机碳密度影响不显著(P > 0.05)。从以上分析可知,轻度林火干扰仅显著降低了土壤表层土壤有机碳密度,尚未引起土层(0 ~ 100 cm)土壤有机碳密度的显著变化,而中度和重度林火干扰显著降低了土壤表层和浅层土壤有机碳密度,进而导致土层(0 ~ 100 cm)土壤有机碳密度的显著变化。研究表明,中度和重度林火干扰强度对土壤有机碳密度的减少主要集中在土壤表层(0 ~ 20 cm)和土壤浅层(20 ~ 40 cm),即中度和重度林火干扰强度显著降低了表层和浅层土壤有机碳密度(P < 0.05)。同时,在林火干扰样地的各土层中,土壤有机碳密度的减少幅度随土层剖面深度的增加而降低,即随剖面深度增加而逐渐变小。
![]() 图 3 林火干扰对杉木林土壤有机碳密度的影响Figure 3. Effects of forest fire disturbance on soil organic carbon density of Cunninghamia lanceolata forest
图 3 林火干扰对杉木林土壤有机碳密度的影响Figure 3. Effects of forest fire disturbance on soil organic carbon density of Cunninghamia lanceolata forest2.2 林火干扰对土壤活性有机碳含量的影响
从图4 ~ 7可看出,不同林火干扰强度后土壤活性有机碳含量总体呈下降趋势。相比对照,林火干扰后杉木林4种土壤活性有机碳含量均呈下降趋势。活性有机碳含量各组分随林火干扰强度增加沿土壤剖面递减的幅度呈现一定的差异性,重度林火干扰后的递减趋势最强,土壤表层活性有机碳的下降趋势较明显,土壤浅层活性有机碳次之,土壤深层活性有机碳下降趋势较为平缓。不同深度土壤剖面活性有机碳在轻度、中度和重度林火干扰强度的差异表现为土壤表层(0 ~ 20 cm)MBC分别下降了24.58%、50.38%和68.35%,DOC分别下降了24.92%、45.97%和76.06%,EOC分别下降了23.71%、53.16%和66.71%,POC分别下降了22.53%、52.84%和66.94%,表现为差异显著(P < 0.05)。土壤浅层(20 ~ 40 cm)MBC分别下降了12.02%、44.84%和58.72%,DOC分别下降了9.08%、50.80%和73.45%,EOC分别下降了5.02%、35.65%和50.82%,POC分别下降了9.77%、44.96%和59.90%,仅中度林火干扰和重度林火干扰表现为差异显著(P < 0.05)。土壤深层(40 ~ 100 cm)MBC分别下降了5.74%、24.39%和36.69%,DOC分别下降了7.52%、30.10%和55.20%,EOC分别下降了2.12%、19.42%和29.66%,POC分别下降了3.11%、23.19%和36.41%,亦仅中度林火干扰和重度林火干扰表现为差异显著(P < 0.05)。由此可见,杉木林在林火干扰后土壤表层(0 ~ 20 cm)活性有机碳含量显著减少,而土壤浅层(20 ~ 40 cm)和土壤深层(40 ~ 100 cm)活性有机碳含量在中度林火干扰和重度林火干扰后显著减少,而轻度林火干扰对土层(20 ~ 100 cm)活性有机碳含量影响不显著(P > 0.05)。
![]() 图 4 林火干扰对杉木林土壤微生物生物量碳含量的影响图中的A、B、C、D、E、F、G和Z 分别代表土层0 ~ 10 cm、10 ~ 20 cm、20 ~ 30 cm、30 ~ 40 cm、40 ~ 60 cm、60 ~ 80 cm、80 ~ 100 cm、0 ~ 100 cm。下同。A, B, C, D, E, F, G and Z in the figure represent soil layers of 0−10 cm, 10−20 cm, 20−30 cm, 30−40 cm, 40−60 cm, 60−80 cm, 80−100 cm and 0−100 cm, respectively . The same below.Figure 4. Effects of forest fire disturbance on soil microbial biomass carbon content of Cunninghamia lanceolata forest
图 4 林火干扰对杉木林土壤微生物生物量碳含量的影响图中的A、B、C、D、E、F、G和Z 分别代表土层0 ~ 10 cm、10 ~ 20 cm、20 ~ 30 cm、30 ~ 40 cm、40 ~ 60 cm、60 ~ 80 cm、80 ~ 100 cm、0 ~ 100 cm。下同。A, B, C, D, E, F, G and Z in the figure represent soil layers of 0−10 cm, 10−20 cm, 20−30 cm, 30−40 cm, 40−60 cm, 60−80 cm, 80−100 cm and 0−100 cm, respectively . The same below.Figure 4. Effects of forest fire disturbance on soil microbial biomass carbon content of Cunninghamia lanceolata forest![]() 图 5 林火干扰对杉木林土壤可溶性有机碳含量的影响Figure 5. Effects of forest fire disturbance on soil dissolved organic carbon content of Cunninghamia lanceolata forest
图 5 林火干扰对杉木林土壤可溶性有机碳含量的影响Figure 5. Effects of forest fire disturbance on soil dissolved organic carbon content of Cunninghamia lanceolata forest![]() 图 6 林火干扰对杉木林土壤易氧化碳含量的影响Figure 6. Effects of forest fire disturbance on soil easily oxidized carbon content of Cunninghamia lanceolata forest
图 6 林火干扰对杉木林土壤易氧化碳含量的影响Figure 6. Effects of forest fire disturbance on soil easily oxidized carbon content of Cunninghamia lanceolata forest![]() 图 7 林火干扰对杉木林土壤颗粒有机碳含量的影响Figure 7. Effects of forest fire disturbance on soil particulate organic carbon content of Cunninghamia lanceolata forest
图 7 林火干扰对杉木林土壤颗粒有机碳含量的影响Figure 7. Effects of forest fire disturbance on soil particulate organic carbon content of Cunninghamia lanceolata forest2.3 林火干扰对土壤细根生物量的影响
林火干扰后杉木林土壤细根生物量均低于对照样地(表2),变化趋势为重度林火干扰 > 中度林火干扰 > 轻度林火干扰,轻度林火干扰只显著降低了土壤表层细根生物量(P < 0.05),而中度和重度林火干扰显著降低了土壤表层和浅层细根生物量(P < 0.05)。杉木林在林火干扰后,随着林火干扰强度的增加,土壤细根生物量均呈现出减小的趋势。土壤最表层(0 ~ 10 cm)细根生物量在不同林火干扰强度显著降低(P < 0.05),依次下降21.47%、29.17%和43.91%;土壤亚表层(10 ~ 20 cm)土壤细根生物量显著降低(P < 0.05),依次下降20.62%、34.63%和51.36%;土壤浅层(20 ~ 40 cm)土壤细根生物量依次下降15.28%、40.63%和50.00%,仅重度林火干扰和中度林火干扰显著降低(P < 0.05)。土壤表层(0 ~ 20 cm)细根生物量的减少速度均大于土壤浅层(20 ~ 40 cm)细根生物量,减少幅度与变化趋势一致。
表 2 林火干扰对杉木林土壤细根生物量的影响 t/hm2Table 2. Effects of forest fire disturbance on soil fine root biomass of Cunninghamia lanceolate forestst/ha 土层 Soil layer/cm 对照 CK 轻度林火干扰 L 中度林火干扰 M 重度林火干扰 H 0 ~ 10 3.22 ± 0.34a 2.45 ± 0.45b 2.19 ± 0.37b 1.75 ± 0.45b 10 ~ 20 2.69 ± 0.29a 2.04 ± 0.38b 1.68 ± 0.47bc 1.25 ± 0.25c 20 ~ 30 2.01 ± 0.36a 1.77 ± 0.37a 1.09 ± 0.41b 0.87 ± 0.36b 30 ~ 40 0.97 ± 0.25a 0.75 ± 0.14a 0.61 ± 0.12b 0.57 ± 0.21b 注:数据为平均值 ± 标准差。不同小写字母表示不同林火干扰强度与对照样地之间差异显著(P < 0.05)。下同。Notes: data are mean ± SD. Different small letters indicate significant difference between different forest fire disturbance intensities and control check plots at P < 0.05 level. The same below. 2.4 土壤活性有机碳与土壤有机碳、细根生物量的关系
土壤活性有机碳与土壤有机碳、细根生物量的相关分析表明,土壤有机碳与MBC、DOC含量间呈极显著正相关(P < 0.01),与EOC、POC呈显著正相关(P < 0.05)。细根生物量与MBC、DOC、POC含量呈显著正相关,与EOC含量呈不显著相关(表3)。
表 3 杉木林土壤活性有机碳含量与土壤有机碳、细根生物量的相关系数Table 3. Pearson correlation coefficients between LOC and SOC, fine root biomass of Cunninghamia lanceolata forest土壤活性有机碳
Soil activated organic
carbon (LOC)土壤有机碳
Soil organic carbon (SOC)细根生物量
Fine root biomass土壤微生物量碳 MBC 0.991** 0.983* 可溶性有机碳 DOC 0.995** 0.982* 易氧化碳 EOC 0.966* 0.949 颗粒有机碳 POC 0.983* 0.976* 注:* 和** 分别指在 P < 0.05 和 P < 0.01 水平上相关性显著。Notes:* and ** represent significant correlations at P < 0.05 and P < 0.01 level, respectively. 3. 讨 论
3.1 林火干扰对土壤有机碳密度影响
林火干扰对土壤有机碳密度变化产生重要影响。森林地表凋落物层是土壤碳输入的主要来源,林火干扰通过烧除地表凋落物从而减少土壤有机物的输入,而较少的森林地层隔热可能导致土壤有机碳循环增加,使得林火干扰后土壤有机碳密度减少[24-25],这与本研究结果一致。一些研究认为林火干扰对土壤有机碳密度影响差异不显著[26],且通过适应林火干扰的生态系统中使初级生产力提高,使得减少初始碳损失,使林火干扰后土壤有机碳密度增加[7,27]。虽然林火干扰通过燃烧立即释放出储存的碳素,但由于一些植物生物量燃烧后分解产物的输入增加,造成碳的延迟流失,从而使森林土壤有机碳库从碳汇转变为碳源,直到森林植物恢复过程中碳的积累抵消了损失,而这也是出现不同影响的原因,可能与林火干扰季节、强度、持续时间,以及林型、立地条件的差异密切相关[28]。
本研究发现各林火干扰强度样地土壤有机碳密度均低于对照,且减少幅度随土壤剖面深度增加而逐渐变小。崔晓阳等[29]研究发现轻、中度火烧2年对大兴安岭兴安落叶松(Larix gmelinii)林土壤有机碳含量有显著的小幅递增,而重度火烧则表现为显著减少,这与本研究结果一致。这可能是由于燃烧时的高温产生的挥发效应以及增加土壤温度,改变土壤的团聚体结构和松紧度,将增加土壤微生物活性的趋势,同时在发生重度林火干扰后,降雨之后也可能增加土壤微生物活动的趋势,体现了土壤矿物质的有机质数量和组成对林火干扰的响应。本研究中轻度林火干扰仅显著降低了杉木林土壤表层(0 ~ 20 cm)土壤有机碳密度,而中度和重度林火干扰显著降低了土壤表层和浅层(20 ~ 40 cm)土壤有机碳密度(P < 0.05),在不同林火干扰强度下对土壤深层(60 ~ 100 cm)土壤有机碳含量的影响均不显著(P > 0.05)。这与Grosse等[30]研究结果一致。在林火干扰过程中,由于土壤是热的不良导体,因此释放的热量通常随着土壤深度的增加而迅速降低。
3.2 林火干扰对土壤活性有机碳含量的影响
林火干扰对土壤活性有机碳含量均产生了影响。相比对照,林火干扰后杉木林4种土壤活性有机碳含量均呈下降趋势,土层(0 ~ 100 cm)仅中度和重度林火干扰差异显著(P < 0.05)。活性有机碳含量各组分随林火干扰强度增加沿土壤剖面递减的幅度呈现一定的差异性,重度林火干扰后的递减趋势最强,土壤表层(0 ~ 20 cm)活性有机碳的下降趋势较明显,土壤浅层(20 ~ 40 cm)活性有机碳次之,土壤深层(40 ~ 100 cm)活性有机碳下降趋势较为平缓。这与李红运等[31]、孔健健等[32]和Prieto-Fernández等[33]研究结果较为一致。这可能是因为在燃烧过程中火场温度的梯度变化,增温效应随着土壤深度的增加而减少。另有研究表明,在湿润土壤条件下,火灾发生时通过蒸腾作用减少水分进而影响土壤的热特性,致使矿质土壤5 cm土层的温度很少超过150 ℃,土层20 cm以下的温度变化较小,进而对土壤微生物活性产生的影响亦较小[34]。还有一些研究认为火干扰后土壤活性有机碳呈显著增加[35],这可能是因为低强度的林火干扰增加土壤活性有机物的数量,增强了土壤活性有机碳在养分循环中的效应,在重新塑造生态系统功能和结构中发挥关键作用。同时王海淇等[36]研究发现林火干扰造成土壤微生物量碳显著减少,且土壤微生物量碳的动态变化与林火干扰强度密切相关,与本文研究结果相同。造成这种结果的原因是地表凋落物(包括腐殖质)在森林火灾时的高温杀死了土壤微生物,且不同林火干扰强度对土壤微生物的数量影响不同。
3.3 林火干扰对土壤细根生物量的影响
林火干扰对杉木林土壤细根生物量均产生了影响,不同林火干扰强度后土壤表层(0 ~ 20 cm)土壤细根生物量低于对照样地,且差异显著(P < 0.05)。土壤浅层(20 ~ 40 cm)土壤细根生物量亦低于对照样地,但仅中度和重度林火干扰样地低于对照样地,总体的变化趋势表现为重度林火干扰 > 中度林火干扰 > 轻度林火干扰。这些结果与先前的研究结果一致,不同林火干扰强度显著减少了细根生物量[37]。林火干扰导致土壤环境和根系物候之间发生了变化,首先燃烧通过增加土壤水分蒸发减少水分的供应,从而限制了根系对水分可用性的敏感性[38],其次燃烧导致表层土壤温度升高,从而导致土壤变暖,进而刺激了土壤新的根系生长,尤其在土壤温度不是最适合其生长时。同时有研究表明,地上和地下生物量的变化可能是由于林火干扰中细菌和菌根的直接死亡,以及由此带来的地下碳素重新分配格局的变化[37,39]。
3.4 林火干扰对土壤有机碳密度的影响机制
土壤细根是土壤有机碳累积的主要贡献者,轻度林火干扰显著减少了土壤表层(0 ~ 20 cm)细根生物量,进而显著减少了土壤表层(0 ~ 20 cm)土壤有机碳含量,但对土层(20 ~ 100 cm)土壤有机碳含量影响差异不显著,对土层(0 ~ 100 cm)土壤密度的影响差异不显著,因而轻度林火干扰对土壤有机碳密度的影响差异不显著。而中度和重度林火干扰既显著降低了土壤表层(0 ~ 20 cm)细根生物量又显著降低了土壤浅层(20 ~ 40 cm)细根生物量,进而减少土壤表层(0 ~ 20 cm)和土壤浅层(20 ~ 40 cm)土壤有机碳含量。同时,随着土壤剖面深度增加,林火干扰对土壤有机碳密度的影响减弱。
4. 结 论
林火干扰减少了杉木林土壤有机碳密度,不同林火干扰强度样地土壤有机碳密度均低于对照,且减少幅度随土壤剖面深度增加而逐渐变小。轻度林火干扰仅显著降低了土壤表层(0 ~ 20 cm)土壤有机碳密度,尚未引起土层(0 ~ 100 cm)土壤有机碳密度的显著变化,因而对土壤有机碳密度的影响不显著(P > 0.05)。而中度和重度林火干扰显著降低了土壤表层和浅层(20 ~ 40 cm)土壤有机碳密度,进而导致土层(0 ~ 100 cm)土壤有机碳密度的显著变化,因而对土壤有机碳密度的影响显著(P < 0.05)。杉木林的轻度、中度和重度林火干扰样地土壤有机碳密度分别为136.89、124.64和111.10 t/hm2,相比对照,依次下降了8.85%、17.02%和26.03%。
不同林火干扰强度后土壤活性有机碳含量总体呈下降趋势。相比对照,林火干扰后杉木林4种土壤活性有机碳含量均呈下降趋势。活性有机碳含量各组分随林火干扰强度增加沿土壤剖面递减的幅度呈现一定的差异性,重度林火干扰后的递减趋势最强,土壤表层活性有机碳的下降趋势较明显,土壤浅层活性有机碳次之,土壤深层活性有机碳下降趋势较为平缓。林火干扰后各林型土壤细根生物量均低于对照样地,变化趋势为重度林火干扰 > 中度林火干扰 > 轻度林火干扰。轻度林火干扰对土壤表层细根生物量的影响差异显著(P < 0.05),而中度和重度林火干扰显著降低了土壤表层和浅层细根生物量(P < 0.05)。通过分析林火干扰后土壤碳密度的分布格局及影响机制,可为林火干扰后生态系统碳汇管理以及定量评价林火干扰对森林生态系统碳库的影响提供参考依据,对林火干扰后碳汇效应研究提供科学支撑。
-
![]()
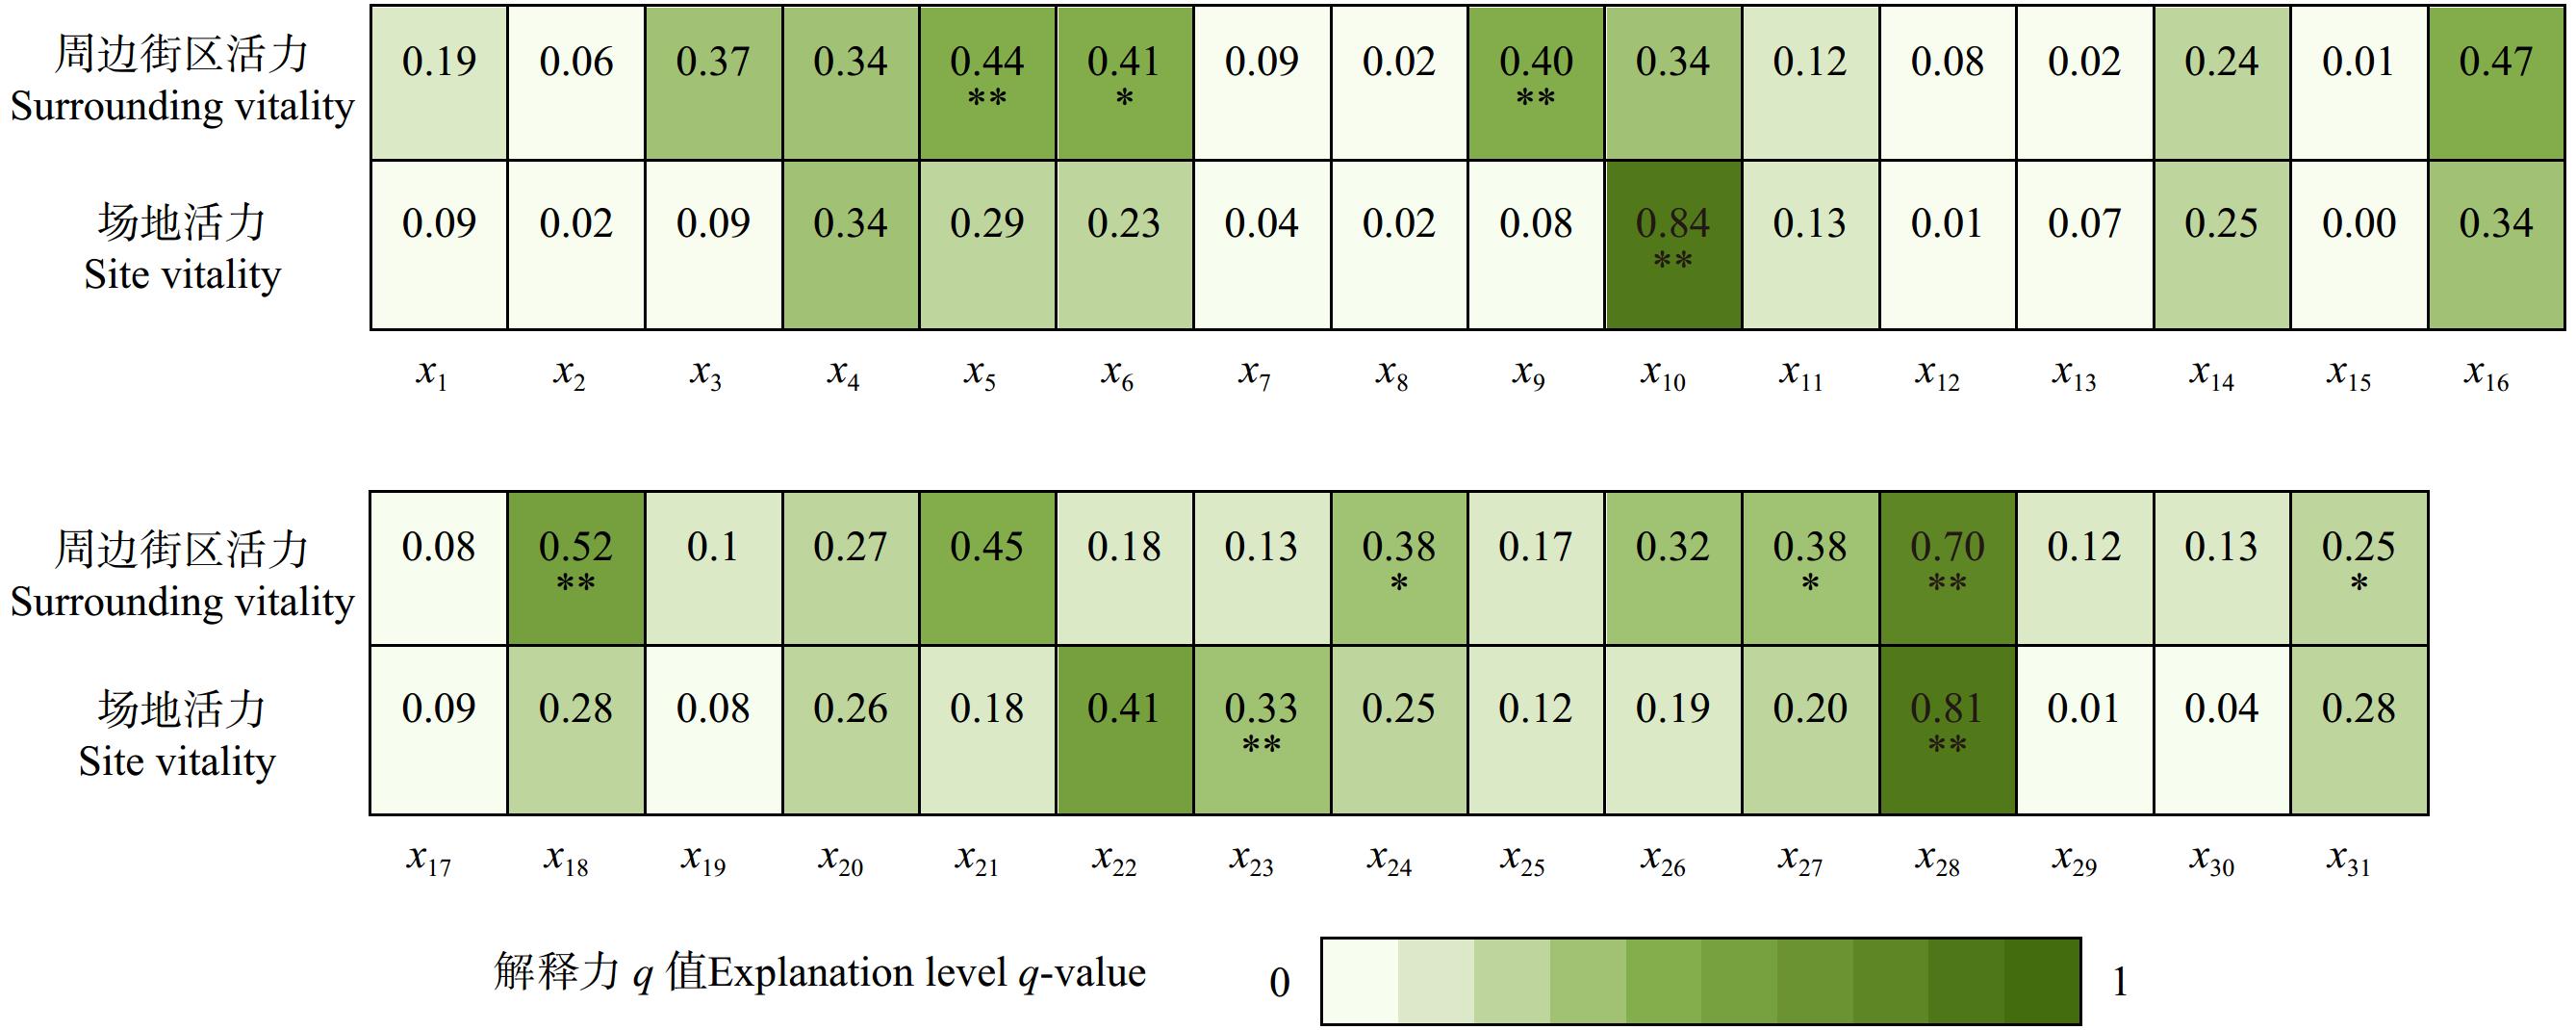
图 4 活力对指标层分异及因子探测结果
*为相关比较显著(0.05 ≤ P < 0.1);**为相关显著(P < 0.05)。下同。* defined as a relatively significant correlation at 0.05 ≤ P < 0.1 level; ** defined as a significant correlation at P < 0.05 level. The same below.
Figure 4. Results for vitality factor detection at the indicator level
![]()
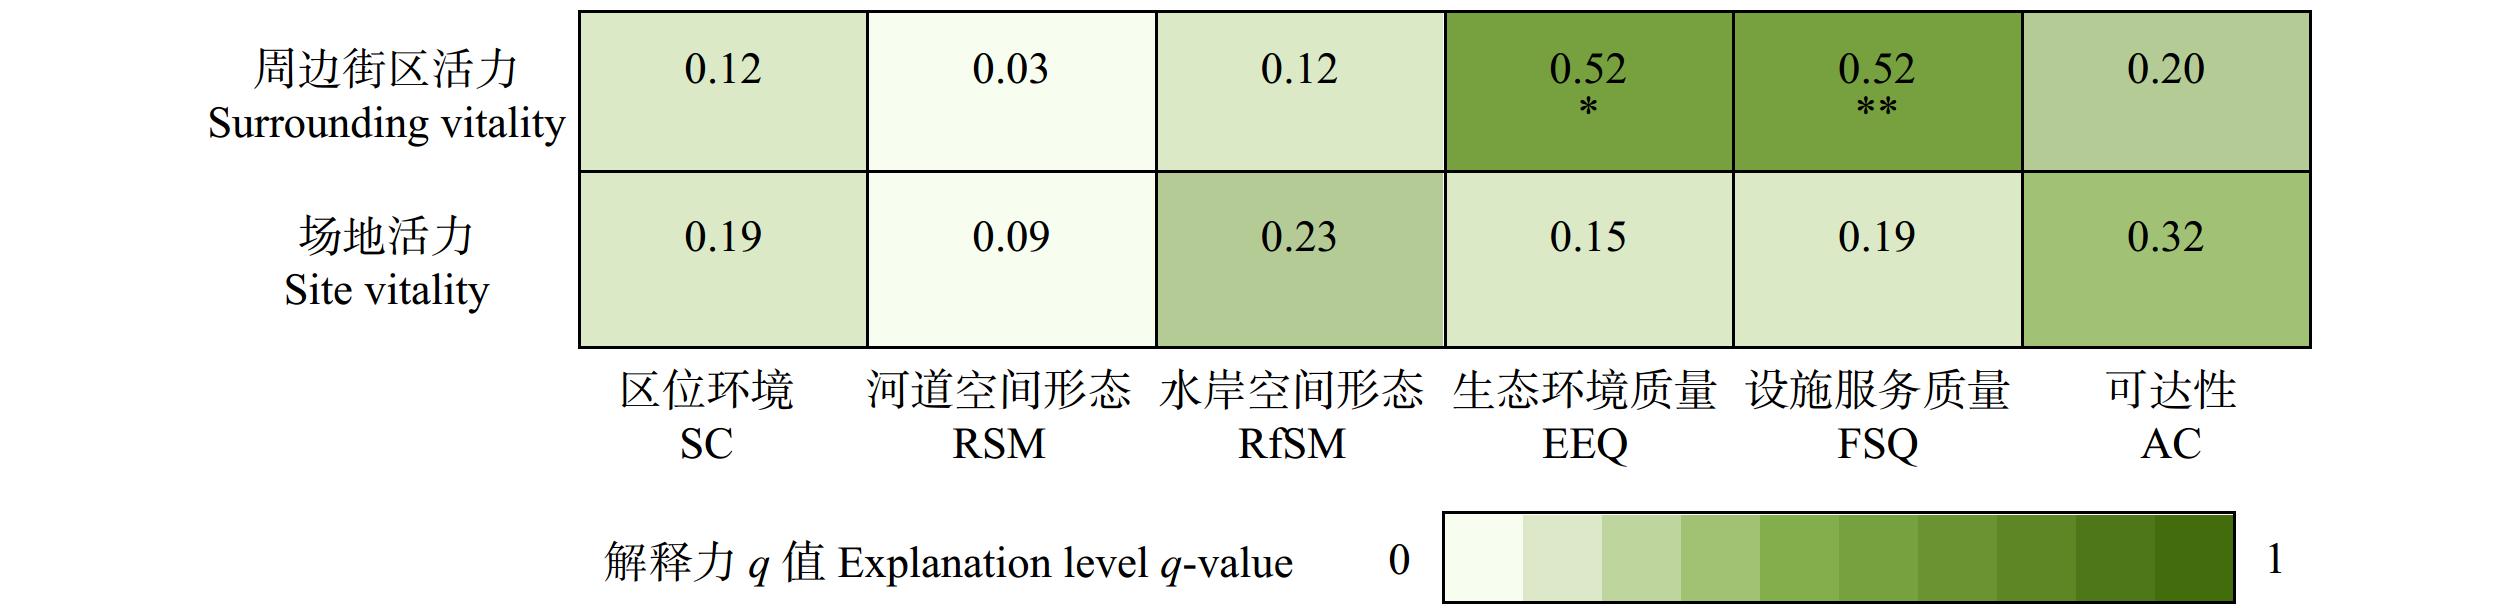
图 5 活力对准则层分异及因子探测结果
Figure 5. Results for vitality factor detection at the criteria level
表 2 城市滨河绿地评价体系
Table 2 Evaluation system for urban riverfront green space
目标层 Goal layer 准则层 Criterion layer 指标层 Index layer 说明 Description 城市滨河绿地建成环境评价 Assessment for urban riverfront green space 河道空间形态 River spatial morphology (RSM) 开口比 Opening ratio (x1) 河道两侧堤岸顶外缘之间平均距离与平均河面宽度比值 Ratio of the average distance between the top outer edge of the embankment on both sides of the river to the average river surface width 水面距堤顶高度 Height of water surface from the top of dike (x2) 河道常水位至堤岸顶的平均高度 Average height of the river’s normal water level to the top of the embankment 河面宽度 River width (x3) 河道平均河面宽度 Average river surface width 水岸空间形态 Riverfront spatial morphology (RfSM) 河阔比 River width ratio (x4) 平均水岸宽度与河面宽度比值Ratio of average water bank width to river surface width 水岸宽度 Waterbank width (x5) 堤岸顶外缘至远水侧边界的平均宽度 Average width from the top outer edge of the embankment to the far water side boundary 本侧建筑围合宽高比 Building envelope width-to-height ratio (x6) 首排建筑临水外墙至堤岸顶外缘的平均距离与建筑临水面平均高度的比值The ratio of the average distance from the first row of building waterfront facade to the top outer edge of the embankment to the average height of the building waterfront 对岸天际线韵律 Rhythm of the skyline across the river (x7) 对岸首排建筑高度的相对平均偏差 The relative average deviation of the height of the first row of buildings on the opposite bank 生态环境质量 Ecological environment quality (EEQ) 水体清洁度 Water cleanliness (x8) 河道水体浑浊、发臭且漂浮大量杂物取值1,水体无味但浑浊且漂浮杂物取值2,水体清澈、无味但漂浮杂物取值3,清澈、无味但少量漂浮柳絮、树枝等自然物取值4,清澈、无味且无漂浮物取值5 River water turbid, smelly and floating a lot of debris to take the value of 1, the water is odorless but turbid and floating debris to take the value of 2, clear water, odorless but floating debris to take the value of 3, clear, odorless but a small amount of floating willow, branches and other natural objects to take the value of 4, clear, odorless and no floating objects to take the value of 5 驳岸状况 Embankment condition (x9) 人工垂直驳岸取值为1,人工斜驳岸取值2,自然斜草坡取值3,灌草斜自然驳岸取值4,乔灌草复层斜自然驳岸取值5 The value of artificial vertical barge is 1, artificial inclined barge is 2, natural inclined grass slope is 3, irrigation grass inclined natural barge is 4, and tree and irrigation grass compound inclined natural barge is 5 绿地形状指数 Green space shape index (x10) 绿地以正方形为参照物的形态指数,即四分之一的绿地周长与绿地面积开方的比值The morphological index of a green space with a square as a reference, i.e. the ratio of the perimeter of a quarter of the green space to the open square of the green space 绿化覆盖率 Greenery coverage (x11) 绿地覆盖区域总面积与单元面积比值 Ratio of total area covered by green space to unit area 郁闭度 Canopy density (x12) 群植乔木树冠垂直投影面积与栽植地表面积的比值 The ratio of vertical projection area of canopy of the group planted trees to the area of the planted ground 植被丰富度 Vegetation richness (x13) 单元内5个典型植物群落平均物种数 The average number of species of the five typical plant communities within the unit 设施服务质量 Facility service quality (FSQ) 慢行道密度 Slow lane density (x14) 步行道、跑步道、骑行道总长度与单元面积比值 Total length to unit area ratio of walking, running and cycling paths 滨水连续性 Waterfront continuity (x15) 沿岸连续通行长度与沿岸长度比值 The ratio of the length of continuous passage along the shore to the length of the shore 休憩设施密度 Leisure facility density (x16) 单位面积驿站、公共厕所、座椅等休憩设施的数量 The number of resting facilities such as staging areas, public toilets and seats per unit area 活动场地配置率 Activity site allocation rate (x17) 活动场地面积与单元面积的比值 Ratio of activity space area to unit area 文化设施密度 Cultural facility density (x18) 古树名木、文物、科普设施、艺术装置、宣传栏等文化设施等数量 Number of cultural facilities such as old and valuable trees, cultural relics, science facilities, art installations, bulletin boards, etc. 亲水驳岸率 Hydrophilic revetment ratio (x19) 与水面距离小于1 m的可进入低临水驳岸长度与沿岸长度的比值 The ratio of the length of the low waterfront barge to the length of the littoral can be accessed at a distance of less than 1 m from the water surface 达水通道密度 Water channel density (x20) 垂直于河道的慢行通道条数与沿岸长度之比 The ratio of the number of slow walking paths perpendicular to the river to the length of the shoreline 内部平行河道的最高城市道路等级 The highest urban road grade of internal parallel rivers (x21) 城市快速路或城市主干道取值1,城市次干道取值2,城市支路取值3,其他可通车道路取值4,慢行道路或无道路阻隔取值5 Urban expressway or urban trunk road takes the value of 1, urban secondary road takes the value of 2, urban branch road takes the value of 3, other passable road takes the value of 4, slow road or no road obstruction takes the value of 5 可达性 Accessibility (AC) 公共交通接驳率 Public transport connection rate (x22) 500 m范围内公共交通站点与交通服务设施数量与单元面积的比值 The ratio of the number of public transportation stops and transportation service facilities to the area of the unit within 500 m 外侧车行道路等级 Grade of outside road (x23) 城市快速路或主干道取值1,次干道取值2,支路取值3,其他可通车道路取值4,慢行道或无道路阻隔取值5 Urban expressway or main road takes the value of 1, secondary road takes the value of 2, branch road takes the value of 3, other passable road takes the value of 4, slow road or no road obstruction takes the value of 5 边界开口率 Boundary opening rate (x24) 绿地入口数量与沿岸长度的比值 Ratio of the number of green space entrances to the length of the shoreline 侧方连接度 Side connection (x25) 两侧垂直于河道道路等级取值之和,单条道路为城市快速路或城市主干道取值1,城市次干道取值2,城市支路取值3,其他可通车道路取值4,慢行道路或无道路阻隔取值5 The sum of the two sides perpendicular to the river road grade, a single road for urban expressway or urban trunk road to take the value of 1, urban secondary roads to take the value of 2, urban feeder roads to take the value of 3, other passable roads to take the value of 4, slow roads or no road blocking to take the value of 5 滨水间口率 Waterfront Architecture opening rate (x26) 首排建筑临水总面宽与滨水岸线总长度的比值 The ratio of the total waterfront width of the first row of buildings to the total length of the waterfront shoreline 区位环境 Surrounding environment (SE) 区位中心度 Location centrality (x27) 研究单元空间质心至行政中心(天安门)的直线距离的倒数 The inverse of the linear distance from the spatial center of mass of the study unit to the administrative center (Tiananmen) 周边街区建筑密度 Building density of surrounding neighbourhoods (x28) 建筑占地面积与街区总面积的比值 The ratio of the building footprint to the total area of the block 周边街区地积比 Area ratio of surrounding neighbourhoods (x29) 建筑总面积与建筑占地面积的比值 The ratio of the total building area to the building footprint 周边街区POI密度 POI density of surrounding neighbourhoods (x30) 周边街区内POI数总和与街区总面积的比值 The ratio of the sum of the number of POIs in the surrounding neighborhood to the total area of the neighborhood 周边街区POI混合度 POI mix degree of surrounding neighbourhoods (x31) 基于信息熵计算周边街区内POI多样性 Calculation of POI diversity within surrounding neighborhoods based on information entropy  下载: 导出CSV
表 1 交互作用的类型
Table 1 Types of interaction
判断依据 Judgment basis 交互作用 Interaction q(X1∩X2)<Min(q(X1),q(X2)) 非线性减弱 Weaken, nonlinear Min(q(X1),q(X2))<q(X1∩X2)<Max(q(X1)),q(X2)) 单因子非线性减弱 Weaken, uni- q(X1∩X2)>Max(q(X1),q(X2)) 双因子增强 Enhance, bi- q(X1∩X2)=q(X1)+q(X2) 独立 Independent q(X1∩X2)>q(X1)+q(X2) 非线性增强 Enhance, nonlinear 注:引自参考文献[44]。 “X1” 和“X2” 代表滨河绿地评价准则层维度。Notes: cited from reference [44]. “X1” and “X2” represent the dimension of criteria level in the riverfront green space assessment.
下载: 导出CSV
表 3 城市滨河绿地综合评价结果
Table 3 Assessment results of urban riverfront green space
研究对象
Research object研究单元
Research unit正理想解距离D+i
Positive ideal
solution (D+i)负理想解距离D−i
Negative ideal
solution (D−i)总评价值
Total evaluation
value (C)排序结果
Result ranking京密引水渠长河闸以北昆玉段
Kunyu section of the Jingmi Diversion
Channel (north of Changhezha Gate) (KYD-N)1 0.757 0.430 0.362 21 2 0.688 0.454 0.398 15 3 0.737 0.450 0.379 18 京密引水渠长河闸以南昆玉段
Kunyu section of the Jingmi Diversion
Channel (north of Changhezha Gate) (KYD-S)4 0.775 0.408 0.345 23 5 0.769 0.410 0.348 22 6 0.740 0.445 0.375 19 7 0.706 0.517 0.422 12 南长河 Nanchanghe River (NCH) 8 0.639 0.514 0.446 9 9 0.671 0.547 0.449 8 10 0.628 0.518 0.452 7 11 0.580 0.522 0.474 4 12 0.598 0.539 0.474 3 13 0.578 0.555 0.490 2 永定河引水渠
Yongdinghe River Diversion Channel (YDH)14 0.637 0.511 0.445 10 15 0.657 0.485 0.425 11 16 0.747 0.387 0.341 24 17 0.745 0.456 0.380 17 土城沟 Tuchenggou River (TCG) 18 0.685 0.492 0.418 13 19 0.694 0.456 0.396 16 20 0.630 0.560 0.471 5 21 0.503 0.739 0.595 1 22 0.679 0.588 0.464 6 小月河 Xiaoyuehe River (XYH) 23 0.748 0.527 0.413 14 24 0.783 0.455 0.368 20 25 0.764 0.386 0.336 25 26 0.794 0.362 0.313 27 27 0.794 0.381 0.324 26
下载: 导出CSV
表 4 场地活力对准则层交互探测结果
Table 4 Results for site vitality interaction detection at the criteria level
项目 Item 河道空间形态 RSM 水岸空间形态 RfSM 生态环境质量 EEQ 设施服务质量 FSQ 可达性 AC 区位环境 SE 河道空间形态 RSM 0.086 水岸空间形态 RfSM 0.512## 0.232 生态环境质量 EEQ 0.486## 0.659## 0.158 设施服务质量 FSQ 0.679## 0.653## 0.438## 0.190 可达性 AC 0.448# 0.573# 0.595## 0.631## 0.326 区位环境 SE 0.347## 0.445# 0.509## 0.695# 0.416# 0.188 注: 交互作用为双因子增强,标记#;为非线性增强,标记##。下同。Notes: interaction is “Enhance, bi-”, marked as #; “Enhance, nonlinear”, marked as ##. The same below.
下载: 导出CSV
表 5 周边街区活力对准则层交互探测结果
Table 5 Results for surrounding neighborhood vitality interaction detection at the criteria level
项目 Item 河道空间形态 RSM 水岸空间形态 RfSM 生态环境质量 EEQ 设施服务质量 FSQ 可达性 AC 区位环境 SE 河道空间形态 RSM 0.029 水岸空间形态 RfSM 0.267## 0.117 生态环境质量 EEQ 0.769## 0.775## 0.519 设施服务质量 FSQ 0.863## 0.754## 0.705# 0.521 可达性AC 0.260# 0.480## 0.724# 0.644# 0.200 区位环境 SE 0.191# 0.263# 0.806## 0.885## 0.280## 0.118
下载: 导出CSV
-
[1] 王建国, 吕志鹏. 世界城市滨水区开发建设的历史进程及其经验[J]. 城市规划, 2001(7): 41−46. doi: 10.3321/j.issn:1002-1329.2001.07.010 Wang J G, Lü Z P. A historic review of world urban waterfront development[J]. City Planning Review, 2001(7): 41−46. doi: 10.3321/j.issn:1002-1329.2001.07.010
[2] Smith H, Ferrari M S G. Waterfront regeneration: experiences in city-building[M]. New York: Routledge, 2012.
[3] 北京市规划和自然资源管理委员会, 中国建筑设计研究院有限公司. 北京滨水空间城市设计导则[Z]. 北京: 北京市规划和自然资源管理委员会, 2019. Beijing Municipal Commission of Planning and Natural Resources, China Architecture Design & Research Group. Urban design guidelines for Beijing waterfront [Z]. Beijing: Beijing Municipal Commission of Planning and Natural Resources, 2019.
[4] 北京市规划和自然资源管理委员会, 北京市城市规划设计研究院, 中国建筑设计研究院有限公司, 等. 北京市河道规划设计导则[Z]. 北京: 北京市规划和自然资源管理委员会, 2021. Beijing Municipal Commission of Planning and Natural Resources, Beijing Municipal Institute of city Planning & Design, China Architecture Design & Research Group, et al. Beijing river planning design guidelines [Z]. Beijing: Beijing Municipal Commission of Planning and Natural Resources, 2021.
[5] 上海市规划和自然资源局, 上海市水务局, 上海市城市规划设计研究院. 上海市河道规划设计导则[M]. 上海: 同济大学出版社, 2019. Shanghai Municipal Planning and Natural Resources Bureau, Shanghai Water Authority, Shanghai Urban Planning and Design Research Institute. Shanghai river planning & design guidelines[M]. Shanghai: Tongji University Press, 2019.
[6] 上海市住房和城乡建设管理委员会. 上海市黄浦江苏州河滨水公共空间条例[Z]. 上海: 上海市代表人民大会常务委员会, 2021. Shanghai Municipal Commission of Housing and Urban. Shanghai Huangpu River and Suzhou River waterfront public space regulations [Z]. Shanghai: Shanghai Municipal People’s Congress, 2021.
[7] 广东省人民政府. 广东省人民政府关于广东万里碧道总体规划(2020—2035年)的批复[J]. 广东省人民政府公报, 2020(24): 3−4. Guangdong Provincial People’s Government. Reply of the Guangdong Provincial People’s Government on the Master Plan of Guangdong WanliBiDao (2020−2035)[J]. Guangdong Provincial People’s Government Gazette, 2020(24): 3−4.
[8] 韩咏淳, 王世福, 邓昭华. 滨水活力与品质的思辨、实证与启示: 以广州珠江滨水区为例[J]. 城市规划学刊, 2021(4): 104−111. Han Y C, Wang S F, Deng Z H. Critique, empirical study, and implications of the vitality and quality of urban central waterfront: a case study of Guangzhou[J]. Urban Planning Forum, 2021(4): 104−111.
[9] Liu S, Lai S Q, Liu C, et al. What influenced the vitality of the waterfront open space? A case study of Huangpu River in Shanghai, China[J]. Cities, 2021, 114: 103197. doi: 10.1016/j.cities.2021.103197
[10] Niu Y, Mi X, Wang Z. Vitality evaluation of the waterfront space in the ancient city of Suzhou[J]. Frontiers of Architectural Research, 2021, 10(4): 729−740. doi: 10.1016/j.foar.2021.07.001
[11] Zhou Y Y, Liu Y X, Ge X P. The influence of urban waterfront space landscape form on the user’s physiology[C]//2021 International Conference on Culture-oriented Science & Technology (ICCST). New York: IEEE, 2021: 422−425.
[12] Ma Y, Ling C, Wu J. Exploring the spatial distribution characteristics of emotions of Weibo users in Wuhan waterfront based on gender differences using social media texts[J]. ISPRS International Journal of Geo-Information, 2020, 9(8): 465. doi: 10.3390/ijgi9080465
[13] 罗召鑫, 马蕙, 舒珊. 城市滨水空间恢复性评价的视听影响因素研究[J]. 南方建筑, 2021(1): 76−82. Luo Z X, Ma H, Shu S. A social survey on the visual and auditory factors influencing restorative perceptions of urban waterfront spaces[J]. Acta Geographica Sinica, 2021(1): 76−82.
[14] 李鑫, 吴丹子, 李倞, 等. 基于深度学习的城市滨河绿道景观视觉感知评价研究[J]. 北京林业大学学报, 2021, 43(12): 93−104. Li X, Wu D Z, Li L, et al. Research on visual perception evaluation of urban riverside greenway landscape based on deep learning[J]. Journal of Beijing Forestry University, 2021, 43(12): 93−104.
[15] 刘颂, 赖思琪. 多源数据支持下的城市滨水公共空间使用人群多样性影响因素[J]. 风景园林, 2021, 28(9): 75−81. Liu S, Lai S Q. Factors influencing users diversity of urban waterfront public spaces based on multi-source data[J]. Landscape Architecture, 2021, 28(9): 75−81.
[16] 王何王, 张春阳. 嫁接与融合: 公共理性视野下的城市滨水公共空间规划管控探讨[J]. 规划师, 2021, 37(18): 28−34. Wang H W, Zhang C Y. Grafting and integration: discussion on the planning and control of urban waterfront public space from the perspective of public reason[J]. Planners, 2021, 37(18): 28−34.
[17] 吴桐, 王列升, 孙一豪, 等. 城市建成区水景观建设综合效益评价方法及应用: 以潍坊市为例[J]. 北京林业大学学报, 2020, 42(11): 105−117. Wu T, Wang L S, Sun Y H, et al. Comprehensive benefit evaluation method and application of water landscape construction in urban built-up area: a case study of Weifang City, Shandong Province of eastern China[J]. Journal of Beijing Forestry University, 2020, 42(11): 105−117.
[18] 袁敬诚, 董潇迪, 曲天媛. 健康导向的城市滨水空间研究进展与展望[J]. 规划师, 2021, 37(15): 51−60. Yuan J C, Dong X D, Qu T Y. Health oriented waterfront space research progress and prospects[J]. Planners, 2021, 37(15): 51−60.
[19] Jacobs J. The death and life of great American cities [M]. New York: Random House, 1961.
[20] Whyte W H. The social life of small urban spaces [M]. NewYork: Project for Public Spaces, Inc., 1980.
[21] Gehl J. Life between buildings[M]. New York: VAN Nostrand Reinhold, 2003.
[22] 王建国. 包容共享、显隐互鉴、宜居可期: 城市活力的历史图景和当代营造[J]. 城市规划, 2019, 43(12): 9−16. Wang J G. Inclusiveness and sharing, explicit and implicit mutual learning, livability predicted: historical prospect and contemporary creation of urban vitality[J]. City Planning Review, 2019, 43(12): 9−16.
[23] 蒋涤非. 城市形态活力论[M]. 南京: 东南大学出版社, 2007. Jiang D F. The theory of city form vitality[M]. Nanjing: Southeast University Press, 2007.
[24] 童明. 城市肌理如何激发城市活力[J]. 城市规划学刊, 2014(3): 85−96. Tong M. How urban fabric can help sustain the vitality of cities[J]. Urban Planning Forum, 2014(3): 85−96.
[25] 王佐. 城市滨水开放空间的活力复兴及对我国的启示[J]. 建筑学报, 2007(7): 15−17. doi: 10.3969/j.issn.0529-1399.2007.07.005 Wang Z. The revitalization of urban waterfront open space and implications for China[J]. Architectural Journal, 2007(7): 15−17. doi: 10.3969/j.issn.0529-1399.2007.07.005
[26] Timur U P. Urban waterfront regenerations[M]//Advances in landscape architecture. New York: Intech Open, 2013.
[27] 金云峰, 陈栋菲, 王淳淳, 等. 公园城市思想下的城市公共开放空间内生活力营造途径探究: 以上海徐汇滨水空间更新为例[J]. 中国城市林业, 2019, 17(5): 52−56, 62. Jin Y F, Chen D F, Wang C C, et al. Study of the way to motivate endogenous vitality of public open space under the thought of Park City: a case study of Shanghai Xuhui waterfront renewal[J]. Journal of Chinese Urban Forestry, 2019, 17(5): 52−56, 62.
[28] 袁诺亚, 梅磊, 张志清. 滨水工业地区活力再生更新策略与实践[J]. 规划师, 2021, 37(7): 45−50. Yuan N Y, Mei L, Zhang Z Q. Waterfront industrial area renovation planning strategy and practice[J]. Planners, 2021, 37(7): 45−50.
[29] 王伟强, 马晓娇. 基于多源数据的滨水公共空间活力评价研究: 以黄浦江滨水区为例[J]. 城市规划学刊, 2020(1): 48−56. Wang W Q, Ma X J. Vitality assessment of waterfront public space based on multi-source data: a case study of the Huangpu River waterfront[J]. Urban Planning Forum, 2020(1): 48−56.
[30] 刘羿伯, 徐苏宁, 刘文茜, 等. 多源数据支持下的北京滨水街区活力测度及影响因素分析[J]. 建筑学报, 2021(增刊1): 120−127. Liu Y B, Xu S N, Liu W Q, et al. Vitality measurement and analysis of the influencing factors of waterfront blocks in Beijing based on multisource data[J]. Architectural Journal, 2021(Suppl. 1): 120−127.
[31] 王世福, 覃小玲, 邓昭华. 环境行为学视角下城市滨水空间活力协调度研究[J]. 热带地理, 2021, 41(5): 1009−1022. Wang S F, Qin X L, Deng Z H. Vitality coordination degree at the urban waterfront from the perspective of environmental behavior studies[J]. Tropical Geography, 2021, 41(5): 1009−1022.
[32] 刘颂, 赖思琪. 基于多源数据的城市公共空间活力影响因素研究: 以上海市黄浦江滨水区为例[J]. 风景园林, 2021, 28(3): 75−81. Liu S, Lai S Q. Influence factors of urban public space vitality based on multi-source data: a case study of Huangpu River waterfront area of Shanghai[J]. Landscape Architecture, 2021, 28(3): 75−81.
[33] 李萌. 基于居民行为需求特征的“15分钟社区生活圈”规划对策研究[J]. 城市规划学刊, 2017(1): 111−118. Li M. The planning strategies of a 15-minute community life circle based on behaviors of residents[J]. Urban Planning Forum, 2017(1): 111−118.
[34] 郝新华, 龙瀛, 石淼, 等. 北京街道活力: 测度、影响因素与规划设计启示[J]. 上海城市规划, 2016(3): 37−45. Hao X H, Long Y, Shi M, et al. Street vibrancy of Beijing: measurement, impact factors and design implication[J]. Shanghai Urban Planning Review, 2016(3): 37−45.
[35] 张海林. 基于百度热力图的人口活动数量提取与规划应用[J]. 城市交通, 2021, 19(3): 103−111. Zhang H L. Extracting active population data based on Baidu heat maps for transportation planning applications[J]. Urban Transport of China, 2021, 19(3): 103−111.
[36] 刘颂, 赖思琪. 大数据支持下的城市公共空间活力测度研究[J]. 风景园林, 2019, 26(5): 24−28. Liu S, Lai S Q. Measurement of urban public space vitality based on big data[J]. Landscape Architecture, 2019, 26(5): 24−28.
[37] Ye Y, Li D, Liu X. How block density and typology affect urban vitality: an exploratory analysis in Shenzhen, China[J]. Urban Geography, 2018, 39(4): 631−652. doi: 10.1080/02723638.2017.1381536
[38] Xia C, Yeh A G O, Zhang A. Analyzing spatial relationships between urban land use intensity and urban vitality at street block level: A case study of five Chinese megacities[J]. Landscape and Urban Planning, 2020, 193: 103669. doi: 10.1016/j.landurbplan.2019.103669
[39] 倪九派, 李萍, 魏朝富, 等. 基于AHP和熵权法赋权的区域土地开发整理潜力评价[J]. 农业工程学报, 2009, 25(5): 202−209. doi: 10.3969/j.issn.1002-6819.2009.05.38 Ni J P, Li P, Wei C F, et al. Potentialities evaluation of regional land consolidation based on AHP and entropy weight method[J]. Transactions of the Chinese Society of Agricultural Engineering, 2009, 25(5): 202−209. doi: 10.3969/j.issn.1002-6819.2009.05.38
[40] Ozernoy V M. Choosing the “Best” multiple criterlv decision-making method[J]. INFOR: Information Systems and Operational Research, 1992, 30(2): 159−171. doi: 10.1080/03155986.1992.11732192
[41] 雷勋平, 邱广华. 基于熵权TOPSIS模型的区域资源环境承载力评价实证研究[J]. 环境科学学报, 2016, 36(1): 314−323. Lei X P, Qiu G H. Empirical study about the carrying capacity evaluation of regional resources and environment based on entropy-weight TOPSIS model[J]. Acta Scientiae Circumstantiae, 2016, 36(1): 314−323.
[42] 宓泽锋, 曾刚, 尚勇敏, 等. 中国省域生态文明建设评价方法及空间格局演变[J]. 经济地理, 2016, 36(4): 15−21. Mi Z F, Zeng G, Shang Y M, et al. The evaluation method and spatial pattern evolution of ecological civilization construction of Chinese provinces[J]. Economic Geography, 2016, 36(4): 15−21.
[43] 李佳洺, 陆大道, 徐成东, 等. 胡焕庸线两侧人口的空间分异性及其变化[J]. 地理学报, 2017, 72(1): 148−160. doi: 10.11821/dlxb201701012 Li J M, Lu D D, Xu C D, et al. Spatial heterogeneity and its changes of population on the two sides of Hu Line[J]. Acta Geographica Sinica, 2017, 72(1): 148−160. doi: 10.11821/dlxb201701012
[44] 王劲峰, 徐成东. 地理探测器: 原理与展望[J]. 地理学报, 2017, 72(1): 116−134. doi: 10.11821/dlxb201701010 Wang J F, Xu C D. Geodetector: principle and prospective[J]. Acta Geographica Sinica, 2017, 72(1): 116−134. doi: 10.11821/dlxb201701010
[45] Wang J, Li X, Christakos G, et al. Geographical detectors-based health risk assessment and its application in the neural tube defects study of the Heshun Region, China[J]. International Journal of Geographical Information Science, 2010, 24(1−2): 107−127.
[46] 祝宇菲. 大运河(北京段)典型性滨水泊岸景观形态分析及优化策略研究[D]. 天津: 天津理工大学, 2021. Zhu Y F. Analysis and optimization strategy of typical waterfront and waterfront landscape of Grand Canal (Beijing section) [D]. Tianjin: Tianjin University of Technology, 2021.
[47] 肖健. 滨水景观通廊空间指数分析方法研究: 以空间开敞度和干扰度指数分析为例[D]. 重庆: 重庆大学, 2015. Xiao J. A study on analysis method of spatial index of waterfront landscape corridors: take index analysis of spatial openness and spatial interference for example [D]. Chongqing: Chongqing University, 2015.
-
期刊类型引用(19)
1. 许馨元,田刚,唐铭野. 中俄两国森林碳汇合作潜力及绿色效应研究. 商业经济. 2025(01): 80-83 .  百度学术
百度学术
2. 王晓红,辛守英,张薇,焦琳琳. 基于主成分分析下贝叶斯优化卷积神经网络模型人工林树种识别的研究. 森林工程. 2025(02): 298-311 . 百度学术
3. 吕洁华,乔雅,王钰,吕昕怡. 中国省域森林碳储量空间溢出效应与门槛效应研究. 农林经济管理学报. 2024(01): 79-90 . 百度学术
4. 农万相,文军,何静玥,徐靖. 集体林权制度改革研究进展与热点分析. 广西林业科学. 2024(01): 135-143 . 百度学术
5. 朱赞,王勇军,王建琦,许玉兰,丘鑫琪,万喜. 基于无人机倾斜摄影的广西桉树冠层碳储量计量模型构建. 林草资源研究. 2024(01): 88-94 . 百度学术
6. 马玉祥,安兆龙. 异质性环境规制对森林碳汇增长的影响机制分析. 低碳世界. 2024(04): 196-198 . 百度学术
7. 袁天健,霍礼鑫,王芳,过建春,柯佑鹏. “两山”理念下海南省森林固碳量与影响因素分析. 林业经济问题. 2024(01): 51-58 . 百度学术
8. 冯悦,岳永杰,赵鹏武. 碳中和愿景下森林碳储量核算及固碳潜力评价研究进展. 内蒙古农业大学学报(自然科学版). 2024(02): 93-100 . 百度学术
9. 辛启迪,石玉琼,杨秀云,武小钢. 中国大中城市社区碳排放现状分析. 北京建筑大学学报. 2024(04): 36-46 . 百度学术
10. 罗晓红. 基层林业发展中林长制工作的思考与探索. 林业科技情报. 2024(04): 143-145 . 百度学术
11. 陈懿,杨志香. “双碳”目标下云南林业资源保护与高速公路工程建设的关系及融合措施. 农业灾害研究. 2024(11): 206-208 . 百度学术
12. 邹佳敏,吴芝花,廖文梅,王智鹏. 我国森林碳汇与居民福祉耦合关系的时空演变研究. 林业经济. 2023(02): 62-75 . 百度学术
13. 马军. 浅谈如何发挥林业在低碳经济中的作用. 山西农经. 2023(08): 129-131 . 百度学术
14. 刘锴,马嘉昕. 中国海洋渔业碳汇的时空演变及发展态势. 资源开发与市场. 2023(07): 778-785 . 百度学术
15. 闭洪峰,韦莹,叶家义,李学团,陆卫勇. 低碳经济视域下林业产业结构与林业经济发展研究——以广西林业为例. 山西农经. 2023(15): 135-137 . 百度学术
16. 陈卫洪,路雯晶,王莹,肖贵秀. 数字普惠金融与生态林业耦合协调发展及驱动因素研究——基于生态产品价值转化视角. 生态经济. 2023(11): 128-135+155 . 百度学术
17. 于鲁冀,张亚慧,王燕鹏,刘莹莹,李昊. 河南省森林碳汇价值时空特征及其影响因素. 水土保持通报. 2023(05): 288-296 . 百度学术
18. 倪红红,马强,卜元坤,杨小轩,李卫忠. 陕西省林业企业时空格局演变及影响因素分析. 干旱区地理. 2023(12): 2098-2110 . 百度学术
19. 董倩倩,杜文涛,赵雅. 生态保护背景下推动林业经济发展的策略研究. 农业灾害研究. 2023(11): 287-289 . 百度学术
其他类型引用(12)


计量
- 文章访问数: 529
- HTML全文浏览量: 162
- PDF下载量: 130
- 被引次数: 31
