
Dynamics of root decomposition and carbon and nitrogen release of four tree species with different diameter classes in the cold temperate zone
-
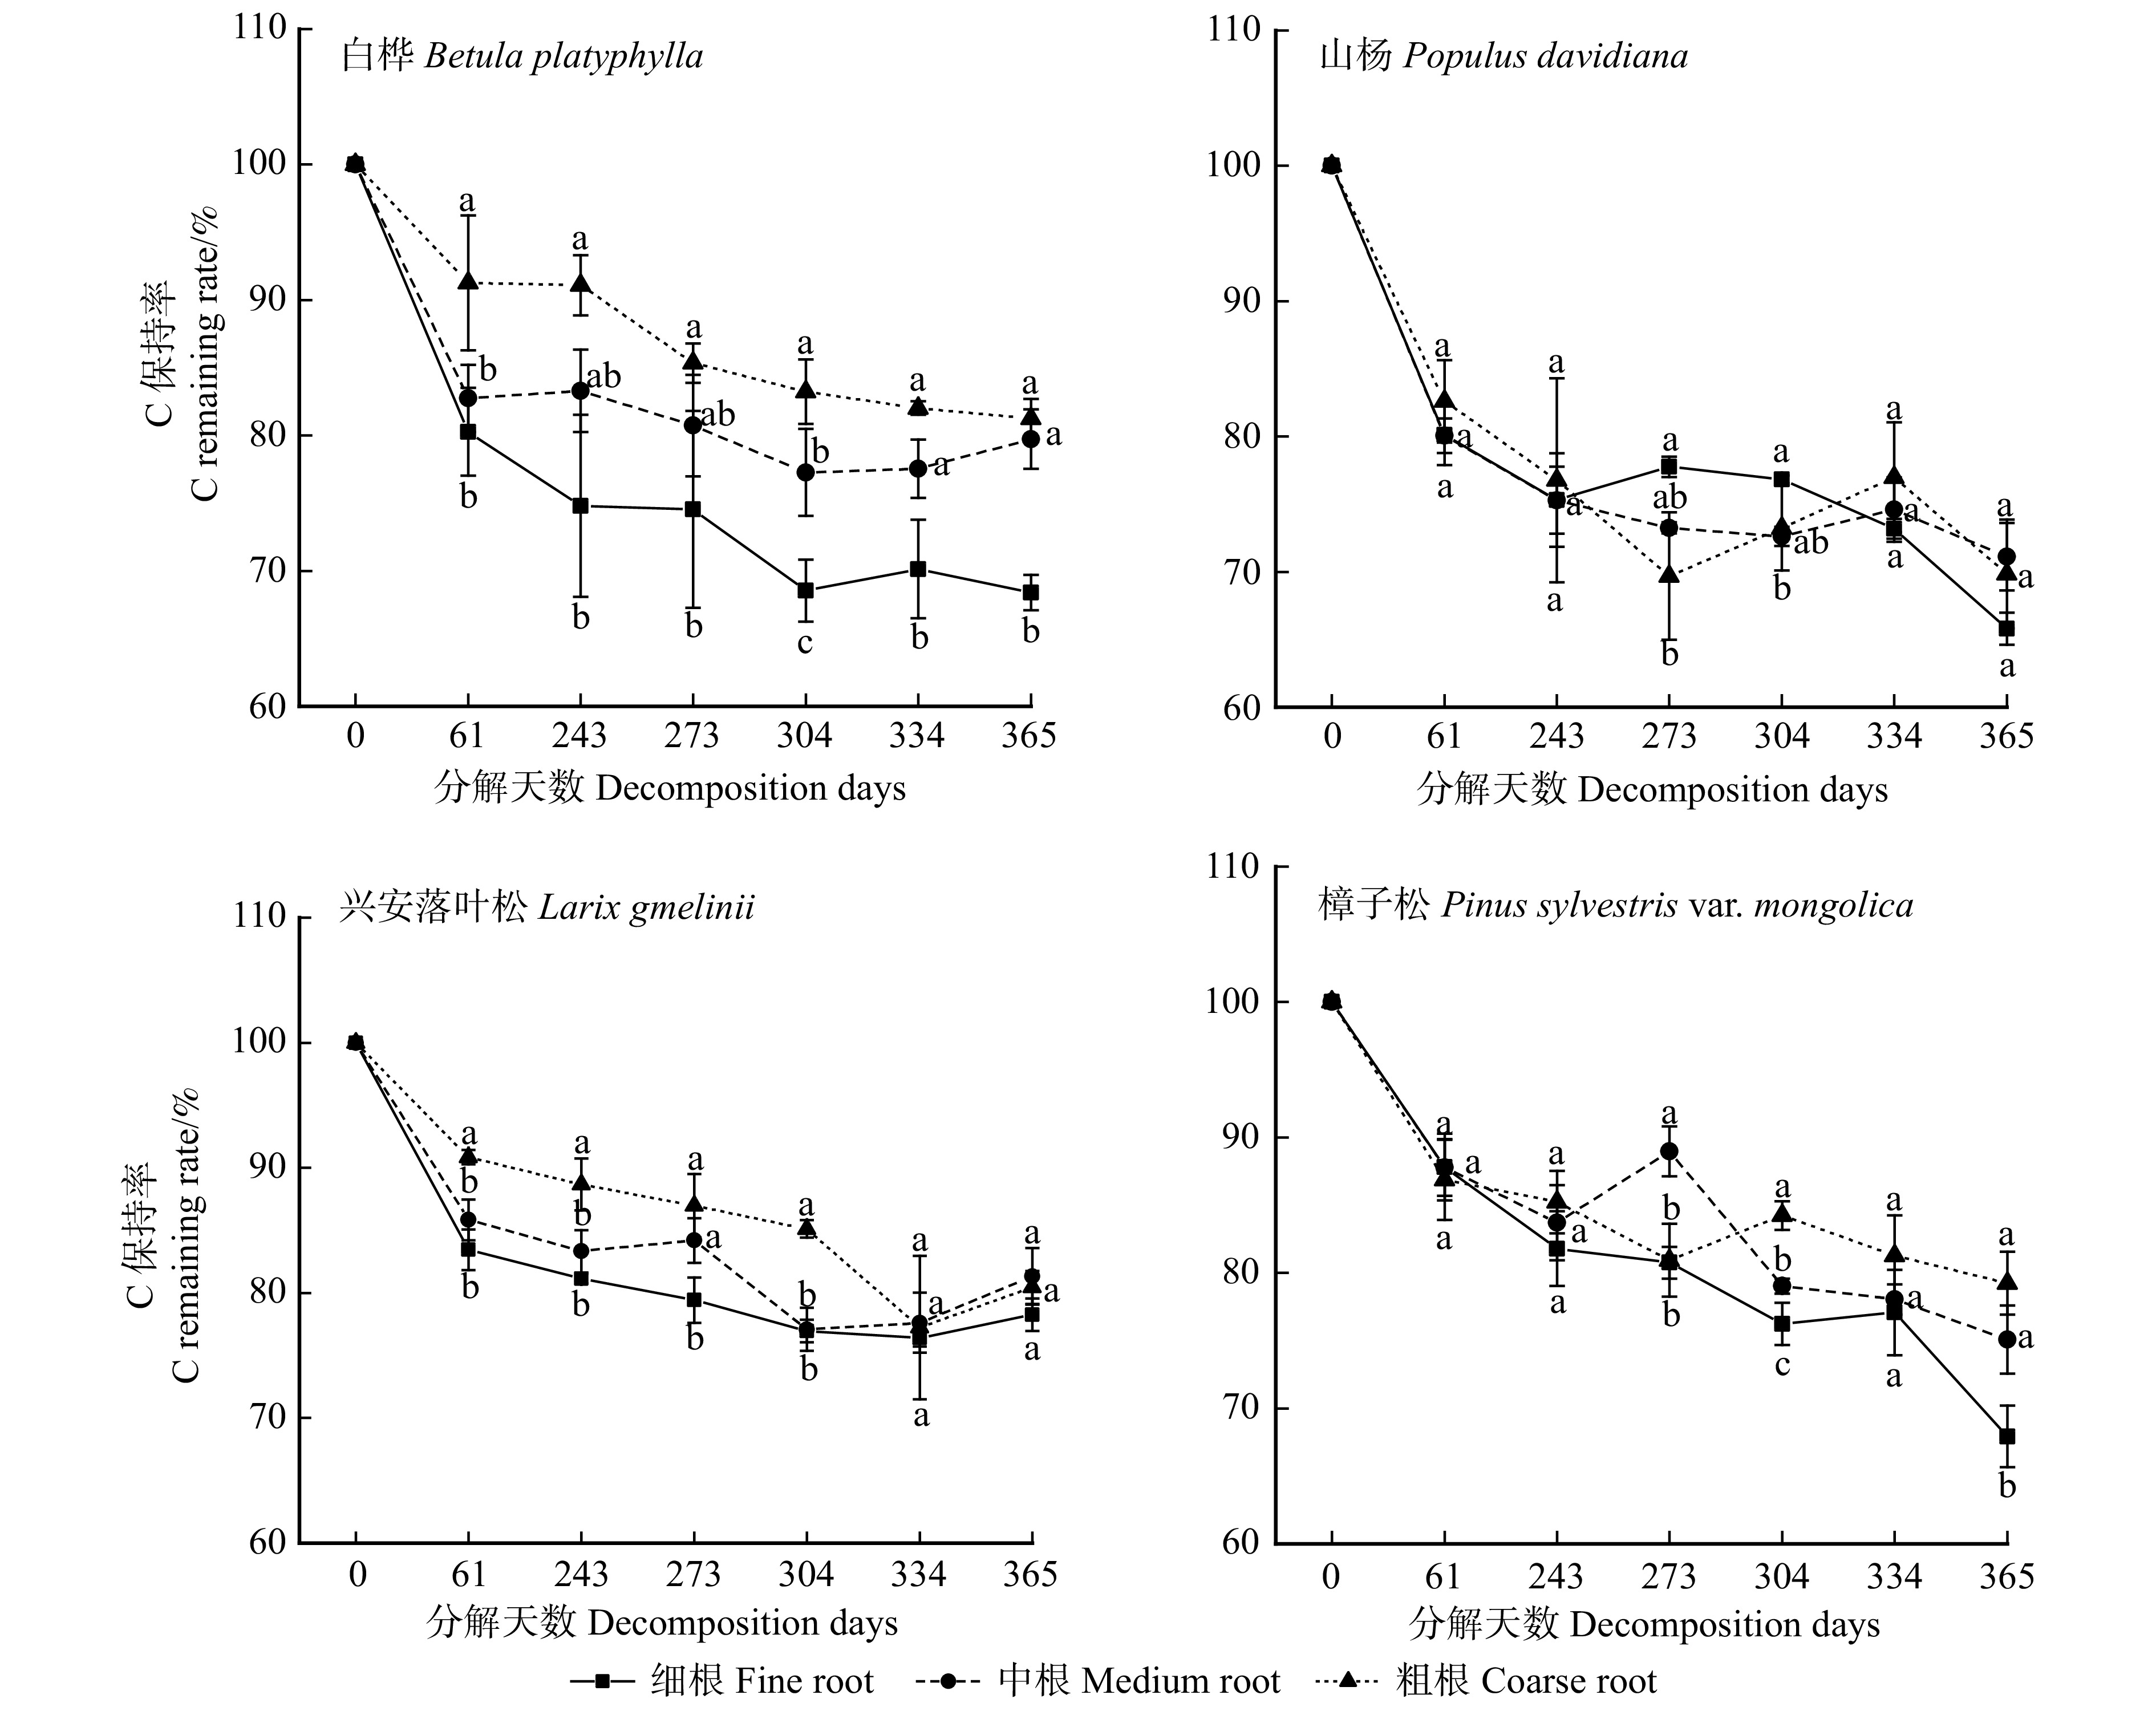
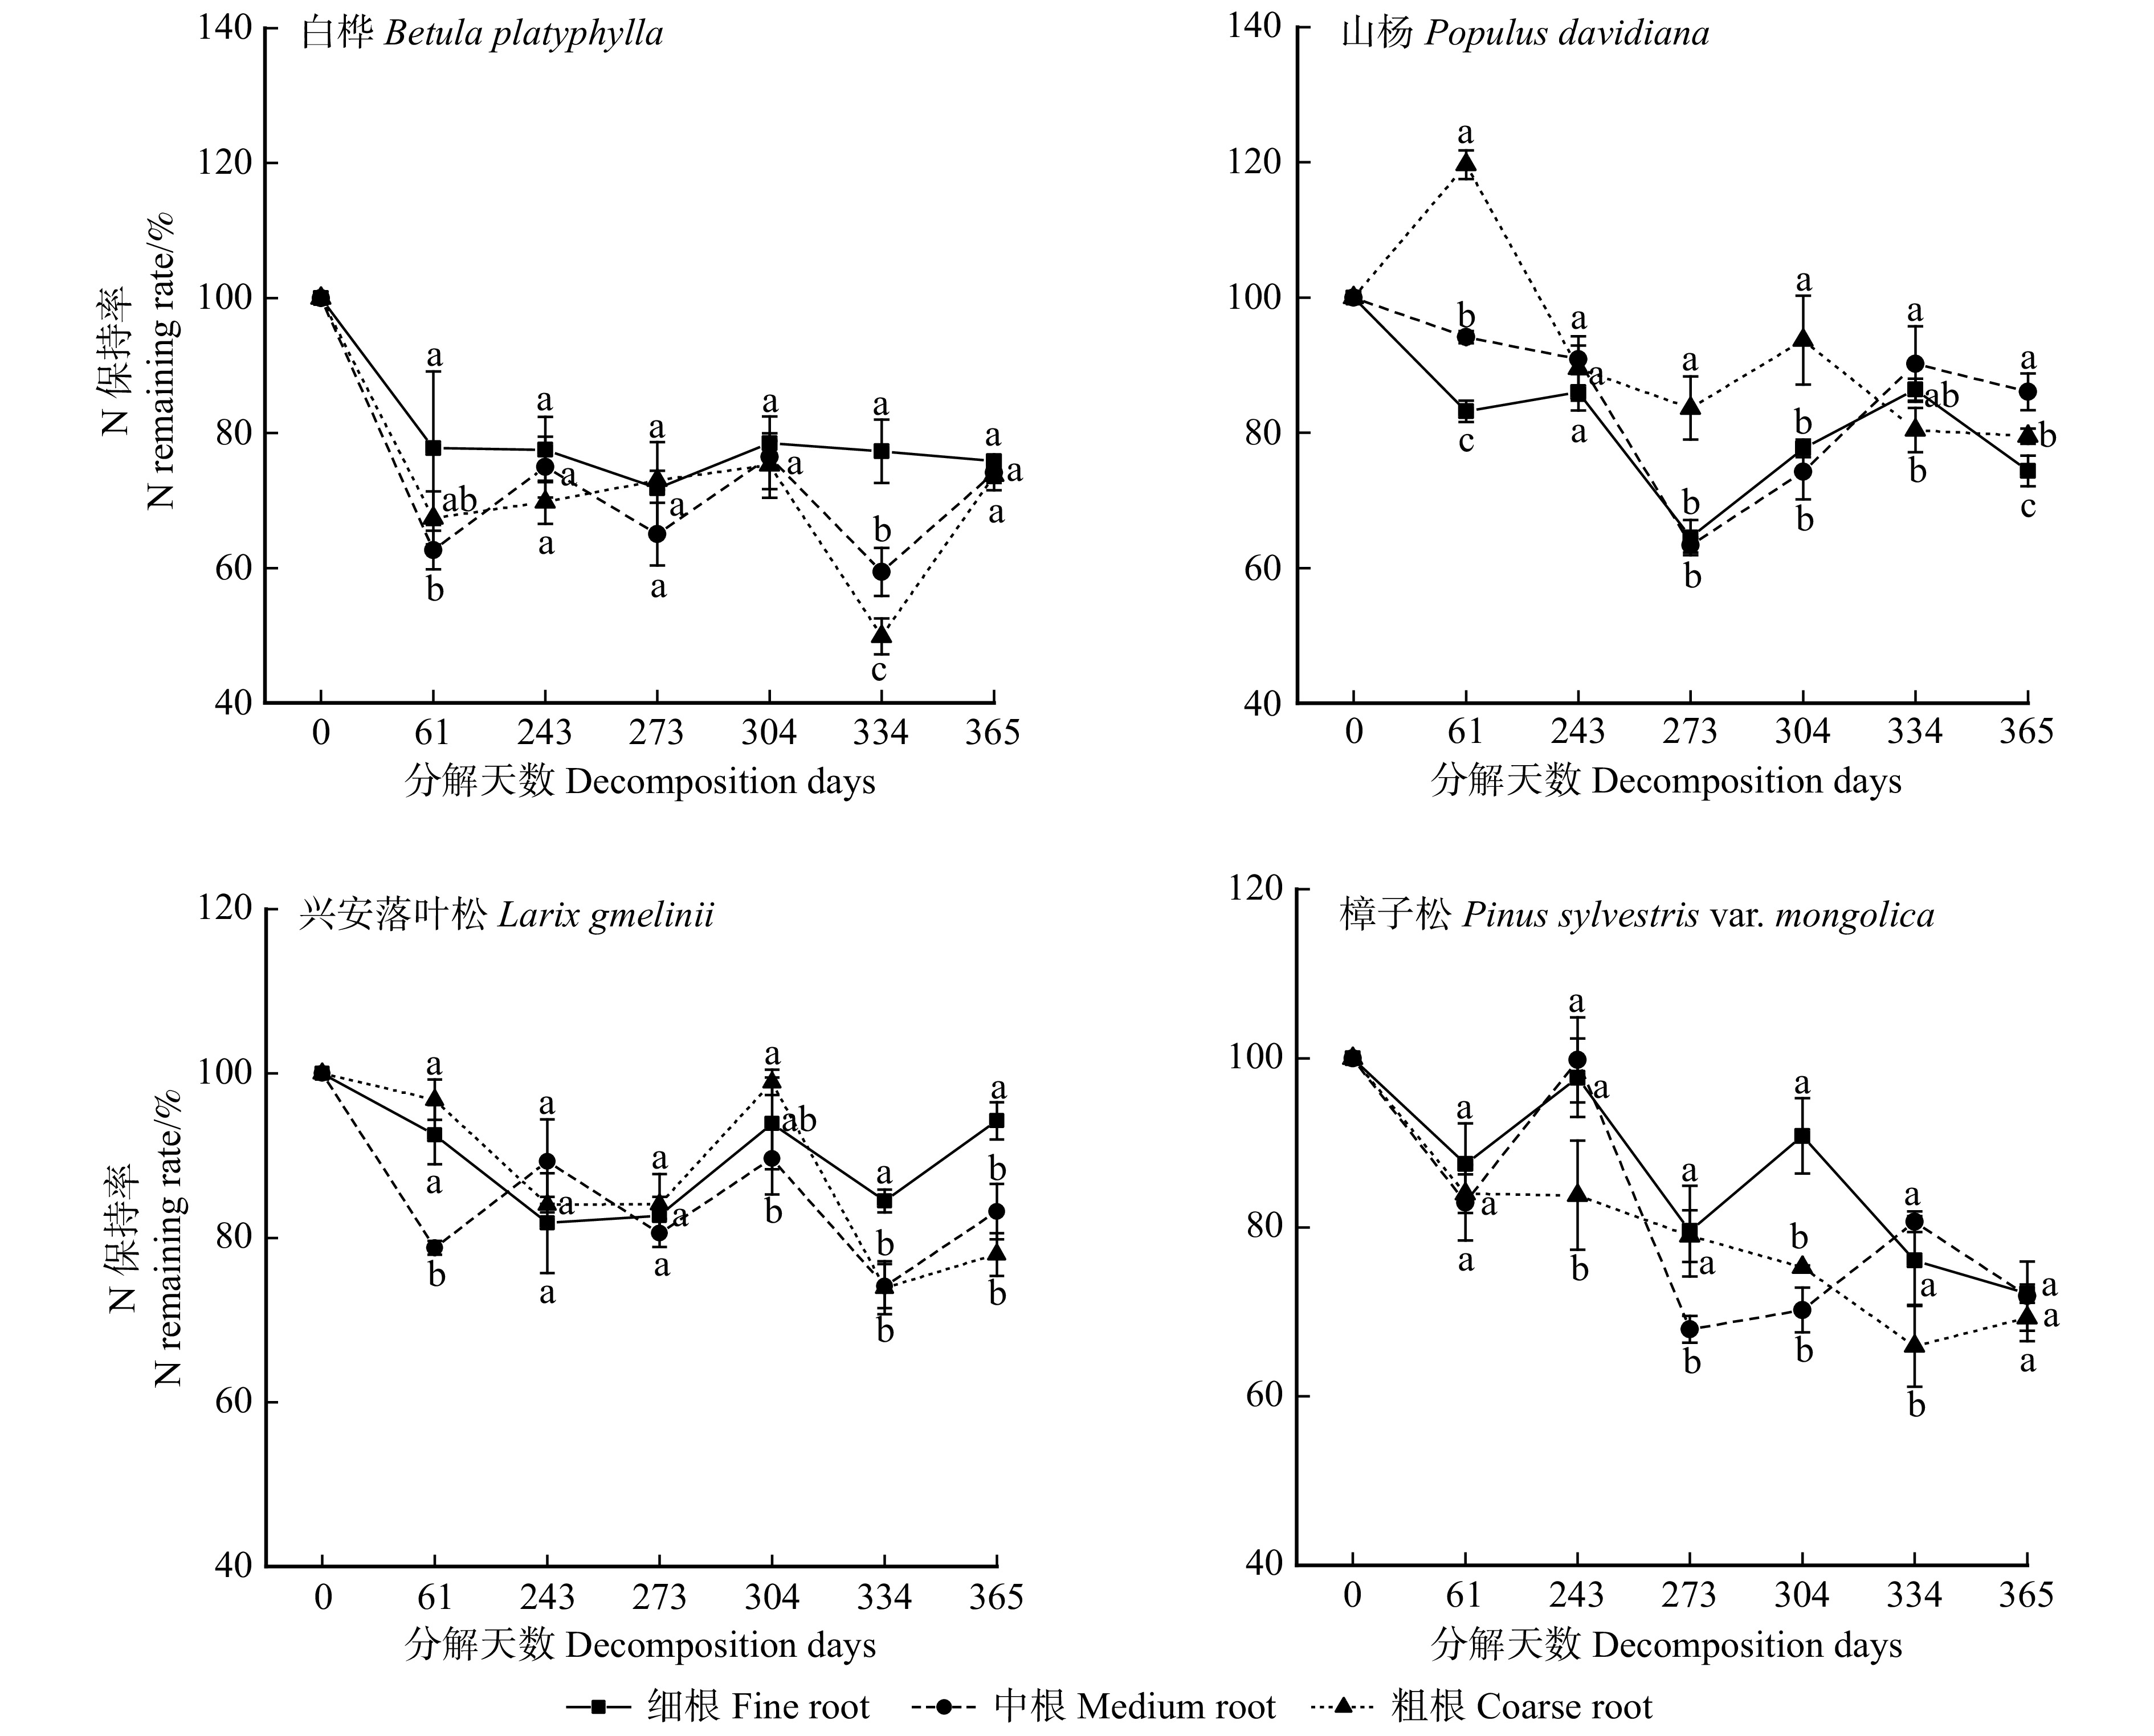
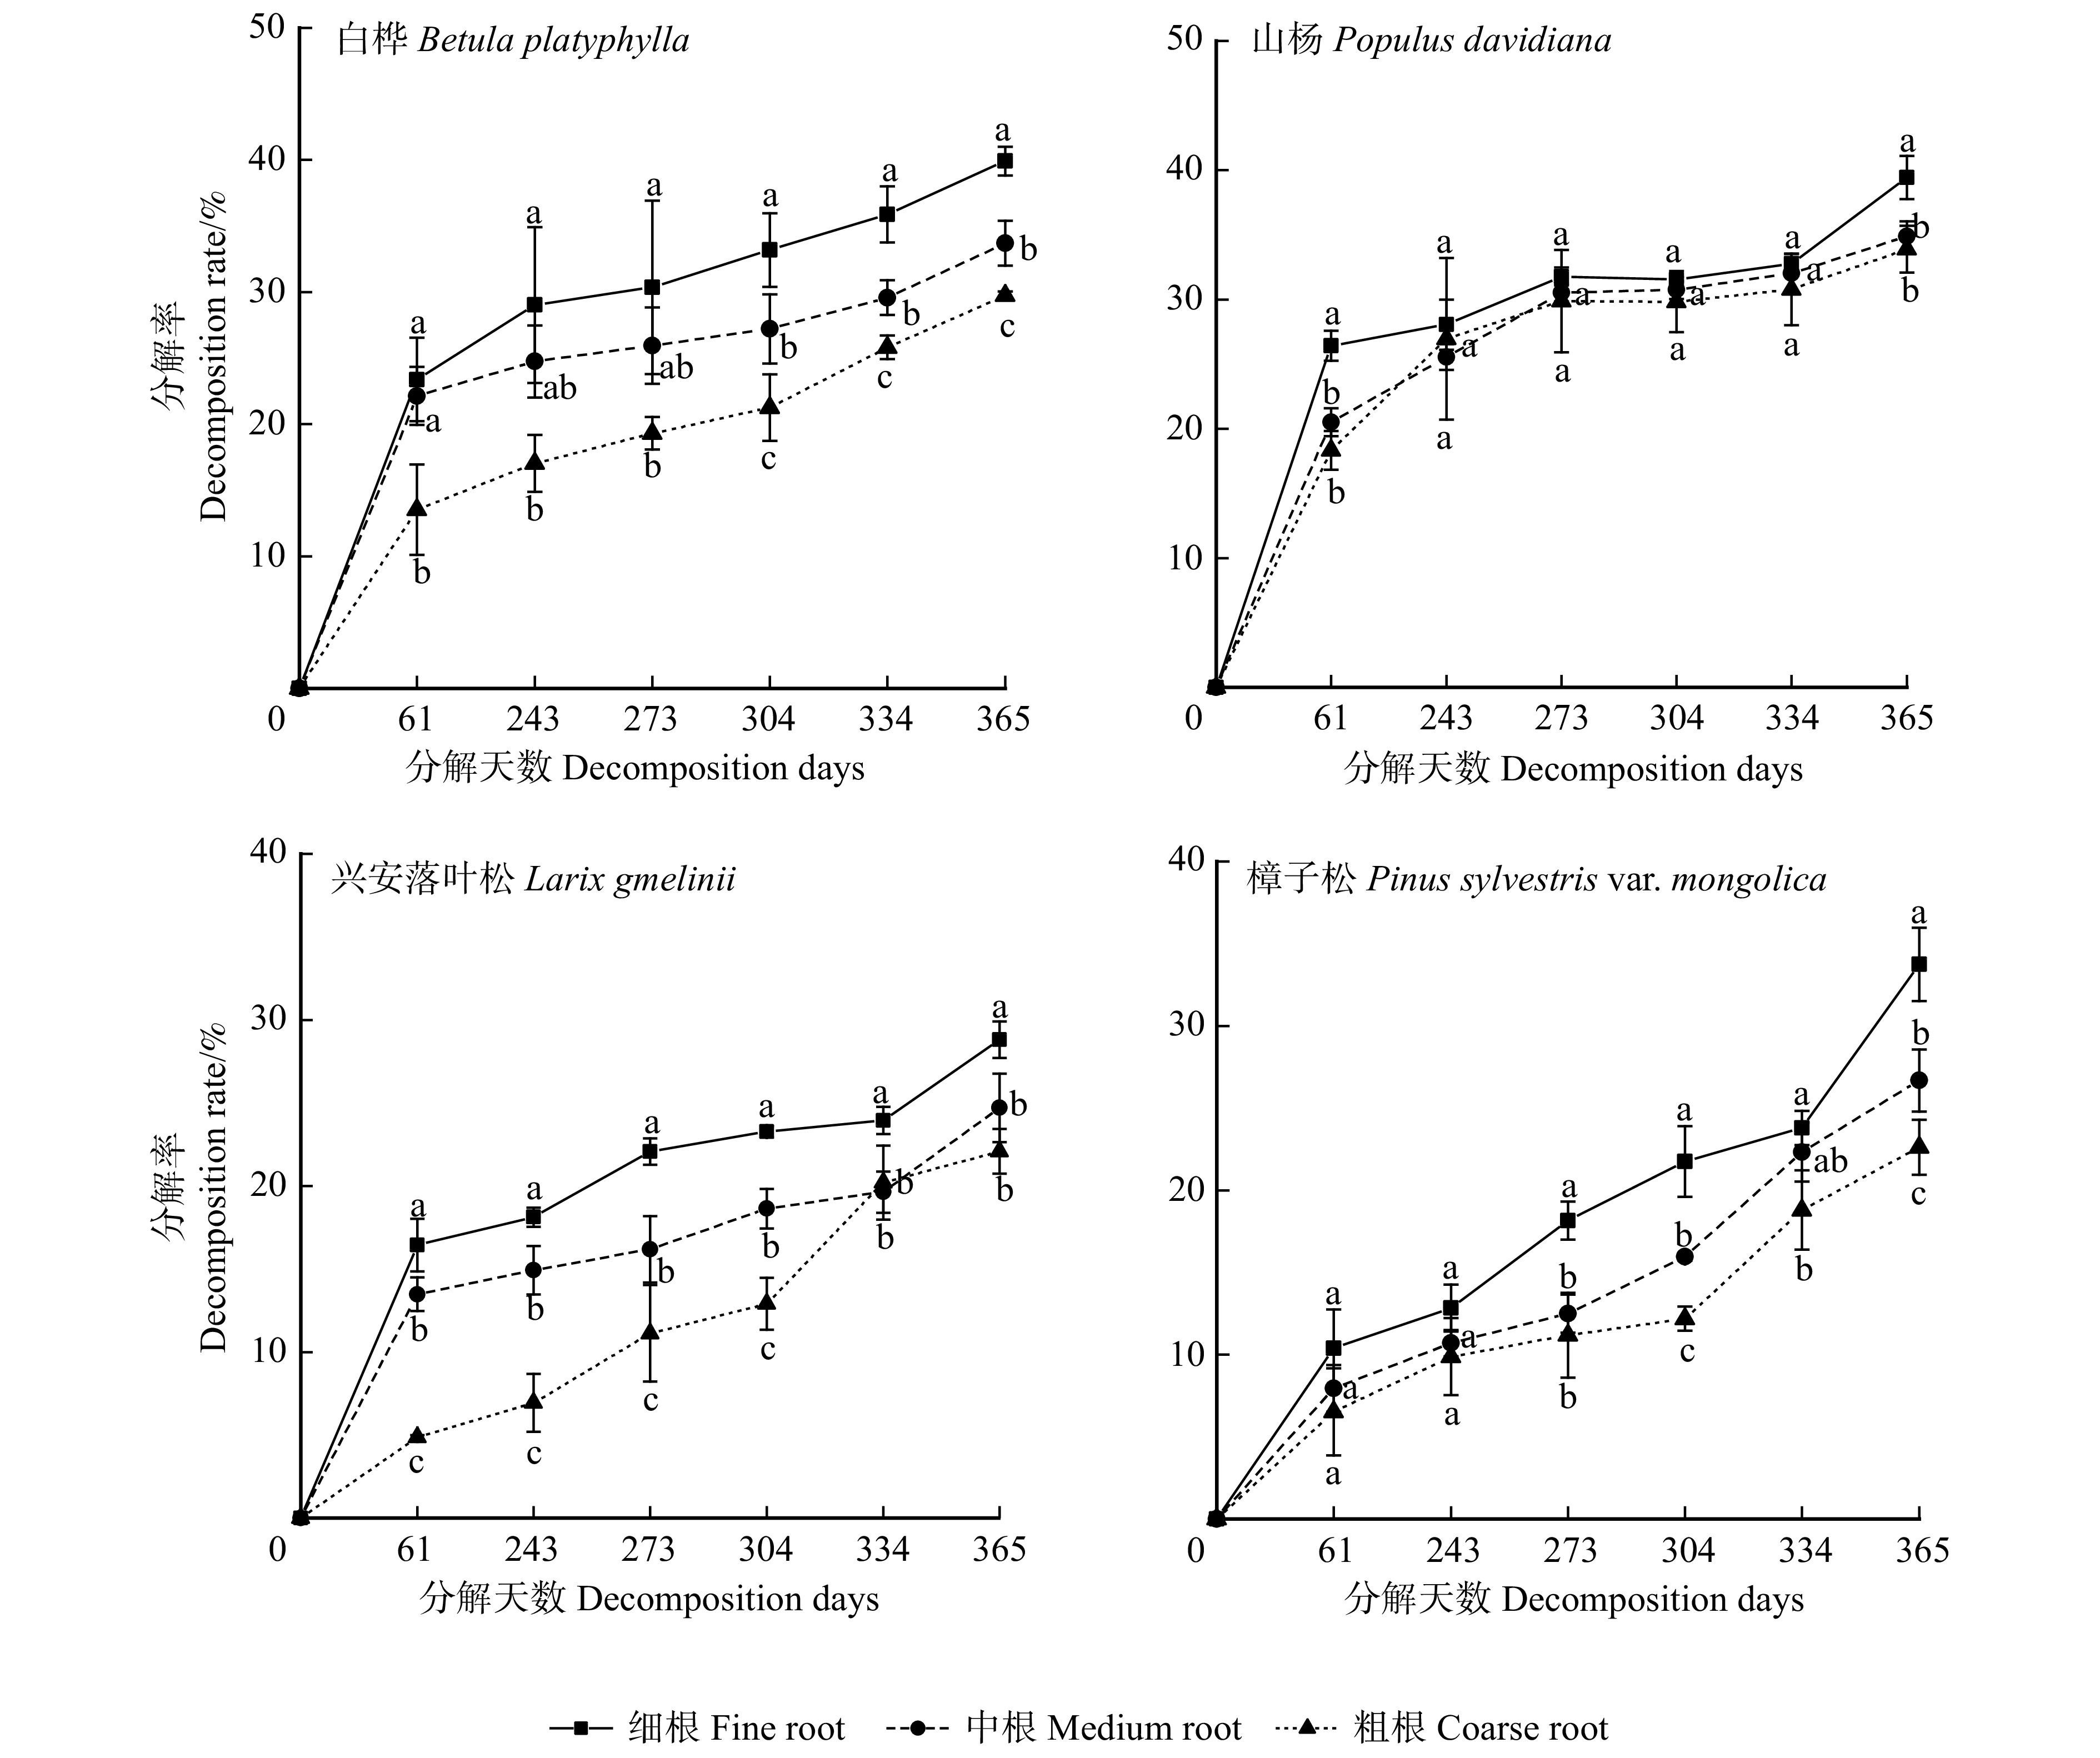
摘要:目的 探讨我国寒温带地区不同树种不同径级根系分解及碳、氮养分释放特征,为了解我国寒温带地区乔木树种根系分解和碳、氮养分循环提供科学参考。方法 在2020年8月—2021年8月采用网袋分解法,连续1年对我国大兴安岭地区主要乔木树种白桦、山杨、兴安落叶松和樟子松的(细根(≤ 2 mm)、中根(2 ~ 5 mm)和粗根(5 ~ 10 mm))的分解速率及碳、氮元素动态进行研究。结果 (1)分解1年后,白桦、山杨、兴安落叶松和樟子松各径级根系年分解率分别波动在(29.75% ~ 39.92%)、(33.90% ~ 39.45%)、(22.08% ~ 28.80%)和(22.62% ~ 33.75%)之间,且不同径级间根系分解率表现为细根 > 中根 > 粗根,白桦和山杨高于兴安落叶松和樟子松,且分解初期(0 ~ 61 d)分解速率较高,243 ~ 365 d分解速率较低。(2)利用Olson指数衰减模型计算各树种根系年分解系数k发现:同一树种根系年分解系数均随直径增大而减小,白桦细根分解系数最高,为0.508 5。同一径级不同树种间,白桦和山杨根系年分解系数显著高于兴安落叶松和樟子松,且樟子松中根和粗根年分解系数仅为山杨的50%左右。(3)不同分解时期,4个树种各径级根系碳和氮表现出不同程度的释放或富集,碳和氮释放率均在分解初期(0 ~ 61 d)表现为最大,碳释放率在分解243 ~ 273 d时较小,分解304 ~ 365 d时氮富集较多。分解1年时间,4个树种各径级根系均表现为碳和氮的释放,释放率分别在(18.68% ~ 34.21%)和(14.90% ~ 28.92%)之间,且白桦和山杨碳和氮的释放率高于兴安落叶松和樟子松,细根碳释放率最大,而中根和粗根氮释放率相对较高。结论 不同树种、不同径级根系在不同分解时期分解速率及碳、氮养分释放率存在较大差异,白桦和山杨分解速率及碳、氮释放率均高于兴安落叶松和樟子松。Abstract:Objective The root decomposition and carbon and nitrogen nutrient release characteristics of different tree species in cold temperate zone were discussed in order to provide scientific reference for understanding the root decomposition and carbon and nitrogen nutrient cycling of tree species in cold temperate zone.Method Mesh bag decomposition method was adopted from August 2020 to August 2021. The decomposition rates and the dynamics of carbon and nitrogen elements of fine roots (≤ 2 mm), middle roots (2−5 mm) and coarse roots (5−10 mm) of Betula platyphylla, Populus davidiana, Larix gmelinii and Pinus sylvestris var. mongolica were studied for one consecutive year in the Daxing’an Mountains region of northeastern China.Result (1) After 365 d of decomposition, the annual root decomposition rates of Betula platyphylla, Populus davidiana, Larix gmelinii and Pinus sylvestris var. mongolica varied in 29.75%−39.92%, 33.90%−39.45%, 22.08%−28.80% and 22.62%−33.75%, respectively. The root decomposition rate of different diameter classes was fine root > medium root > coarse root, Betula platyphylla and Populus davidiana were higher than those of Larix gmelinii and Pinus sylvestris var. mongolica. The decomposition rates were higher at the initial stage of decomposition (0−61 d) and lower at 243−365 d. (2) Olson exponential decay model was used to calculate the annual root decomposition coefficient (k) of each tree species. It was found that: the decomposition coefficient of fine root of Betula platyphylla was the highest, which was 0.508 5. The decomposition coefficient of fine root of Betula platyphylla and Populus davidiana was significantly higher than that of Larix gmelinii and Pinus sylvestris var. mongolica in the same diameter class, and the decomposition coefficient of middle root and coarse root of Pinus sylvestris var. mongolica was only about 50% of that of Populus davidiana. (3) At different decomposition stages, root carbon and nitrogen of all diameter sizes of the four tree species showed different degrees of release or enrichment. The release rate of carbon and nitrogen was the highest at the initial stage of decomposition (0−61 d), the release rate of carbon was lower at 243−273 d decomposition stage, and the enrichment of nitrogen was higher at 304−365 d decomposition stage. After one year of decomposition, the release rates of carbon and nitrogen were in the range of 18.68%−34.21% and 14.90%−28.92%, respectively. The total carbon and nitrogen release rates of Betula platyphylla and Populus davidiana were higher than those of Larix gmelinii and Pinus sylvestris var. mongolica. The release rate of carbon from fine roots was the highest, while the release rate of nitrogen from medium and coarse roots was relatively low.Conclusion The decomposition rate and nutrient release rate of carbon and nitrogen of roots of different tree species and diameters differ greatly in different stages. The decomposition rates and carbon and nitrogen nutrient release rates of Betula platyphylla and Populus davidiana are higher than those of Larix gmelinii and Pinus sylvestris var. mongolica.
-
Keywords:
- decomposition rate /
- diameter class /
- nutrient release /
- Daxing’an Mountain region
-
中国是世界上土壤侵蚀比较严重的国家之一,土壤侵蚀不仅会降低土地生产力、抑制植被生长、恶化生态环境,还会引发一系列污染和气候问题。土壤抗蚀性指土壤抵抗侵蚀营力对其分散、破坏的能力[1-2],它是影响土壤侵蚀的根本因素,也是反映土壤抵抗侵蚀营力的重要指标[3]。研究土壤抗蚀性对防治水土流失、控制土壤侵蚀有重要意义。
土壤抗蚀性的强弱与土壤内在理化性质和植被类型等外在因素密切相关[1,4],其评价指标可归纳为水稳性团聚体类、微团聚体类、无机黏粒类、有机胶体类和土壤力学相关类5大类[5]。但不同研究区的主要评价指标不同,如在南方红壤区[6]结构性颗粒指数、土壤团聚度和结构体破坏率等是表征土壤抗蚀性强弱的关键指标,而在三峡库区消落带[7]则为黏粒、 > 0.25 mm水稳性团粒和有机质含量。同样,不同土地利用类型因其植被和土壤的不同也会导致土壤抗蚀性出现差异。刘宽梅等[8]发现喀斯特地区表层土壤中阔叶林的土壤抗蚀性强于灌木林和针叶林;刘旦旦等[9]在黄土坡面上的研究表明,林地对土壤的改良作用强于荒草地和农耕地,使土壤质地变好,抗蚀性增强。此外,薛箑等[10]对不同退耕年限人工灌木林土壤抗蚀性的研究发现,土壤水稳性团聚体和有机质含量随退耕年限的增大呈增加趋势,土壤团聚状况逐渐变好,抗蚀性显著增强。可见不同研究区甚至同一研究区不同研究对象的土壤抗蚀性及其评价指标存在差异,但以上研究主要集中在比较不同植被覆盖、土地利用类型和退耕年限的土壤抗蚀性,缺乏对同一植被类型不同林分密度下的研究。林分密度是指单位面积上林木的株数,它决定了林分的空间结构[11],是人工林营造及抚育中的可控因子,对森林生态系统的稳定性和水土保持功能的发挥有重要影响。林分密度通过改变光、水、肥、热等环境因子的分配改变林下生境,对林下灌草植物的种类、数量、分布和枯落物的数量、质量产生影响,造成土壤结构和理化性质的差异[12-13],进而影响土壤抗蚀性。
为减轻水土流失、保护和改善生态环境,晋西黄土区自1992年开始实施退耕还林工程。刺槐是该区植被恢复重建的主要树种,在防治水土流失方面发挥了重要作用。但在退耕还林过程中未充分考虑林分密度的动态变化,出现了林分密度不合理、植被生长缓慢、水土保持功能低下等问题。故研究不同密度刺槐林土壤抗蚀性及其关键评价指标可以更好地了解当前林分密度的合理性,并尝试从土壤抗蚀性角度,提出该区刺槐林经营的适宜密度,为改善林分结构、实现水土保持功能导向型林分结构定向调控提供理论依据。
1. 研究区概况
研究区位于山西吉县蔡家川流域(110°39′45″ ~ 110°47′45″E,36°14′27″ ~ 36°18′23″N)。该流域地势西高东低,海拔分布在800 ~ 1 600 m,面积为39 km2,属于黄土残塬沟壑区。气候为暖温带大陆性季风气候,年均气温10 ℃,年均降水量575.9 mm,年均蒸发量1 729 mm,无霜期172 d。土壤类型为碳酸盐褐土,呈微碱性,黄土母质,土层深厚且质地均匀。蔡家川流域内林分结构简单,以纯林为主,刺槐(Robinia pseudoacacia)作为主要造林树种,在此广泛分布,其成林密度在500 ~ 3 500株/hm2之间。刺槐林下植被种类丰富,长势良好,灌木植物主要有黄刺玫(Rosa xanthina)、杠柳(Periploca sepium)、茅莓(Rubus parvifolius)等;草本植物以虉草(Phalaris arundinacea)、苔草(Carex tristachya)、黑麦草(Lolium perenne)等为主。
2. 试验方法
2.1 样地设置
以代表性和典型性为原则,在蔡家川流域选取林龄相同(16年生)、地理位置相对集中、立地条件相似但密度不同的刺槐林布设标准样地,面积为20 m × 20 m,林分密度分别为1 025、1 300、1 575、1 800、2 150株/hm2,在样地内进行林分调查,并记录海拔、坡度、坡向等立地条件指标。样地基本特征见表1。
表 1 样地基本特征Table 1. Basic characteristics of sample plots林分密度/(株·hm−2)
Stand density/(tree·ha−1)地理位置
Geographical position海拔
Altitude/m坡度
Slope/(°)坡向
Slope aspect1 025 110°45′45″E 36°12′21″N 1 130 17 阳坡
Sunny slope1 300 110°45′46″E 36°15′59″N 1 100 23 半阴坡
Semi-shady slope1 575 110°46′13″E 36°16′13″N 1 135 20 半阳坡
Semi-sunny slope1 800 110°46′08″E 36°16′31″N 1 070 22 半阳坡
Semi-sunny slope2 150 110°46′12″E 36°16′33″N 1 145 25 半阳坡
Semi-sunny slope2.2 样地调查
在样地内对刺槐乔木进行每木检尺,记录其胸径、树高和冠幅,并采取样点法对林分郁闭度进行估测。在每个样地中心和4角共设置5个灌木样方,面积为5 m × 5 m,在每个灌木样方内设置1个草本样方,面积为1 m × 1 m,调查所有灌木和草本样方内的植物种类、株(丛)数和盖度,同时采用物种丰富度指数、多样性指数和均匀度指数来表征不同密度刺槐林下植被的生长状况,计算方法如下:
物种丰富度Patrick指数=样方内物种数目 (1) Simpson多样性指数:D=1−∑Ni=1p2i (2) Shannon-Wiener多样性指数:H=−∑Ni=1pilnpi (3) Pielou均匀度指数:J=HlnN (4) 式中:N为样方内物种数量;pi为物种相对重要值(相对多度、相对频度与相对盖度的平均值)。
在每个样地坡上、坡中和坡下3个位置分别布设1个30 cm × 30 cm的枯落物样方,在保持枯落物原有结构的情况下,将其带回室内连续烘干12 h后称其质量作为干质量,用单位面积枯落物的干质量表示蓄积量:
M=GS×100 (5) 式中:M为枯落物蓄积量(t/hm2);G为枯落物干质量(g);S为单个样方面积(cm2)。
样地调查结果见表2。
表 2 样地调查结果Table 2. Sample plot survey results林分密度/(株·hm−2) Stand
density/(tree·ha−1)平均胸径 Mean DBH/
cm平均树高 Average tree height/
m平均冠幅
Average crown width/m2郁闭度
Canopy density物种丰富度Patrick指数
Species richness Patrick indexSimpson多样性指数
Simpson diversity indexShannon-Wiener 多样性指数
Shannon-Wiener diversity indexPielou均匀度指数
Pielou evenness index枯落物蓄积量/(t·hm−2)
Volume of litter/(t·ha−1)灌木
Shrub草本 Herb 灌木
Shrub草本 Herb 灌木
Shrub草本 Herb 灌木
Shrub草本 Herb 1 025 11.90 9.48 7.64 0.47 6 8 0.738 0.759 1.501 1.656 0.837 0.796 3.02 1 300 10.69 9.25 6.80 0.55 10 9 0.813 0.811 1.907 1.872 0.828 0.852 4.40 1 575 12.26 10.24 6.25 0.60 10 14 0.872 0.839 2.150 2.169 0.934 0.822 7.65 1 800 11.05 9.73 6.15 0.63 8 12 0.852 0.827 1.990 2.026 0.957 0.815 6.23 2 150 9.31 8.22 5.75 0.70 9 14 0.805 0.819 1.794 2.088 0.816 0.791 6.42 2.3 样品采集及测定
每个样地内沿对角线布设3个土壤采样点,按0 ~ 10 cm、10 ~ 20 cm、20 ~ 30 cm分3层挖土壤剖面采集样品。用环刀取原状土,采用环刀浸水法测定土壤密度;用木制工具采集原状土装入自封袋,将各采样点原状土充分混合后,用四分法取出足量样品,除去砾石和植物根系,带回实验室自然风干,用于测定土壤有机质、团聚体、机械组成和微团聚体指标。采用重铬酸钾外加热氧化法测定土壤有机质含量;采用干筛、湿筛方法利用8411型电动振筛机和XY-100型土壤团聚体分析仪测定土壤团聚体;利用Malvern 3000激光粒度分析仪测定土壤机械组成;采用吸管法测定土壤微团聚体。
2.4 土壤抗蚀性指标的选取及计算方法
本文根据土壤抗蚀性的研究现状,参考前人研究结果[5,14-15],选取5大类、12个土壤抗蚀性指标(表3)进行研究,计算方法如下[15]。
表 3 土壤抗蚀性指标Table 3. Soil anti-erodibility indexes土壤力学相关类Related categories of
soil mechanics有机胶体类
Organic colloids水稳性团聚体类
Water-stable aggregate无机黏粒类
Inorganic clay微团聚体类
Micro aggregates土壤密度
Soil bulk density有机质含量
Organic matter content> 0.25 mm水稳性团聚体质量分数Mass fraction of > 0.25 mm water-stable aggregates < 0.05 mm粉黏粒质量分数
Mass fraction of < 0.05 mm silt clay团聚度
Soil aggregation degree> 0.25 mm团聚体破坏率Destruction rate of > 0.25 mm aggregates < 0.01 mm物理性黏粒质量分数
Mass fraction of < 0.01 mm physical clay分散系数
Soil dispersion coefficient平均质量直径
Mean mass diameter< 0.002 mm黏粒质量分数
Mass fraction of < 0.002 mm clay几何平均直径
Geometric mean diameter土壤分形维数
Soil fractal dimension (D)WSA=∑ni=1mim×100% (6) 式中:WSA表示 > 0.25 mm水稳性团聚体质量分数;i为土壤团聚体的级数,i = 1,2,···,n;mi为第i级土壤团聚体质量(g);m为土壤团聚体总质量(g)。
PAD=Md−MwMd×100% (7) 式中:PAD表示 > 25 mm团聚体破坏率;Md为 > 0.25 mm干筛团聚体质量比例(%);Mw为 > 0.25 mm湿筛团聚体质量比例(%)。
MMD=∑niwidi (8) GMD=exp(∑niwilndi∑niw) (9) 式中:MMD表示平均质量直径;GMD表示几何平均直径;wi为第i级土壤团聚体质量分数(%);di为相邻两粒级土壤团聚体的平均直径(mm)。
土壤分形维数D运用分形理论通过建立土壤团粒结构的分形模型从而计算得出[16]。
(didmax (10) 式中:di为相邻两粒级土壤团聚体的平均直径(mm);dmax为团聚体的最大直径(mm);mi为粒径小于di的累积土壤团聚体质量(g);mmax为各粒级土壤团聚体质量的总和(g);D为分形维数,由回归分析得到。
{\text{SAD}} = \dfrac{{{W_{0.05}} - {X_{0.05}}}}{{{W_{0.05}}}} \times 100\% (11) 式中:SAD为团聚度;W0.05为 > 0.05 mm微团聚体质量分数(%);X0.05为土壤机械组成中 > 0.05 mm颗粒质量分数(%)。
{\text{SDC}} = \frac{{{W_{0.01}}}}{{{X_{0.01}}}} \times 100\% (12) 式中:SDC为分散系数;W0.01为 < 0.01 mm微团聚体质量分数(%);X0.01为土壤机械组成中 < 0.01 mm颗粒质量分数(%)。
3. 结果与分析
3.1 土壤抗蚀性指标单独分析
3.1.1 土壤密度与有机质
土壤密度代表土壤的紧实程度,土壤密度越小,土质越疏松,孔性越好,通气透水性越强[17-18],对增强土壤抗蚀性有积极的影响。各刺槐林样地中,土壤密度随土层的加深呈递增趋势,0 ~ 10 cm土层内密度较小,平均值为1.10 g/cm3。不同密度条件下刺槐林的土壤密度差异显著(P < 0.05),随林分密度的增大密度表现为先减后增,在密度为1 575株/hm2时达到最低(0 ~ 10 cm:1.03 g/cm3;10 ~ 20 cm:1.10 g/cm3;20 ~ 30 cm:1.16 g/cm3)(图1)。土壤有机质作为胶结源可促进土壤团粒结构的形成,增强土壤结构的稳定性,从而提高土壤抗蚀性[18]。各样地中,土壤有机质含量在垂直分布上存在显著差异(P < 0.05),随土层的加深呈递减趋势,0 ~ 10 cm土层内有机质含量较高,平均值为14.12 g/kg。0 ~ 30 cm土层内不同密度刺槐林土壤有机质含量表现为1 575株/hm2(10.64 g/kg) > 2 150株/hm2(10.12 g/kg) > 1 800株/hm2(9.98 g/kg) > 1 300株/hm2(9.39 g/kg) > 1 025株/hm2(8.28 g/kg),表明有机质含量在不同林分密度条件下也存在显著差异(P < 0.05)。当刺槐林分密度为1 575株/hm2时,土壤密度较小,有机质含量较高,说明在该密度条件下刺槐林对土壤的改良作用较强,且表层土壤的质地要优于深层土壤。
![]() 图 1 不同密度刺槐林土壤密度与有机质含量不同大写字母表示同一林分密度不同土层间变量差异显著(P < 0.05);不同小写字母表示同一土层不同林分密度下变量差异显著(P < 0.05)。下同。Different uppercase letters indicate significant differences in variables between varied soil layers of the same stand density (P < 0.05); different lowercase letters indicate significant differences in variables under varied stand densities of the same soil layer (P < 0.05). The same below.Figure 1. Soil density and organic matter content of Robinia pseudoacacia forest with different densities
图 1 不同密度刺槐林土壤密度与有机质含量不同大写字母表示同一林分密度不同土层间变量差异显著(P < 0.05);不同小写字母表示同一土层不同林分密度下变量差异显著(P < 0.05)。下同。Different uppercase letters indicate significant differences in variables between varied soil layers of the same stand density (P < 0.05); different lowercase letters indicate significant differences in variables under varied stand densities of the same soil layer (P < 0.05). The same below.Figure 1. Soil density and organic matter content of Robinia pseudoacacia forest with different densities3.1.2 土壤团聚体
(1)土壤团聚体分布特征
如图2所示,干筛时,各刺槐林样地土壤团聚体集中分布在2 ~ 5 mm粒径范围内,质量分数几乎达到30%以上;在0.25 ~ 0.5 mm内最少,质量分数平均值为9.84%;在 < 0.25 mm、0.5 ~ 1 mm、1 ~ 2 mm和 > 5 mm粒径范围内土壤团聚体分布类似,质量分数基本介于10% ~ 16%。湿筛后,各刺槐林样地土壤团聚体粒径分布均发生变化,主要分布在 < 0.25 mm粒径范围内,质量分数为33.72% ~ 41.54%。相比干筛时,大部分粒径质量分数明显减少, > 5 mm土壤团聚体平均损失为67.70%,2 ~ 5 mm为37.72%,1 ~ 2 mm为29.55%,只有 < 0.25 mm土壤团聚体显著增加,可见非水稳性团聚体遇水后多分散成 < 0.25 mm土壤颗粒,这种颗粒极易堵塞土壤孔隙,导致水分难以下渗,从而增加地表径流,造成水土流失。
![]() 图 2 干筛和湿筛条件下各密度刺槐林土壤团聚体分布特征Figure 2. Distribution characteristics of soil aggregates under dry and wet sieving
图 2 干筛和湿筛条件下各密度刺槐林土壤团聚体分布特征Figure 2. Distribution characteristics of soil aggregates under dry and wet sieving(2)土壤团聚体稳定性特征
湿筛后得到的是土壤水稳性团聚体,它是一种有机−无机物质的土壤复合体,由有机质胶结而成[18]。水稳性团聚体浸水后不易分散,稳定性较高,因此其质量分数和稳定性是评价土壤抗蚀性的重要指标。
由表4可知,各刺槐林样地中,> 0.25 mm水稳性团聚体质量分数随土层的加深逐渐降低,同一土层内,随林分密度的增大,> 0.25 mm水稳性团聚体质量分数表现为先增后减,且存在显著差异(P < 0.05),0 ~ 30 cm土层内其值在林分密度为1 575 株/hm2时最大(63.89%)。团聚体破坏率可反映土壤团聚体遇水后的破坏程度,其值越小越好[15]。各样地中,> 0.25 mm团聚体破坏率在土壤的垂直梯度上无明显变化规律,但随林分密度的增大呈先降低后升高的变化规律,0 ~ 30 cm土层内密度为1 575 株/hm2的刺槐林 > 0.25 mm团聚体破坏率最低(25.62%)。平均质量直径和几何平均直径能较好地反映土壤团聚体的稳定性特征,其值越大,团聚体的团聚度越高,稳定性越强[19]。各刺槐林样地中,平均质量直径和几何平均直径在土壤的垂直分布上具有一致性,均随土层的加深呈递减趋势,0 ~ 10 cm土层稳定性最好。0 ~ 30 cm土层内平均重量直径和几何平均直径均表现为密度为1 800 株/hm2的刺槐林最大(1.45 mm、1.60 mm),其次为密度为1 575株/hm2的刺槐林(1.41 mm、1.45 mm)。在一定程度上,土壤分形维数能反映土壤质量的好坏,其值越小,土壤的结构和稳定性越好[20]。各样地中土壤分形维数的变化范围较小(2.64 ~ 2.71),0 ~ 10 cm土层的分形维数最小,之后随土层的加深呈递增趋势。不同密度条件下刺槐林的土壤分形维数存在显著差异(P < 0.05),且随林分密度的增大表现为先减后增,0 ~ 30 cm土层内其值在密度为1 575株/hm2时达到最小(2.66)。
表 4 不同密度刺槐林土壤水稳性团聚体指标Table 4. Indicators of soil water-stabilized aggregates in different densities of Robinia pseudoacacia林分密度/(株·hm−2)
Stand density/(tree·ha−1)土层深度Soil
depth/cm> 0.25 mm水稳性团聚体质量分数 Mass fraction of > 0.25 mm water-stable aggregates/% > 0.25 mm团聚体破坏率 Destruction rate of > 0.25 mm aggregates/% 平均质量直径 Mean mass diameter/mm 几何平均直径
Geometric mean diameter/mm土壤分形维数
Soil fractal dimension (D)1 025 0 ~ 10 61.42Ab 30.38Aa 1.55Aa 1.70Aa 2.68Ba 10 ~ 20 60.41Ab 30.50Aa 1.40Aa 1.52ABa 2.69ABa 20 ~ 30 58.46Aa 31.06Aa 1.17ABb 1.31Bab 2.71Aa 0 ~ 30 60.10Ab 30.64Aa 1.37Aa 1.51Aa 2.69ABa 1 300 0 ~ 10 66.28Aa 26.34Ab 1.50Aa 1.48Aab 2.64Bb 10 ~ 20 63.04ABab 27.99Aab 1.37Aa 1.41Aa 2.67ABab 20 ~ 30 60.26Ba 28.29Aab 1.31Aa 1.39Aa 2.69Aa 0 ~ 30 63.19ABa 27.54Ab 1.40Aa 1.43Aa 2.67ABab 1 575 0 ~ 10 66.13Aa 25.65Ab 1.50Aa 1.50Aa 2.64Bb 10 ~ 20 64.67Aa 24.60Ab 1.42Aa 1.45Aa 2.65Bb 20 ~ 30 60.86Ba 26.61Ab 1.30Aa 1.40Aa 2.69Aa 0 ~ 30 63.89Aa 25.62Ab 1.41Aa 1.45Aa 2.66Bb 1 800 0 ~ 10 63.62Aab 29.15Aa 1.53Aa 1.63Aa 2.66Bab 10 ~ 20 60.94ABb 29.78Aa 1.43Aa 1.59Aa 2.69ABa 20 ~ 30 59.68Ba 28.22Aab 1.39Aa 1.59Aa 2.70Aa 0 ~ 30 61.41Aab 29.05Aab 1.45Aa 1.60Aa 2.68ABab 2 150 0 ~ 10 61.99Ab 30.79Aa 1.43Aa 1.52Aa 2.68Aa 10 ~ 20 60.74Ab 30.38Aa 1.35Aa 1.45Aa 2.69Aa 20 ~ 30 59.27Aa 30.05Aa 1.26Aa 1.37Aa 2.70Aa 0 ~ 30 60.66Ab 30.41Aa 1.35Aa 1.45Aa 2.69Aa 3.1.3 土壤机械组成与微团聚体
如图3所示,各刺槐林样地中,土壤机械组成和微团聚体组成大致相同,且粒径分布相似,均以0.01 ~ 0.05 mm粗粉粒为主,质量分数平均值分别为63.46%、42.71%;在 < 0.002 mm颗粒范围内占比最少,仅占2.37%、1.20%。
![]() 图 3 不同密度刺槐林土壤机械组成和微团聚体组成Figure 3. Soil mechanical composition and microaggregates of Robinia pseudoacacia with different densities
图 3 不同密度刺槐林土壤机械组成和微团聚体组成Figure 3. Soil mechanical composition and microaggregates of Robinia pseudoacacia with different densities团聚度表示土壤颗粒的团聚程度,分散系数表示土壤的分散性,二者与土壤抗蚀性密切相关[21]。通常团聚度越大,分散系数越小,土壤抗蚀性越强。由表5可知,各刺槐林样地中,随土层的加深土壤团聚度基本呈递减趋势,而分散系数则逐层递增,表层(0 ~ 10 cm)土壤团聚度较大,分散系数较小,抗蚀性较强。不同密度刺槐林土壤团聚度和分散系数差异显著(P < 0.05),在0 ~ 30 cm土层内团聚度表现为1 575株/hm2 > 2 150株/hm2 > 1 025株/hm2 > 1 800株/hm2 > 1 300株/hm2,分散系数表现为1 300株/hm2 < 1 575株/hm2 < 1 800株/hm2 < 2 150株/hm2 < 1 025株/hm2。
表 5 不同密度刺槐林土壤团聚度和分散系数Table 5. Soil aggregation degree and dispersion coefficient of Robinia pseudoacacia with different densities林分密度/(株·hm−2)
Stand density/(tree·ha−1)土层深度
Soil depth/cm团聚度
Soil aggregation degree/%分散系数
Soil dispersion coefficient/%1 025 0 ~ 10 38.12Ab 50.21Ba 10 ~ 20 38.06Aab 54.07Ba 20 ~ 30 37.76Ab 59.33Aa 0 ~ 30 37.98Aab 54.54Ba 1 300 0 ~ 10 37.88Ab 43.71Bb 10 ~ 20 36.38ABb 46.77Bb 20 ~ 30 35.75Bc 53.16Ab 0 ~ 30 36.67ABb 47.88Bb 1 575 0 ~ 10 41.74Aa 43.86Bb 10 ~ 20 39.93Aa 47.27ABb 20 ~ 30 36.98Bbc 52.69Ab 0 ~ 30 39.55Aa 47.94ABb 1 800 0 ~ 10 37.79Ab 46.25Bab 10 ~ 20 37.02Ab 49.62Bab 20 ~ 30 36.96Abc 54.94Ab 0 ~ 30 37.13Aab 50.27ABab 2 150 0 ~ 10 37.72Bb 48.71Ba 10 ~ 20 37.00Bb 52.79Ba 20 ~ 30 39.44Aa 57.84Aab 0 ~ 30 38.05ABa 53.11ABa 3.2 不同密度刺槐林土壤抗蚀性综合评价
3.2.1 土壤抗蚀性指标的选定
对以上5大类、12个土壤抗蚀性指标进行主成分分析,结果见表6。12个指标可概括为3个独立的主成分(Y1、Y2、Y3),特征值均大于1,累计贡献率达84.382%,基本可以反映晋西黄土区刺槐林(16年生)土壤抗蚀性的变异信息。其中Y1的贡献率最大(40.596%),对土壤抗蚀性的影响较强,Y1主要综合了土壤密度、有机质含量、 > 0.25 mm水稳性团聚体质量分数、平均质量直径、几何平均直径、土壤分形维数和分散系数的变异信息,因子载荷量绝对值均大于0.5,其中土壤密度、分形维数和分散系数对Y1有逆向效应,其值越大,Y1越小,土壤抗蚀性越弱。Y2主要由土壤机械组成和 > 0.25 mm团聚体破坏率决定,贡献率为32.123%。Y3的贡献率为11.662%,主要由团聚度决定,载荷量为0.947。根据各指标对主成分的贡献,可以确定评价晋西黄土区刺槐林(16年生)土壤抗蚀性的关键指标为土壤密度、有机质含量、> 0.25 mm水稳性团聚体质量分数、平均质量直径、几何平均直径、土壤分形维数和分散系数。
表 6 土壤抗蚀性指标PCA分析Table 6. Principal component analysis for soil anti-erodibility indexes土壤抗蚀性指标
Soil anti-erodibility index主成分
Principal componentY1 Y2 Y3 土壤密度 Soil bulk density −0.776 −0.369 −0.136 有机质含量 Organic matter content 0.864 0.068 0.259 > 0.25 mm水稳性团聚体质量分数 Mass fraction of > 0.25 mm water-stable aggregates 0.747 0.514 0.344 > 0.25 mm团聚体破坏率Destruction rate of > 0.25 mm aggregates −0.285 −0.754 −0.267 平均质量直径 Mean mass diameter 0.960 −0.003 0.036 几何平均直径
Geometric mean diameter0.779 −0.416 −0.176 土壤分形维数
Soil fractal dimension (D)−0.736 −0.518 −0.358 < 0.05 mm粉黏粒质量分数
Mass fraction of < 0.05 mm silt clay0.062 0.888 0.000 < 0.01 mm物理性黏粒质量分数
Mass fraction of < 0.01 mm physical clay0.093 0.786 0.219 < 0.002 mm黏粒质量分数
Mass fraction of < 0.002 mm clay0.079 0.932 −0.083 团聚度 Soil aggregation degree 0.178 0.101 0.947 分散系数 Soil dispersion coefficient −0.873 −0.396 −0.114 特征值 Characteristic value 4.872 3.855 1.399 贡献率 Contribution rate/% 40.596 32.123 11.662 累计贡献率
Cumulative contribution rate/%40.596 72.720 84.382 注:Y1、Y2、Y3表示12个土壤抗蚀性指标经主成分分析后得到的3个主成分。Notes: Y1, Y2, Y3 represent the three principal components of 12 soil erosion resistance indexes obtained through principal component analysis. 3.2.2 土壤抗蚀性综合评价
根据主成分Y1、Y2、Y3的特征值及因子载荷矩阵进行相关运算,得到研究区刺槐林(16年生)土壤抗蚀性的综合表达式如下,以此计算出不同密度刺槐林土壤抗蚀性综合指数并进行排序(表7)。
表 7 不同密度刺槐林土壤抗蚀性综合评价Table 7. Comprehensive evaluation of soil anti-erodibility with different densities of Robinia pseudoacacia林分密度/(株·hm−2)
Stand density/(tree·ha−1)土层深度
Soil depth/cm得分 Score 排序
OrderY1 Y2 Y3 Y 0 ~ 30 cm Y平均值Y average value in 0 − 30 cm 1 025 0 ~ 10 1.070 −1.224 −0.195 0.022 −0.553 5 10 ~ 20 −0.532 −0.482 −0.018 −0.442 20 ~ 30 −1.934 −1.121 0.851 −1.240 1 300 0 ~ 10 1.075 1.497 −0.170 1.064 0.343 2 10 ~ 20 0.118 0.421 −0.785 0.109 20 ~ 30 −0.792 1.159 −1.464 −0.142 1 575 0 ~ 10 0.968 0.807 2.301 1.091 0.590 1 10 ~ 20 0.259 0.675 1.434 0.580 20 ~ 30 −0.846 1.615 −0.787 0.099 1 800 0 ~ 10 1.250 0.0371 −0.542 0.541 −0.060 3 10 ~ 20 0.503 −0.820 −0.846 −0.187 20 ~ 30 −0.003 −1.166 −0.650 −0.535 2 150 0 ~ 10 0.916 −1.170 0.178 0.020 −0.320 4 10 ~ 20 −0.500 −0.346 −0.278 −0.411 20 ~ 30 −1.552 0.118 0.970 −0.568 Y=0.481\;1Y_{1} + 0.380\;7Y_{2} + 0.138\;2Y_{3} (13) 各刺槐林样地中,土壤抗蚀性随土层的加深逐渐减弱,0 ~ 10 cm土层土壤抗蚀性最强,具体表现为1 575株/hm2 > 1 300株/hm2 > 1 800株/hm2 > 1 025株/hm2 > 2 150株/hm2;10 ~ 20 cm和20 ~ 30 cm土层内土壤抗蚀性表现为1 575株/hm2 > 1 300株/hm2 > 1 800株/hm2 > 2 150株/hm2 > 1 025株/hm2。综合3个土层的土壤抗蚀性情况,可认为随刺槐林分密度增大(1 025 ~ 1 575株/hm2),土壤抗蚀性逐渐增强,在密度大于1 575株/hm2后有减弱的趋势。
以刺槐林分密度为x轴,以土壤抗蚀性综合指数为y轴建立函数关系,方便从土壤抗蚀性角度预测研究区刺槐林(16年生)的最佳林分密度。如图4所示,二者具有开口向下的抛物线函数关系。
![]() 图 4 刺槐林分密度与土壤抗蚀性综合指数的函数关系Figure 4. Functional relationships between stand density and soil erosion resistance index of Robinia pseudoacacia
图 4 刺槐林分密度与土壤抗蚀性综合指数的函数关系Figure 4. Functional relationships between stand density and soil erosion resistance index of Robinia pseudoacaciay = - 2.683 \times {10^{ - 6}}{x^2} + 0.009x - 6.375({R^2} = 0.77) (14) 对该函数求解发现:当刺槐林分密度为1 590株/hm2时,土壤抗蚀性最强,综合指数为0.403。因此从土壤抗蚀性角度,建议今后研究区林龄为16年生刺槐林的经营密度以1 590株/hm2为宜。
4. 讨 论
土壤抗蚀性作为评估土壤抵抗侵蚀营力的重要参数,其强弱主要取决于土壤对水的亲和力及土粒间的胶合力[22],但同时又受理化性质、植被覆盖、人为活动等多种因素的影响[4],截至目前尚未确定普遍适用的评价指标。本研究结果表明:土壤密度、有机质含量、 > 0.25 mm水稳性团聚体质量分数、平均质量直径、几何平均直径、土壤分形维数和分散系数7个指标对土壤抗蚀性的影响最明显,是表征晋西黄土区刺槐林(16年生)土壤抗蚀性的关键指标。但马西军[23]同在晋西黄土区的研究发现,评价该区不同类型坡面土壤抗蚀性强弱的最佳指标是团聚度、有机质含量、土壤分形维数、< 0.001 mm黏粒质量分数和抗蚀指数。这与本研究结果相似,但不完全一致,主要因为研究对象存在明显差异,本文研究对象为刺槐纯林(16年生)。
由于气候、枯落物、植物根系等综合作用,土壤理化性质在垂直分布上存在差异,进而对不同深度土壤抗蚀性产生影响。本研究发现:刺槐林土壤抗蚀性随土层加深逐渐减弱,表层土壤抗蚀性优于深层。表层土壤首先受到枯落物的保护和改良作用,枯落物直接覆盖于土壤表面,有效保护土壤抵抗以水力为主的机械破坏;同时经微生物分解腐化作用,枯落物可在地表形成高度松散的腐殖质层[24],增加了土壤有机质含量,从而增强土壤抗蚀性。其次,草本植物在表层土壤形成了密集的根系网络,根系及根系分泌物不仅向土壤中输送了大量的有机质,还通过缠绕固结作用促进了土壤团粒结构的形成,提高了土壤稳定性[25]。还有研究表明,表层土壤的黏粒在水土流失过程中更易散失,促使黏粒向下淋溶,增加了深层土壤中黏粒质量分数,而过量的黏粒会堵塞土壤孔隙,导致水分难以下渗,形成地表径流,从而加剧土壤侵蚀[26]。综上所述,深层土壤无法得到和表层土壤相同的保护、改良作用,所以土壤抗蚀性较弱,更易被侵蚀,如果表层土壤被破坏,将会造成更严重的水土流失,因此在生产活动中要注意保护表层土壤。
同一植被类型不同密度条件下土壤抗蚀性有显著差异。吕刚等[14]对荆条的研究和李萍[27]对松嫩草地的研究均表明,植被密度越大,土壤抗蚀性越强。本研究中,随刺槐林分密度的增大(1 025 ~ 1 575株/hm2),土壤抗蚀性逐渐增强,在密度大于1 575株/hm2后减弱,这与上述研究结论类似,但不完全相同,可能与研究区气候、土壤、植被条件有关。林分密度是影响林木生长发育的重要限制因子,它通过调节光、水、肥、热等环境资源的配置改变林内微环境,影响着下层植物群落的结构和组成,关系到枯落物的数量与质量,从而对土壤结构和养分输入产生影响[28],导致土壤抗蚀性出现差异。调查显示(表2),随刺槐林分密度增大,其林下灌草群落的物种丰富度指数、多样性指数、均匀度指数和枯落物蓄积量基本呈先增后减的变化趋势,并几乎都在密度为1 575株/hm2时达到峰值,这种趋势与土壤抗蚀性的表现一致,故可以以此解释不同密度刺槐林土壤抗蚀性存在的差异。当林分密度较低时,刺槐稀疏分布,郁闭度较低,林内光照充足有利于阳生植物的萌发,促进其繁衍生息,但此时物种结构较为单一,多样性水平较低,限制了枯落物的积累,植物根系网络也不够发达,导致土壤养分匮乏,结构不稳定,削弱了土壤抗蚀性。随林分密度增大,刺槐林内郁闭增强、光照减少、温度下降,为许多中生、阴生植物创造了有利生态位,使其迁入栖息,丰富了林下灌草植物组成,有利于地上枯落物的积累和地下根系网络的发展,可有效改善土壤质地,促进团粒结构的形成,增强其抗蚀性。但当林分密度持续增大,林内光照条件变差,制约了植物幼树和幼苗的生长发育,同时种间和种内竞争加剧,刺槐枝条出现“自疏”现象,一些灌草植物逐渐被淘汰,降低了物种多样性,使枯落物蓄积量减少[29],土壤养分含量下降,抗蚀性减弱。而适宜的中密度林分能维持较多植物种类平衡共存[30],林下灌草种类丰富、多样性较高且分布更加均匀,植被更新和演替能力较强,整体功能较为稳定,有利于土壤抵抗外力侵蚀。此外,林龄和海拔、坡度、坡向等立地因子对土壤抗蚀性也有一定影响,需进一步综合考虑。
5. 结 论
(1)通过主成分分析可知,土壤密度、有机质含量、> 0.25 mm水稳性团聚体质量分数、平均质量直径、几何平均直径、土壤分形维数和分散系数7个指标对土壤抗蚀性的影响最明显,是评价晋西黄土区刺槐林(16年生)土壤抗蚀性强弱的关键指标。
(2)研究区刺槐林表层土壤抗蚀性优于深层土壤。0 ~ 30 cm土层内,随刺槐林分密度的增大(1 025 ~ 1 575株/hm2),土壤抗蚀性逐渐增强,在密度大于1 575株/hm2后逐渐减弱,适宜的中密度刺槐林分土壤抗蚀性较强。
(3)刺槐林分密度(x)与土壤抗蚀性综合指数(y)具有开口向下的抛物线函数关系:y = −2.683 × 10−6x2 + 0.009x − 6.375(R2 = 0.77)据此预测刺槐林分密度为1 590 株/hm2时,土壤抗蚀性最强,综合指数为0.403。因此从土壤抗蚀性角度,建议今后研究区刺槐林(16年生)的经营密度以1 590株/hm2为宜,对于密度过低或过高的林分,在满足林业生产的同时及时进行科学补植或间伐,还应注意保护表层土壤,以充分发挥林地的水土保持功能,有效控制土壤侵蚀。
-
![]()
图 1 白桦、山杨、兴安落叶松和樟子松根系分解率变化
不同小写字母表示相同分解天数不同根系径级之间差异显著(P < 0.05)。下同。Different lowercase letters indicate significant differences between varied root diameter classes with the same decomposition days (P < 0.05). The same below.
Figure 1. Changes in root decomposition rate of Betula platyphylla, Populus davidiana, Larix gmelinii and Pinus sylvestris var. mongolica
![]()
图 2 白桦、山杨、兴安落叶松和樟子松根系碳保持率变化
Figure 2. Changes in C remaining rate of Betula platyphylla, Populus davidiana, Larix gmelinii and Pinus sylvestris var. mongolica
![]()
图 3 白桦、山杨、兴安落叶松和樟子松根系氮保持率变化
Figure 3. Changes in N remaining rate of Betula platyphylla, Populus davidiana, Larix gmelinii and Pinus sylvestris var. mongolica
表 1 4种林型样地基本概况
Table 1 Basic information of four types of forest sample plots
林型
Forest type地理位置
Geographical location海拔
Elevation/m平均树高
Mean tree height/m平均胸径
Mean DBH/cm郁闭度
Canopy density林龄/a
Forest age/year土壤密度
Soil density/
(g·cm−3)总碳 Total carbon/
(g·kg−1)总氮 Total nitrogen/
(g·kg−1)兴安落叶松林
Larix gmelinii forest53°28′N, 122°21′E 300 17.43 ± 6.80 15.20 ± 5.40 0.7 86 ± 8 0.98 ± 0.15 25.50 ± 2.11 1.41 ± 0.15 樟子松林
Pinus sylvestris var. mongolica forest53°24′N, 122°15′E 520 22.18 ± 5.50 23.19 ± 5.80 0.6 97 ± 12 1.01 ± 0.18 19.97 ± 1.84 1.15 ± 0.22 白桦林
Betula platyphylla forest53°25′N, 122°11′E 430 14.67 ± 3.90 12.28 ± 5.20 0.8 43 ± 5 1.07 ± 0.21 22.70 ± 2.41 1.17 ± 0.32 山杨林
Populus davidiana forest53°25′N, 122°14′E 630 18.74 ± 4.30 13.80 ± 4.80 0.8 41 ± 6 1.03 ± 0.08 20.25 ± 1.42 1.21 ± 0.26 注:树高、胸径、林龄、土壤密度、TC和TN的数据为平均值 ± 标准差。Notes: data of tree height, DBH, forest age, soil density, TC and TN are average ± standard deviation.  下载: 导出CSV
表 3 4个主要乔木树种不同径级根系年分解系数
Table 3 Annual decomposition coefficients of root systems of four main tree species with different diameter classes
树种
Tree species直径
Diameter/mm年分解系数
Annual decomposition
coefficientR2 分解50%的时间/a
Time for decomposing 50%
part/year分解95%的时间/a
Time for decomposing 95%
part/year≤ 2 0.508 5aA 0.785 8 1.36 5.89 白桦 Betula platyphylla 2 ~ 5 0.415 2bA 0.671 1 1.67 7.22 5 ~ 10 0.317 8cB 0.823 0 2.18 9.43 ≤ 2 0.496 0aA 0.648 1 1.40 6.04 山杨 Populus davidiana 2 ~ 5 0.458 3aA 0.773 4 1.51 6.54 5 ~ 10 0.444 1aA 0.845 4 1.56 6.75 ≤ 2 0.326 6aB 0.768 1 2.12 9.17 兴安落叶松 Larix gmelinii 2 ~ 5 0.261 0bB 0.769 0 2.66 11.48 5 ~ 10 0.196 6cC 0.809 4 3.53 15.24 ≤ 2 0.311 9aB 0.833 7 2.22 9.60 樟子松
Pinus sylvestris var. mongolica2 ~ 5 0.241 3bB 0.809 0 2.87 12.41 5 ~ 10 0.202 3bC 0.802 9 3.43 14.81 注:表中数据为平均值 ± 标准误,小写字母表示同一树种不同径级,大写字母表示同一径级不同树种,相同字母表示差异不显著(P > 0.05),不同字母表示差异显著(P < 0.05)。Notes: the values in the table are the average ± standard error, lowercase letters indicate different diameter classes of the same tree species, capital letters indicate different tree species of the same diameter class, same letter indicates insignificant difference (P > 0.05), different letters indicate significant differences (P < 0.05).
下载: 导出CSV
表 4 4个主要乔木树种不同径级根系养分元素初始含量
Table 4 Initial nutrient concent in different diameter class roots of four tree species
树种
Tree species直径
Diameter/mmC/
(mg·g−1)N/
(mg·g−1)C/N 白桦 Betula platyphylla ≤ 2 435.97 ± 8.01aD 4.77 ± 0.05aB 91.41 ± 0.90cC 2 ~ 5 421.40 ± 0.64bD 4.06 ± 0.14bA 103.92 ± 3.60bC 5 ~ 10 420.79 ± 6.19bB 3.57 ± 0.04cB 118.04 ± 1.47aC 山杨 Populus davidiana ≤ 2 432.02 ± 2.95aC 5.13 ± 0.06aA 84.23 ± 0.85cD 2 ~ 5 426.78 ± 6.69aC 4.16 ± 0.04bA 102.65 ± 1.20bC 5 ~ 10 417.05 ± 15.29bB 3.74 ± 0.14cA 111.73 ± 5.86aC 兴安落叶松 Larix gmelinii ≤ 2 443.95 ± 5.93bB 4.37 ± 0.08aD 101.65 ± 1.85cA 2 ~ 5 454.24 ± 2.30aB 3.09 ± 0.13bC 147.09 ± 6.45bA 5 ~ 10 457.14 ± 6.14aA 2.40 ± 0.04cD 190.70 ± 3.39aA 樟子松 Pinus sylvestris var. mongolica ≤ 2 445.97 ± 6.27cA 4.54 ± 0.12aC 98.23 ± 2.51cB 2 ~ 5 457.38 ± 1.14bA 3.54 ± 0.13bB 129.36 ± 4.78bB 5 ~ 10 459.33 ± 2.20aA 2.86 ± 0.04cC 160.78 ± 2.19aB 注:表中数据为平均值 ± 标准误,小写字母表示同一树种不同径级,大写字母表示同一径级不同树种,相同字母表示差异不显著(P > 0.05),不同字母表示差异显著(P < 0.05)。Notes: the values in the table are average ± standard error, lowercase letters indicate different diameter classes of the same tree species, capital letters indicate different tree species of the same diameter class, same letter indicates insignificant difference (P > 0.05), different letters indicate significant differences (P < 0.05).
下载: 导出CSV
表 5 分解率与根系初始化学特性相关系数
Table 5 Correlation coefficients between mass loss rates and initial chemical properties
相关因子 Correlation factor ≤ 2 mm 2 ~ 5 mm 5 ~ 10 mm C −0.647** −0.726** −0.662** N 0.545** 0.657** 0.655** C/N −0.578** −0.666** −0.646**
下载: 导出CSV
表 2 树种、径级、分解时间及其交互作用对根系分解率及碳、氮释放率的三因素方差分析
Table 2 Three-way NAOVA for the influence on species diameter and time to mass loss rate and C, N release rate
变异来源
Variation source自由度
df分解率 Decomposition rate C释放率 C release rate N释放率 N release rate F P F P F P 树种 Species (S) 3 472.516 0.000 4.037 0.009 3.031 0.031 径级 Diameter class (D) 2 206.601 0.000 4.281 0.016 0.528 0.591 时间 Time (T) 5 223.169 0.000 129.253 0.000 143.423 0.000 S × D 6 10.502 0.000 0.476 0.825 0.766 0.598 S × T 15 3.678 0.000 7.418 0.000 45.21 0.000 D × T 10 1.552 0.127 8.371 0.000 39.923 0.000 S × D × T 30 1.644 0.029 3.015 0.000 11.921 0.000
下载: 导出CSV
-
[1] 杨轩, 李娅芸, 安韶山, 等. 宁南山区典型植物根系分解特征及其对土壤养分的影响[J]. 生态学报, 2019, 39(8): 2741−2751. Yang X, Li Y Y, An S S, et al. Effects of typical plant root decomposition on soil nutrients in southern Ningxia[J]. Acta Ecologica Sinica, 2019, 39(8): 2741−2751.
[2] Wardle D A, Bardgett R D, Klironomos J N, et al. Ecologica linkages between aboveground and belowground biota[J]. Science, 2004, 304: 1629−1633. doi: 10.1126/science.1094875
[3] 卫星, 张国珍. 树木细根主要研究领域及展望[J]. 中国农学通报, 2008, 24(5): 143−147. Wei X, Zhang G Z. Progress and prospect in the main research realms of tree fine roots[J]. Chinese Agricultural Science Bulletin, 2008, 24(5): 143−147.
[4] 杨玉盛, 陈光水, 林鹏, 等. 格氏栲天然林与人工林细根生物量、季节动态及净生产力[J]. 生态学报, 2003, 23(9): 1719−1730. Yang Y S, Chen G S, Lin P, et al. Fine root distribution, seasonal pattern and production in a native forest and monoculture plantations in subtropical China[J]. Acta Ecologica Sinica, 2003, 23(9): 1719−1730.
[5] 宋森, 谷加存, 全先奎, 等. 水曲柳和兴安落叶松人工林细根分解研究[J]. 植物生态学报, 2008, 32(6): 1227−1237. Song S, Gu J C, Quan X K, et al. Fine root decomposition of Fraxinus mandshurica and Larix gmelinii plantations[J]. Journal of Plant Ecology, 2008, 32(6): 1227−1237.
[6] Vogt K A, Grier C C, Vogt D J. Production, turnover and nutrient dynamics of above and below ground detritus of world forest[J]. Advances in Ecological Research, 1986, 15(15): 303−377.
[7] 杨丽韫, 李文华, 吴松涛. 长白山原始红松阔叶林及其次生林细根分解动态和氮元素的变化[J]. 北京林业大学学报, 2007, 29(6): 10−15. Yang L Y, Li W H, Wu S T. Fine root decomposition and nitrogen mineralisation of the primitive Korean pine and broadleaved forests as well as its secondary forests in the Changbaishan Mountains, northeastern China[J]. Journal of Beijing Forestry University, 2007, 29(6): 10−15.
[8] 翟明普, 蒋三乃, 贾黎明. 沙地杨树刺槐混交林细根动态[J]. 北京林业大学学报, 2002, 24(5/6): 39−44. Zhai M P, Jiang S N, Jia L M. Fine root dynamics in mixed plantation of poplar and black locust[J]. Journal of Beijing Forestry University, 2002, 24(5/6): 39−44.
[9] Dornbush M E, Isenhart T M, Raich J W, et al. Quantifying fine-root decomposition: an alternative to buried litterbags[J]. Ecology, 2002, 83(11): 2985−2990. doi: 10.1890/0012-9658(2002)083[2985:QFRDAA]2.0.CO;2
[10] Yang Y S, Chen G S, Guo J F, et al. Decomposition dynamic of fine roots in a mixed forest of Cunninghamia lanceolata and Tsoongiodendron odorum in mid-subtropics[J]. Annals of Forest Science, 2004, 61(1): 65−72. doi: 10.1051/forest:2003085
[11] 温璐宁, 张红光, 孙涛, 等. 不同土壤深度落叶松细根分解及N动态变化[J]. 生态学报, 2019, 39(13): 4865−4871. Wen L N, Zhang H G, Sun T, et al. Fine root decomposition and N dynamics of Larix gmelinii at different soil depths[J]. Acta Ecologica Sinica, 2019, 39(13): 4865−4871.
[12] 靳贝贝, 国庆喜. 蒙古栎、白桦根系分解及养分动态[J]. 生态学报, 2013, 33(8): 2416−2424. doi: 10.5846/stxb201208211180 Jin B B, Guo Q X. Root decomposition and nutrient dynamics of Quercus mongolica and Betula platyphylla[J]. Acta Ecologica Sinica, 2013, 33(8): 2416−2424. doi: 10.5846/stxb201208211180
[13] Chapin F S, Matson P A, Mooney H A. Principles of terrestrial ecosystem ecology[M]. New York: Springer, 2002: 151−175.
[14] Chen H, Harmon M E, Mark E. Decomposition and nitrogen release from decomposing woody roots in coniferous forests of the Pacific Northwest: a chronosequence approach[J]. Canada Journal of Forest Research, 2001, 31(2): 246−260. doi: 10.1139/x00-167
[15] 廖利平, 杨跃军, 汪思龙, 等. 杉木(Cunninghamia lanceolata)、火力楠(Michelia macclurei)纯林及其混交林细根分布、分解与养分归还[J]. 生态学报, 1999, 19(3): 54−58. Liao L P, Yang Y J, Wang S L, et al. Distribution, decomposition and nutrient return of the fine root in pure Cunninghamia lanceolata, Michelia macclurei and the mixed plantations[J]. Acta Ecologica Sinica, 1999, 19(3): 54−58.
[16] Fahey T J, Arthur M A. Further studies of root decomposition following harvest of a northern hardwoods forest[J]. Forest Science, 1944(4): 618−629.
[17] Fahey T J, Hughes J W, Mou P, et al. Root decomposition and nutrient flux following whole-tree harvest of northern hardwood forest[J]. Forest Science, 1988, 34: 744−768.
[18] 张秀娟, 吴楚, 梅莉, 等. 水曲柳和落叶松人工林根系分解与养分释放[J]. 应用生态学报, 2006, 17(8): 1370−1376. Zhang X J, Wu C, Mei L, et al. Root decomposition and nutrient release of Fraxinus manshurica and Larix gmelinii plantations[J]. Chinese Journal of Applied Ecology, 2006, 17(8): 1370−1376.
[19] 范世华, 李培芝, 王力华, 等. 杨树人工林下根系的氮素循环与动态特征[J]. 应用生态学报, 2004, 15(3): 387−390. Fan S H, Li P Z, Wang L H, et al. Nitrogen cycling and its dynamic feature in fine roots of poplar trees and herbs[J]. Chinese Journal of Applied Ecology, 2004, 15(3): 387−390.
[20] 林成芳, 郭剑芬, 陈光水, 等. 森林细根分解研究进展[J]. 生态学杂志, 2008, 27(6): 1029−1036. Lin C F, Guo J F, Chen G S, et al. Research progress in fine root decompostion in forest ecosystem[J]. Chinese Journal of Ecology, 2008, 27(6): 1029−1036.
[21] 高明磊, 满秀玲, 段北星. 林下植被和凋落物对我国寒温带天然林土壤CO2通量的短期影响[J]. 北京林业大学学报, 2021, 43(3): 55−65. Gao M L, Man X L, Duan B X. Short-term effects of understory vegetation and litter on soil CO2 flux of natural forests in cold temperate zone of China[J]. Journal of Beijing Forestry University, 2021, 43(3): 55−65.
[22] Vogt K A, Grier C C, Vogt D J. Production, turnover, and nutrient dynamics of above and below ground detritus of world forests[J]. Advances in Ecological Research, 1986, 15: 303−377.
[23] 王娜, 程瑞梅, 肖文发, 等. 三峡库区马尾松细根分解及其养分释放[J]. 林业科学研究, 2017, 30(1): 18−24. Wang N, Cheng R M, Xiao W F, et al. Fine root decomposition and nutrient release of Pinus massoniana in the Three Gorges Reservoir Area[J]. Forest Research, 2017, 30(1): 18−24.
[24] 李国雷, 刘勇, 李瑞生, 等. 油松叶凋落物分解速率、养分归还及组分对间伐强度的响应[J]. 北京林业大学学报, 2008, 30(5): 52−57. Li G L, Liu Y, Li R S, et al. Responses of decomposition rate‚nutrient return an decomposition of leaf litter to thinning intensities in Pinus tabulaeformis plantation[J]. Journal of Beijing Forestry University, 2008, 30(5): 52−57.
[25] 王娜, 程瑞梅, 肖文发, 等. 三峡库区马尾松不同直径细根分解动态及其影响因素[J]. 应用生态学报, 2017, 28(2): 391−398. Wang N, Cheng R M, Xiao W F, et al. Dynamics of fine root decomposition and its affecting factors of Pinus massoniana in the Three Gorges Reservoir Area[J]. Chinese Journal of Applied Ecology, 2017, 28(2): 391−398.
[26] Eriksson K E, Blanchette R A, Ander P. Microbial and enzymatic degradation of wood and wood components[M]. Berlin: Springer, 1990.
[27] 唐仕姗, 杨万勤, 王海鹏, 等. 川西亚高山3个优势树种不同径级根系分解特征[J]. 应用生态学报, 2015, 26(10): 2921−2927. Tang S S, Yang W Q, Wang H P, et al. Decomposition and nutrient release of root with different diameters of three subalpine dominant trees in western area of Sichuan Province, China[J]. Chinese Journal of Applied Ecology, 2015, 26(10): 2921−2927.
[28] 庄丽燕. 川西亚高山根系分解及腐殖化特征: 林窗和径级效应[D]. 成都: 四川农业大学, 2018. Zhuang L Y. Root decomposition and humification in the western Sichuan: the effects of forest gap and diameter classes[D]. Chengdu: Sichuan Agricultural University, 2018.
[29] 潘君, 王传宽, 王兴昌. 3个温带阔叶树种根系长期分解速率研究[J]. 生态学报, 2021, 41(13): 5166−5174. Pan J, Wang C K, Wang X C. Seven-year decomposition rates of roots with different diameters for three temperate broadleaf tree species[J]. Acta Ecologica Sinica, 2021, 41(13): 5166−5174.
[30] Burke M K, Raynal D J. Fine root growth phenology, production, and turnover in a northern hardwood forest ecosystem[J]. Plant and Soil, 1994, 162(1): 135−146. doi: 10.1007/BF01416099
[31] Lhmus K, Ivask M. Decomposition and nitrogen dynamics of fine roots of Norway spruce (Picea abies (L.) Karst) at different sites[J]. Plant and Soil, 1995, 168/169: 89−94. doi: 10.1007/BF00029317
[32] 王存国, 陈正侠, 马承恩, 等. 细根异速分解的3个可能影响途径[J]. 北京林业大学学报, 2016, 38(4): 123−128. Wang C G, Chen Z X, Ma C E, el al. Three potential pathways influencing contrasting decomposition rates of fine roots[J]. Journal of Beijing Forestry University, 2016, 38(4): 123−128.
[33] 彭倩, 任雨之, 张悦, 等. 粗枝云杉不同径级根系分解过程中4种养分元素的释放特征[J]. 应用与环境生物学报, 2021, 27(1): 8−14. Peng Q, Ren Y Z, Zhang Y, et al. The release dynamic of four nutrient elements in decomposing Picea asperata roots of different diameters[J]. Chinese Journal of Applied and Environmental Biology, 2021, 27(1): 8−14.
[34] 郭培培, 江洪, 余树全, 等. 亚热带6种针叶和阔叶树种凋落叶分解比较[J]. 应用与环境生物学报, 2009, 15(5): 655−659. Guo P P, Jiang H, Yu S Q, et al. Comparison of litter decomposition of six species of coniferous and broad-leaved trees in subtropical China[J]. Chinese Journal of Applied and Environmental Biology, 2009, 15(5): 655−659.
[35] Chapin F S, Matson P A, Mooney H A. Principles of terrestrial ecosystem ecology[M]. New York: Springer, 2002: 151−175.
[36] Joshi R K, Garkoti S C. Influence of Nepalese alder on soil physico-chemical properties and fine root dynamics in white oak forests in the central Himalaya, India[J]. Catena, 2021, 200: 105140.
[37] 林成芳, 杨玉盛, 陈光水, 等. 杉木人工林细根分解和养分释放及化学组成变化[J]. 亚热带资源与环境学报, 2008, 3(1): 15−23. Lin C F, Yang Y S, Chen G S, et al. Decomposition dynamics of fine roots of Cunninghamia lanceolata in mid-subtropics[J]. Journal of Subtropical Resources and Environment, 2008, 3(1): 15−23.
[38] 魏圆云, 武志超, 杨万勤, 等. 季节性冻融期亚高山/高山森林细根分解动态[J]. 林业科学, 2013, 49(8): 21−28. Wei Y Y, Wu Z C, Yang W Q, et al. Fine root decomposition dynamics during freeze-thaw season in the subalpine/Alpine forests[J]. Scientia Silvae Sinicae, 2013, 49(8): 21−28.
[39] Chen H, Harmon M E, Sexton J, et al. Fine-root decomposition and N dynamics in coniferous forests of the Pacific Northwest, U. S. A.[J]. Canadian Journal of Forest Research, 2002, 32: 320−331. doi: 10.1139/x01-202
[40] Bhattarai K P, Mandal T N, Gautam T P. Fine root decomposition and nutrient release in two tropical forests of Central Himalaya: a comparative and factor controlling approach[J]. Tropical Ecology, 2022, 2(4): 1−13.
-
期刊类型引用(6)
1. 宋学雨,简尊吉,王少博,党英侨,魏可,王小艺,肖文发. 松材线虫入侵对湖北三峡地区马尾松林水源涵养能力的影响. 林业科学研究. 2024(01): 10-20 .  百度学术
百度学术
2. 黄金莲,崔鸿侠,唐万鹏,胡琛,马致远,雷静品. 虫害对华山松人工林土壤酶活性及碳氮磷化学计量特征的影响. 林业科学. 2023(10): 128-137 . 百度学术
3. 周岚,巫大宇,吕秋实,李贤伟,苏宇,郭茂金,尹海锋,吕倩. 松材线虫侵染的马尾松人工林细根形态及生物量分异特征. 生态学报. 2022(15): 6274-6286 . 百度学术
4. 高瑞贺,骆有庆,石娟. 松材线虫入侵对马尾松树光合特性的影响. 林业科学研究. 2019(01): 65-73 . 百度学术
5. Ruihe Gao,Youqing Luo,Zhuang Wang,Hanjun Yu,Juan Shi. Patterns of biomass, carbon, and nitrogen storage distribution dynamics after the invasion of pine forests by Bursaphelenchus xylophilus (Nematoda: Aphelenchoididae) in the three Gorges Reservoir Region. Journal of Forestry Research. 2018(02): 459-470 . 必应学术
6. 宋秀虎. 寄生线虫入侵对恩施州园林植物平面构成的拓扑性质影响分析. 科技通报. 2016(10): 63-67 . 百度学术
其他类型引用(4)


计量
- 文章访问数: 422
- HTML全文浏览量: 96
- PDF下载量: 85
- 被引次数: 10
