
Characteristics of changes in soil bacterial community structure and functional diversity in Eucalyptus sp. plantation of different ages
-
摘要:目的
探究林龄增长对桉树人工林土壤细菌群落的影响,为提升桉树人工林土壤生态系统功能提供理论依据。
方法以广西国有大桂山林场不同林龄(1、2、3、5、7 a)桉树人工林为研究对象,分析不同林龄桉树人工林土壤理化性质、微生物生物量以及土壤细菌群落组成、共现网络、功能特征及其影响因素。
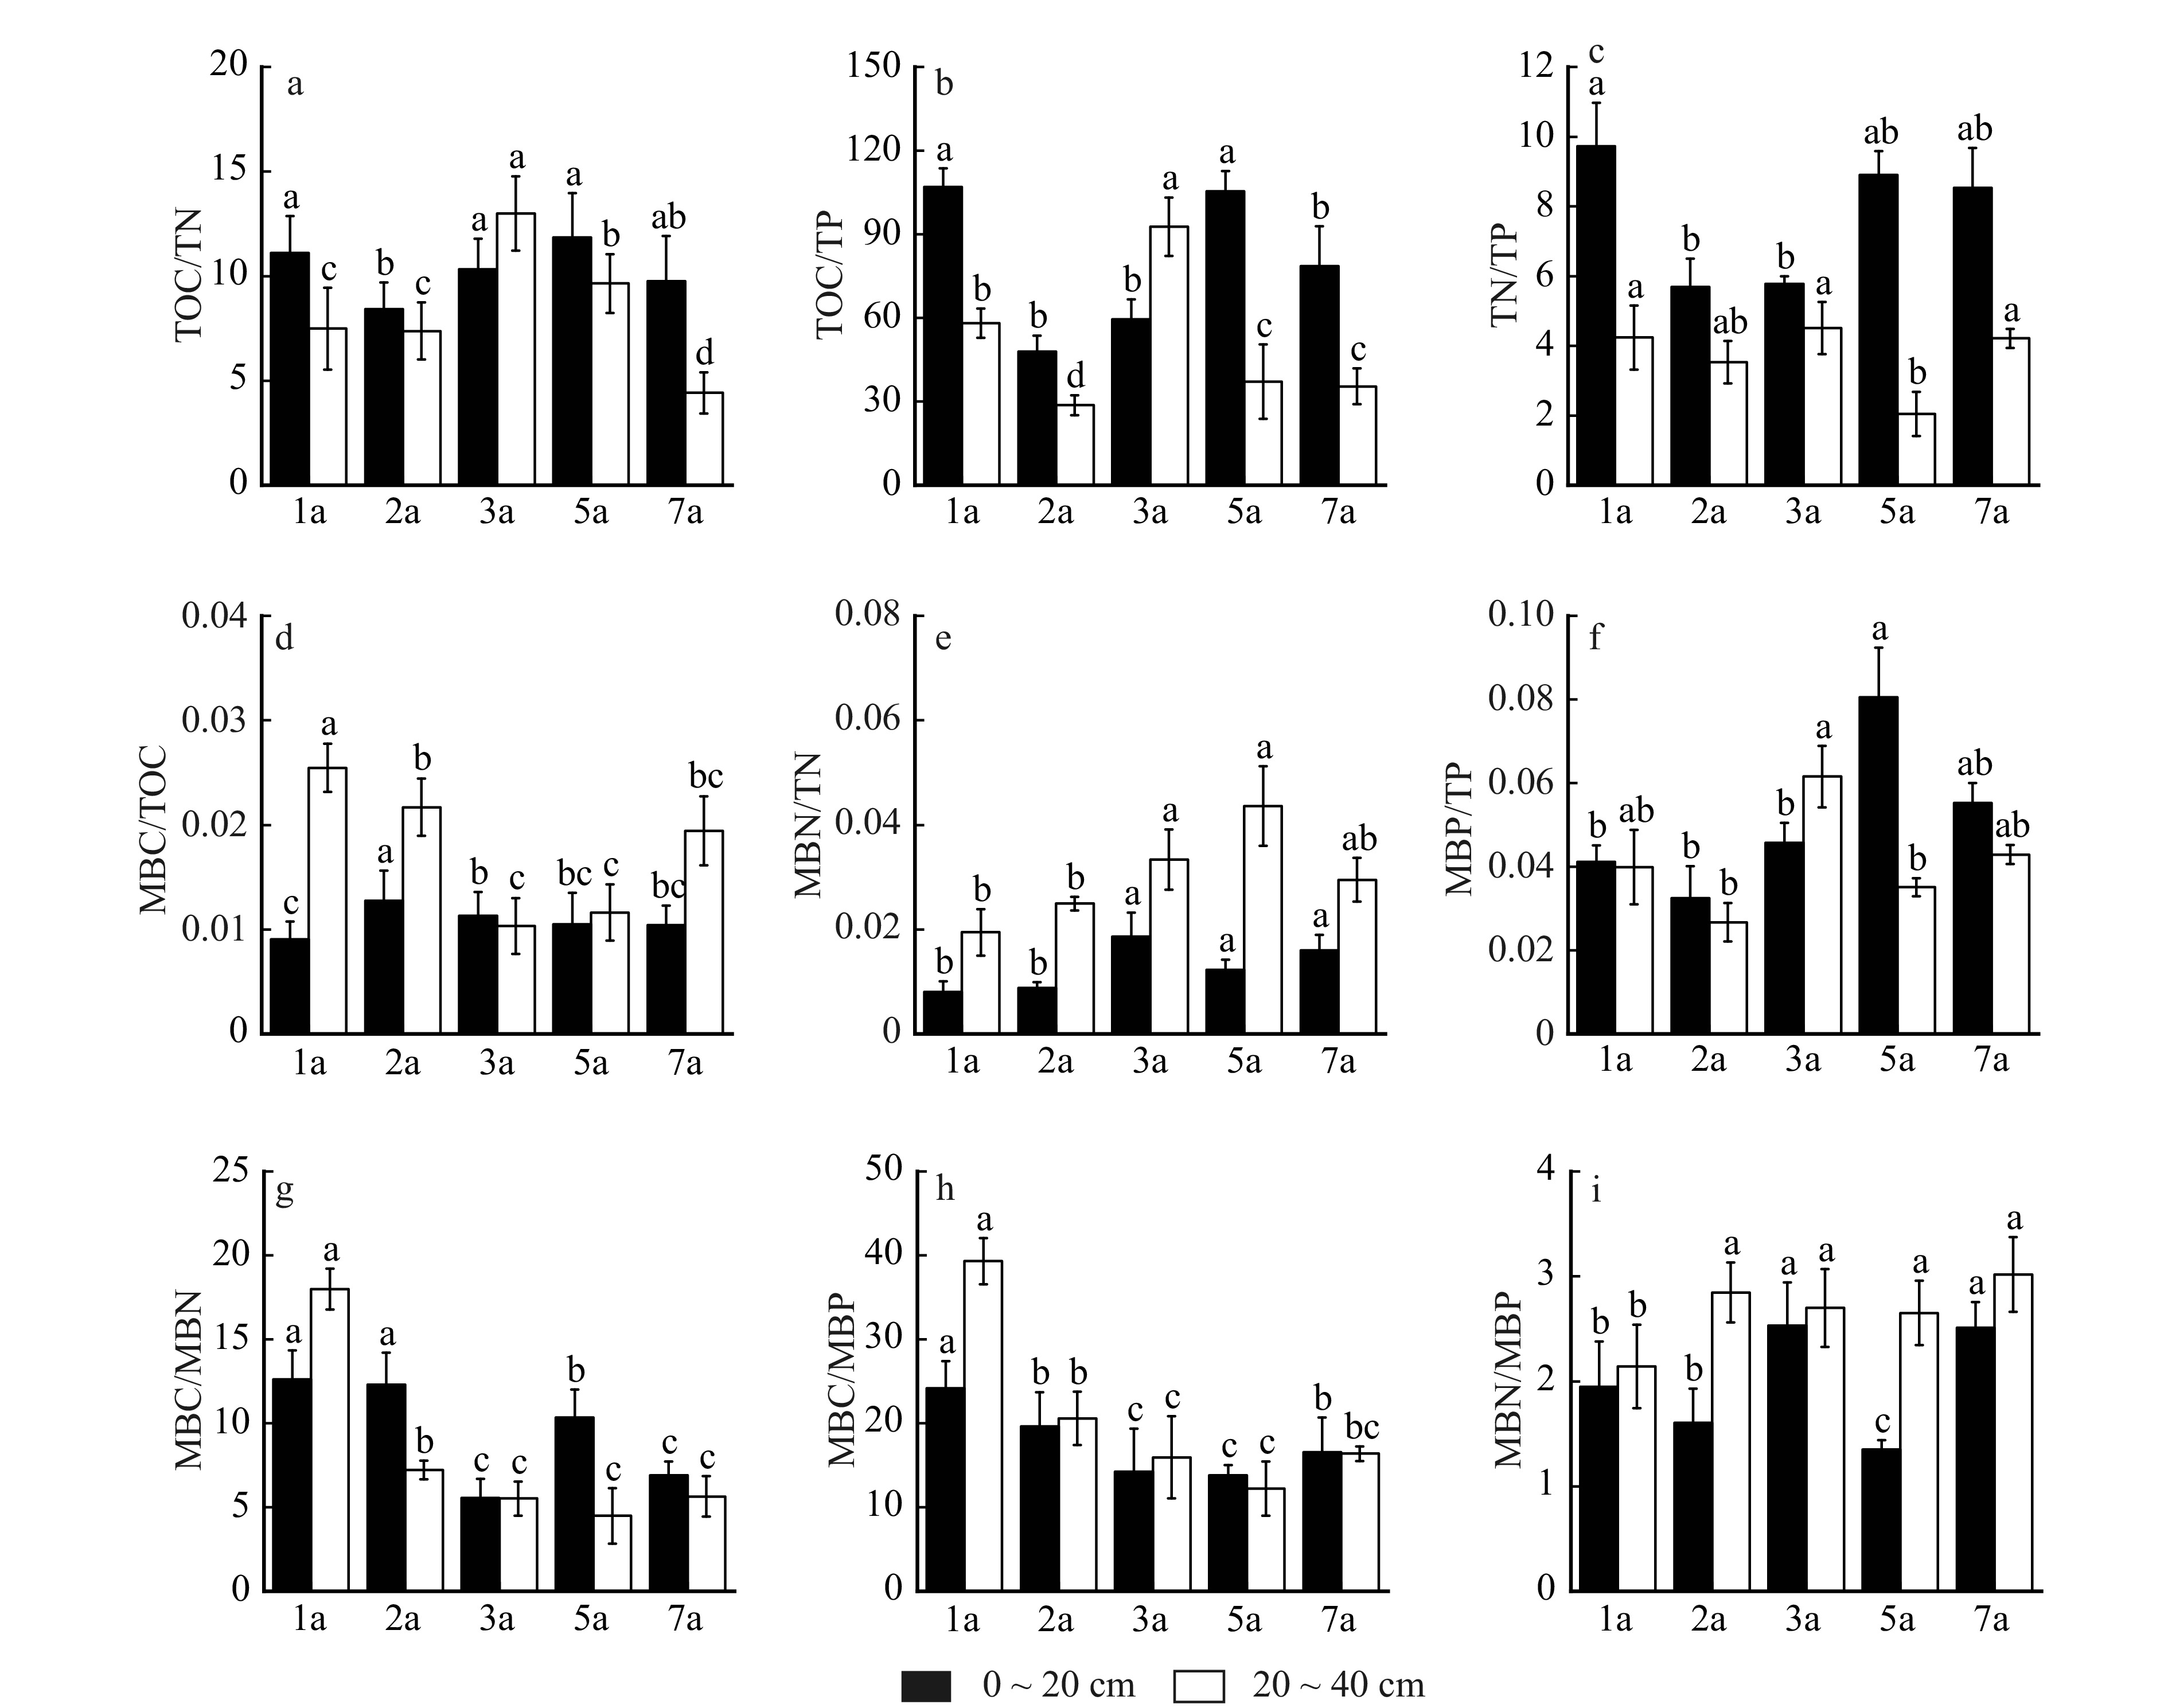
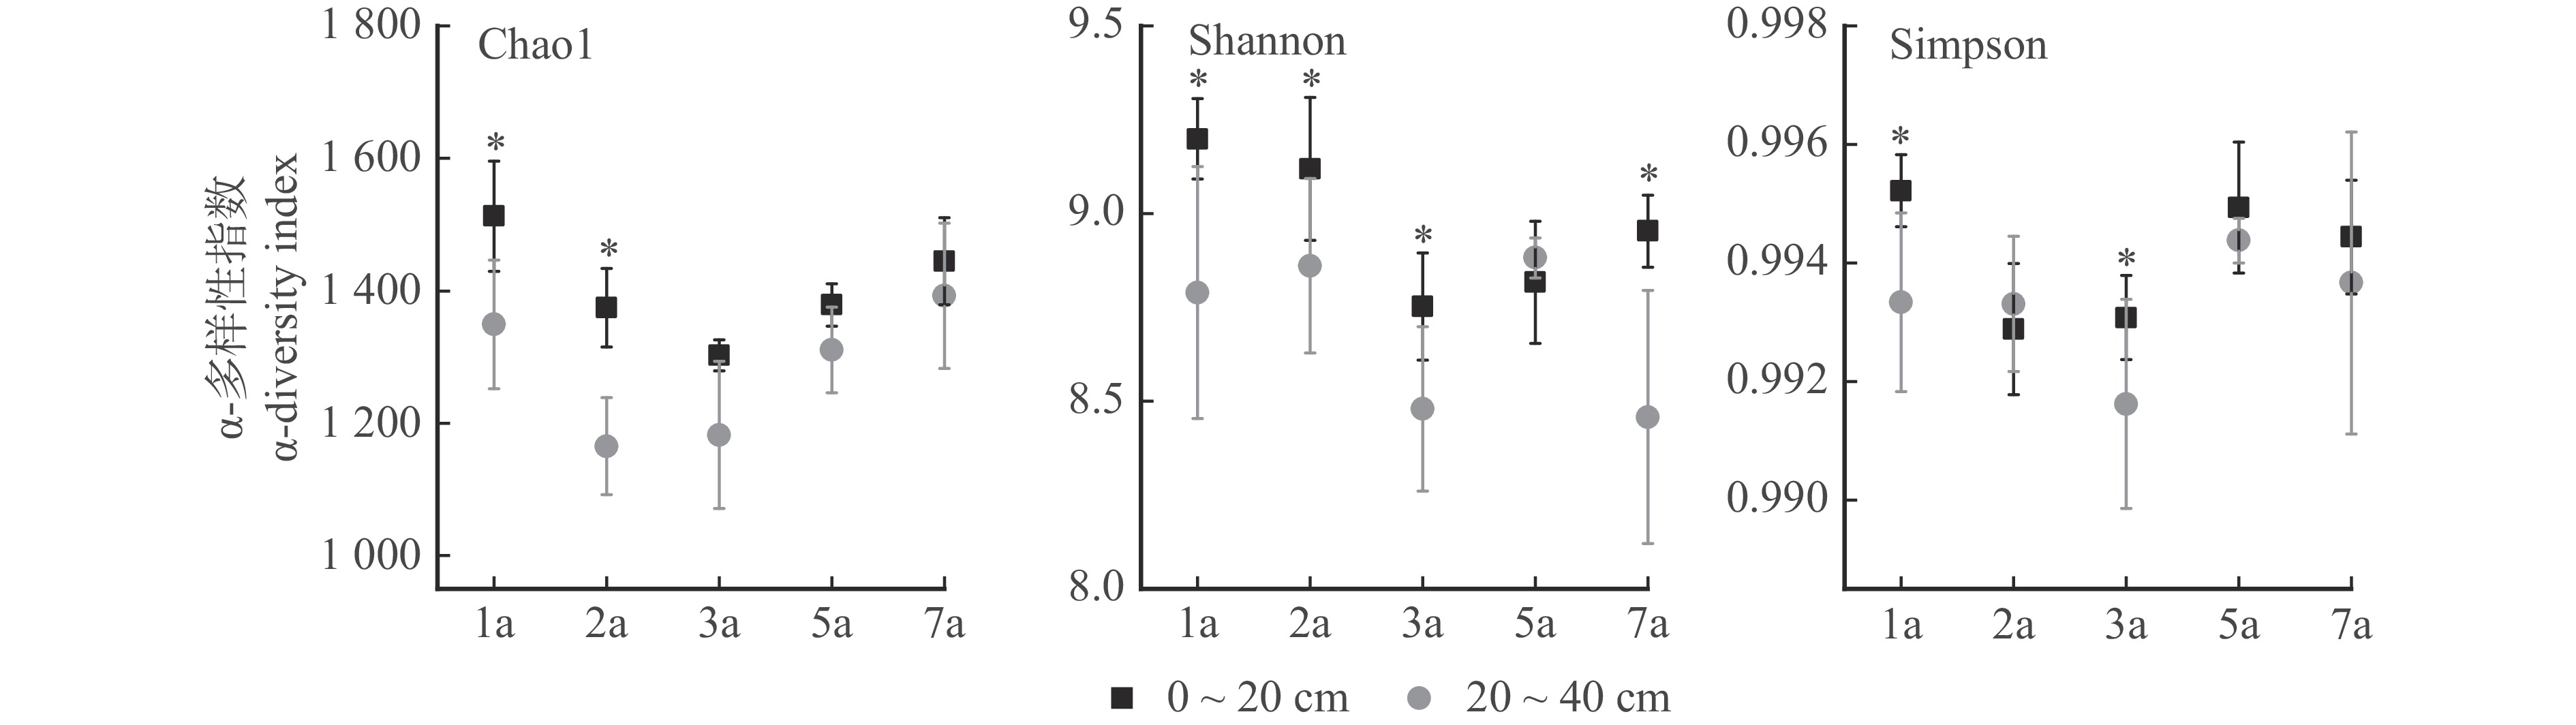
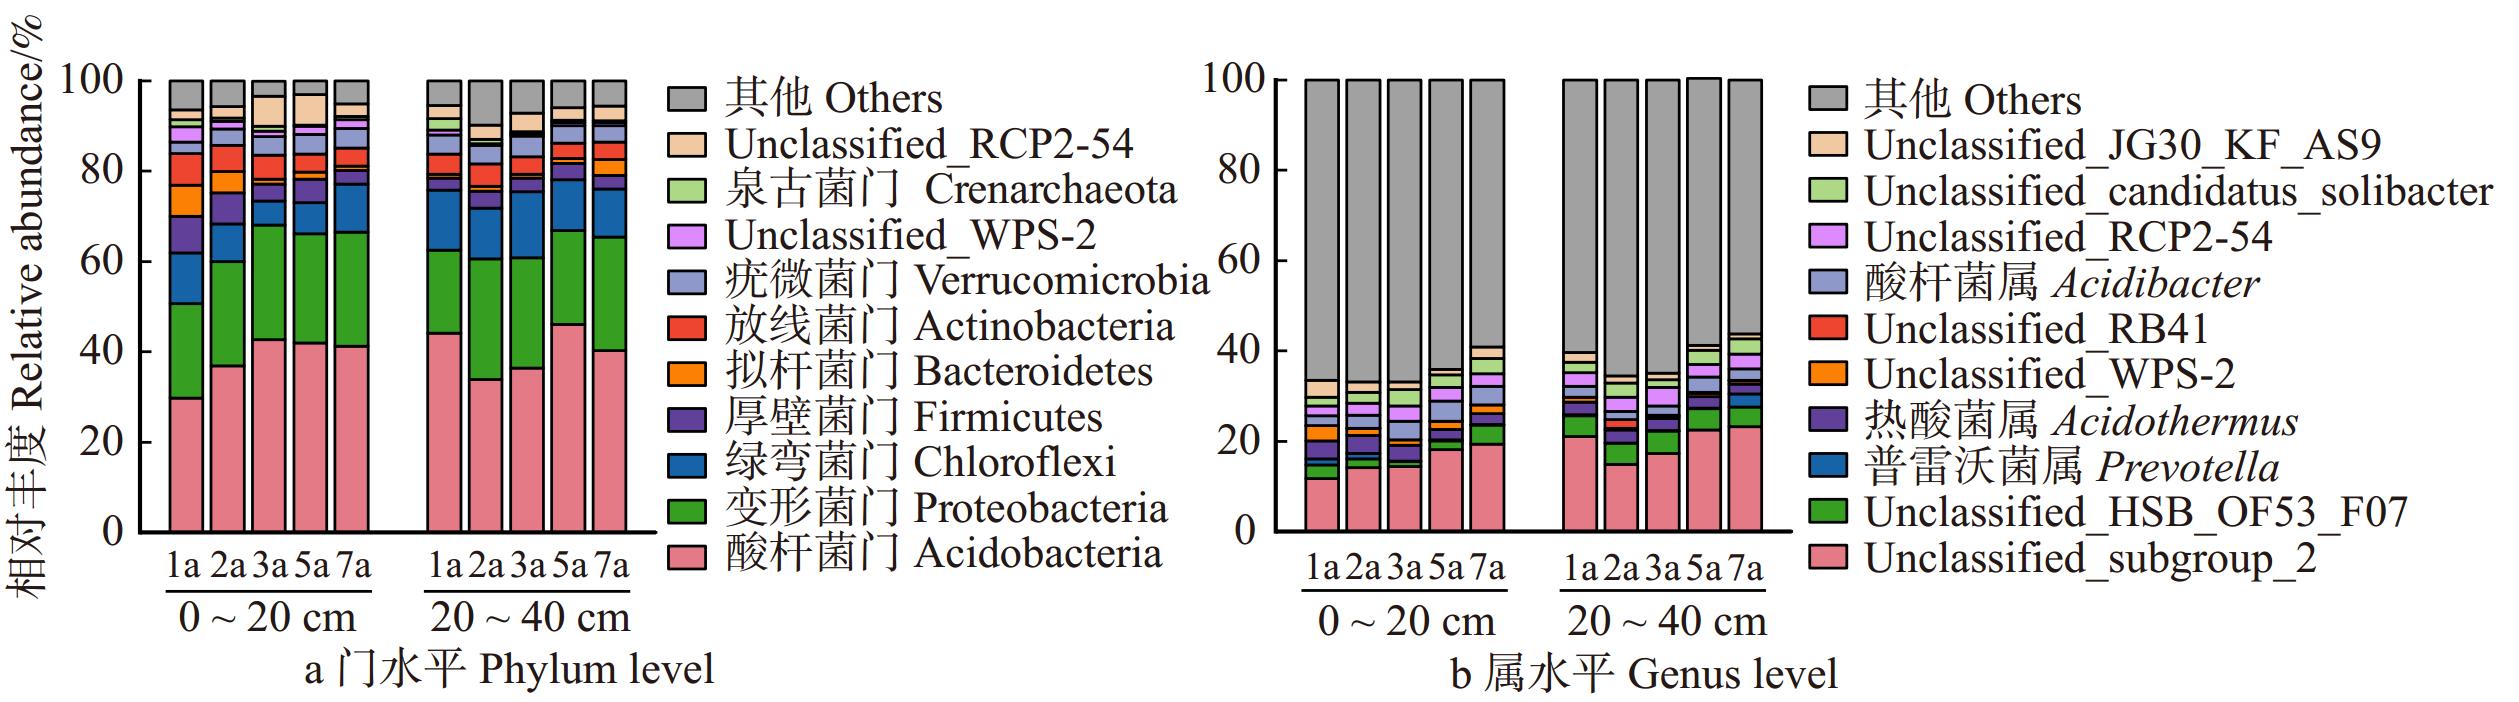
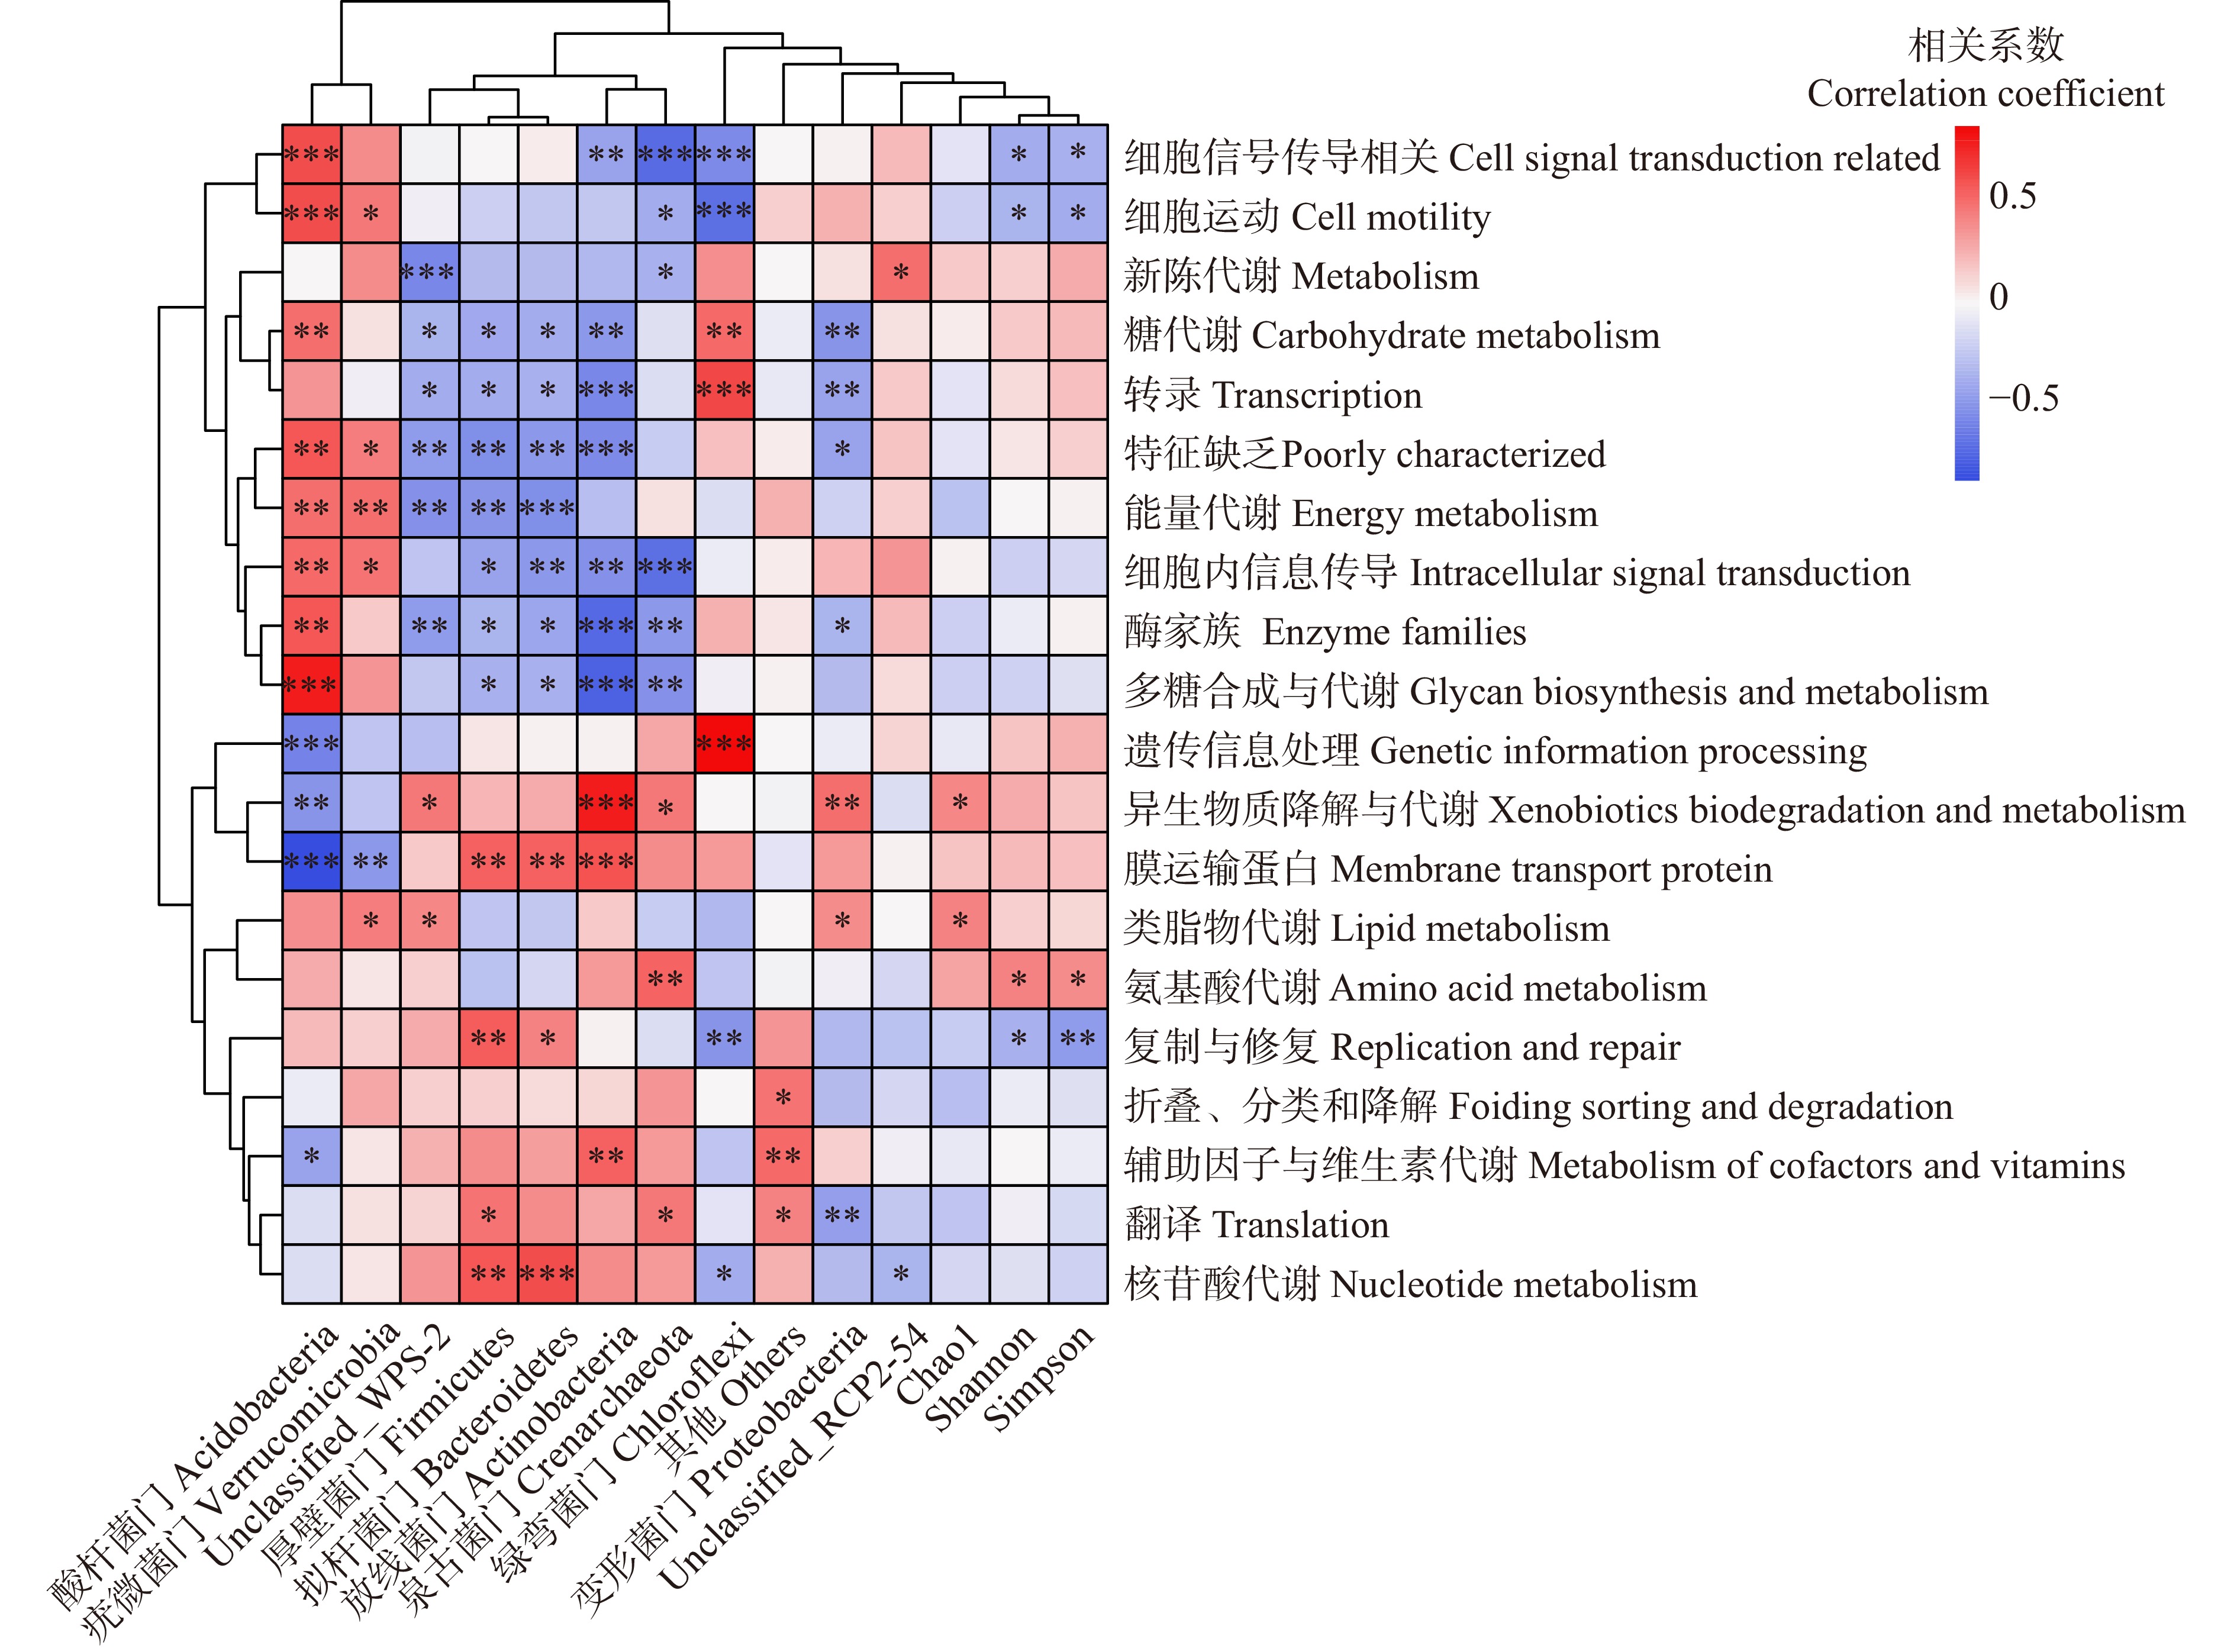
结果(1)随林龄增长,土壤总有机碳(TOC)、全氮(TN)、可溶性有机碳(DOC)、可溶性有机氮(DON)、微生物生物量碳(MBC)整体均呈先下降后上升的变化趋势,微生物生物量氮(MBN)、微生物生物量磷(MBP)随林龄增长显著增加。(2)土壤养分TOC/TN表现出先上升后下降的趋势,MBN/TN、MBP/TP表现为随林龄增长显著升高。MBC/MBN、MBC/MBP则随林龄增长显著下降,呈现“表层聚集性”特征。(3)细菌α-多样性随土壤深度增加显著降低。土壤优势细菌类群为酸杆菌门、变形菌门。(4)共现网络分析得出,细菌以共存作用为主导,细菌间的协同作用较大,7 a林分的网络复杂性较高,表明其细菌群落间相互作用更为复杂,有利于土壤生物因子的稳定。细菌功能预测以糖代谢和氨基酸代谢为主,大部分功能差异随林龄增长不显著。(5)TN、DON、TP、TN/TP与较低丰度细菌群落WPS-2门、拟杆菌门、厚壁菌门显著正相关,说明较低类群也可能在保持土壤稳定上发挥作用。
结论土壤碳、氮、磷是桉树生长过程中的重要限制因素,应注重早期桉树人工林的生长管理,适当延长轮伐期,施用有机肥或菌肥,以提高细菌群落结构稳定性尤其是优势细菌类群的稳定,这对改善桉树人工林土壤质量具有重要意义。
Abstract:ObjectiveExploring the effects of forest age growth on soil bacterial communities in Eucalyptus sp. plantation can provide a theoretical basis for improving soil ecosystem function of eucalyptus plantation.
MethodSoil physical and chemical properties, microbial biomass, and soil bacterial community composition, co-occurrence network, functional characteristics, and their influencing factors were analyzed in eucalyptus plantation of different ages (1-year-old, 2-year-old, 3-year-old, 5-year-old, and 7-year-old) in the State-Owned Daguishan Forest Farm of Guangxi, southern China as the research object.
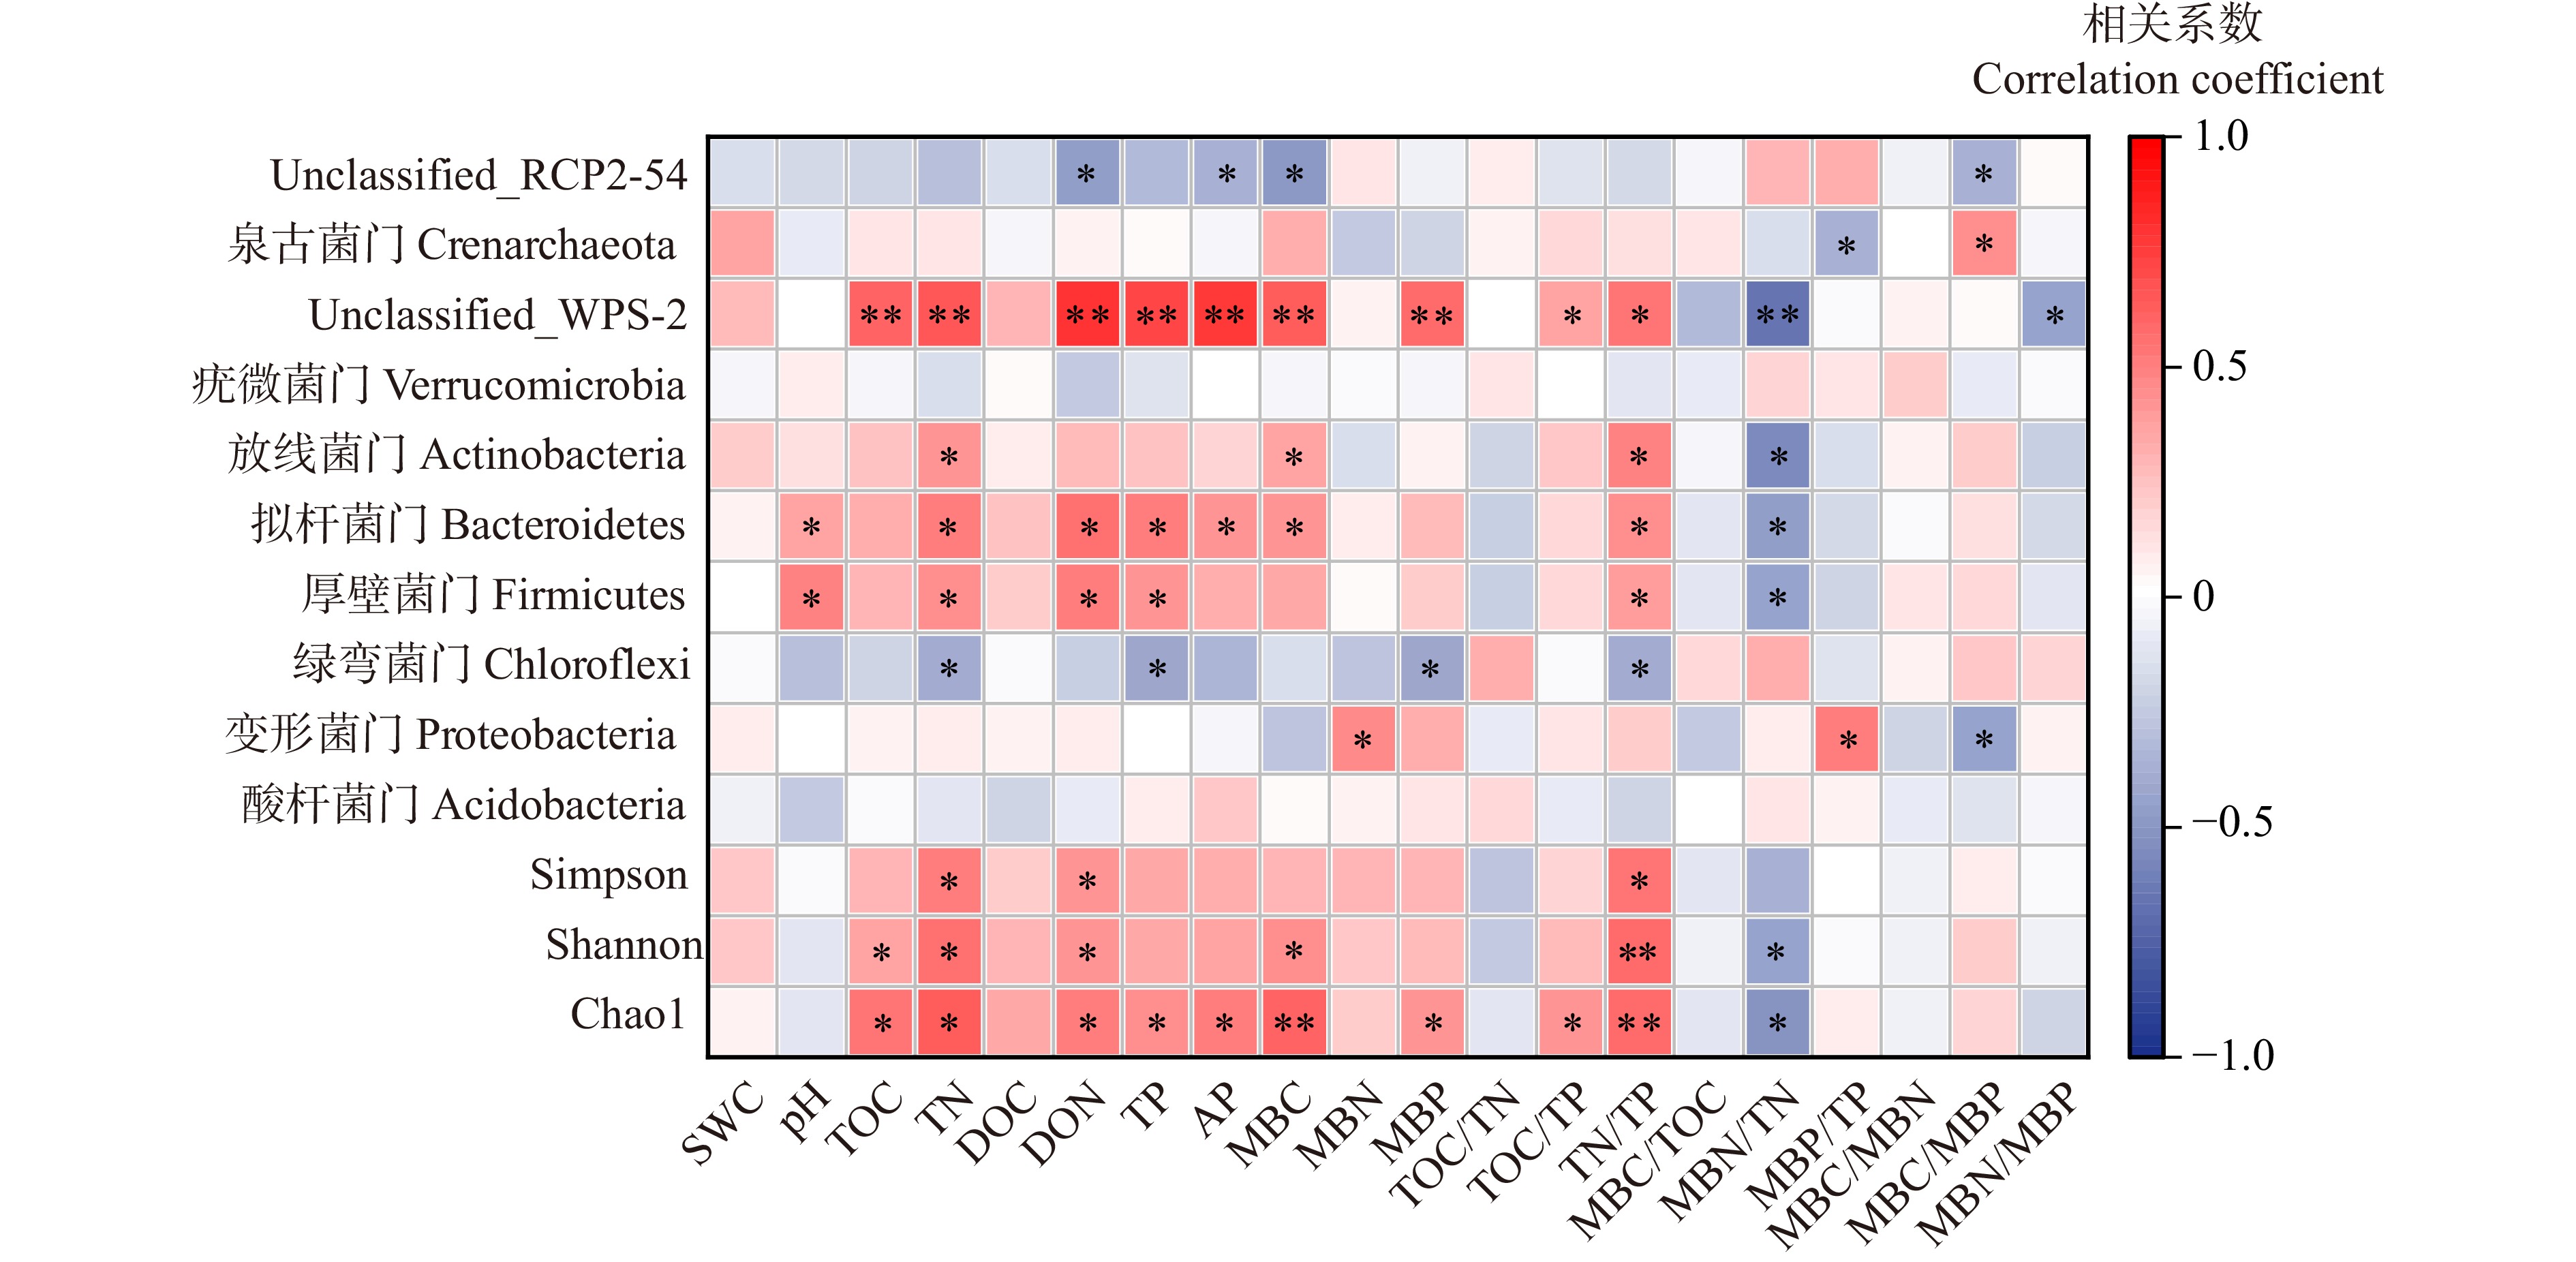
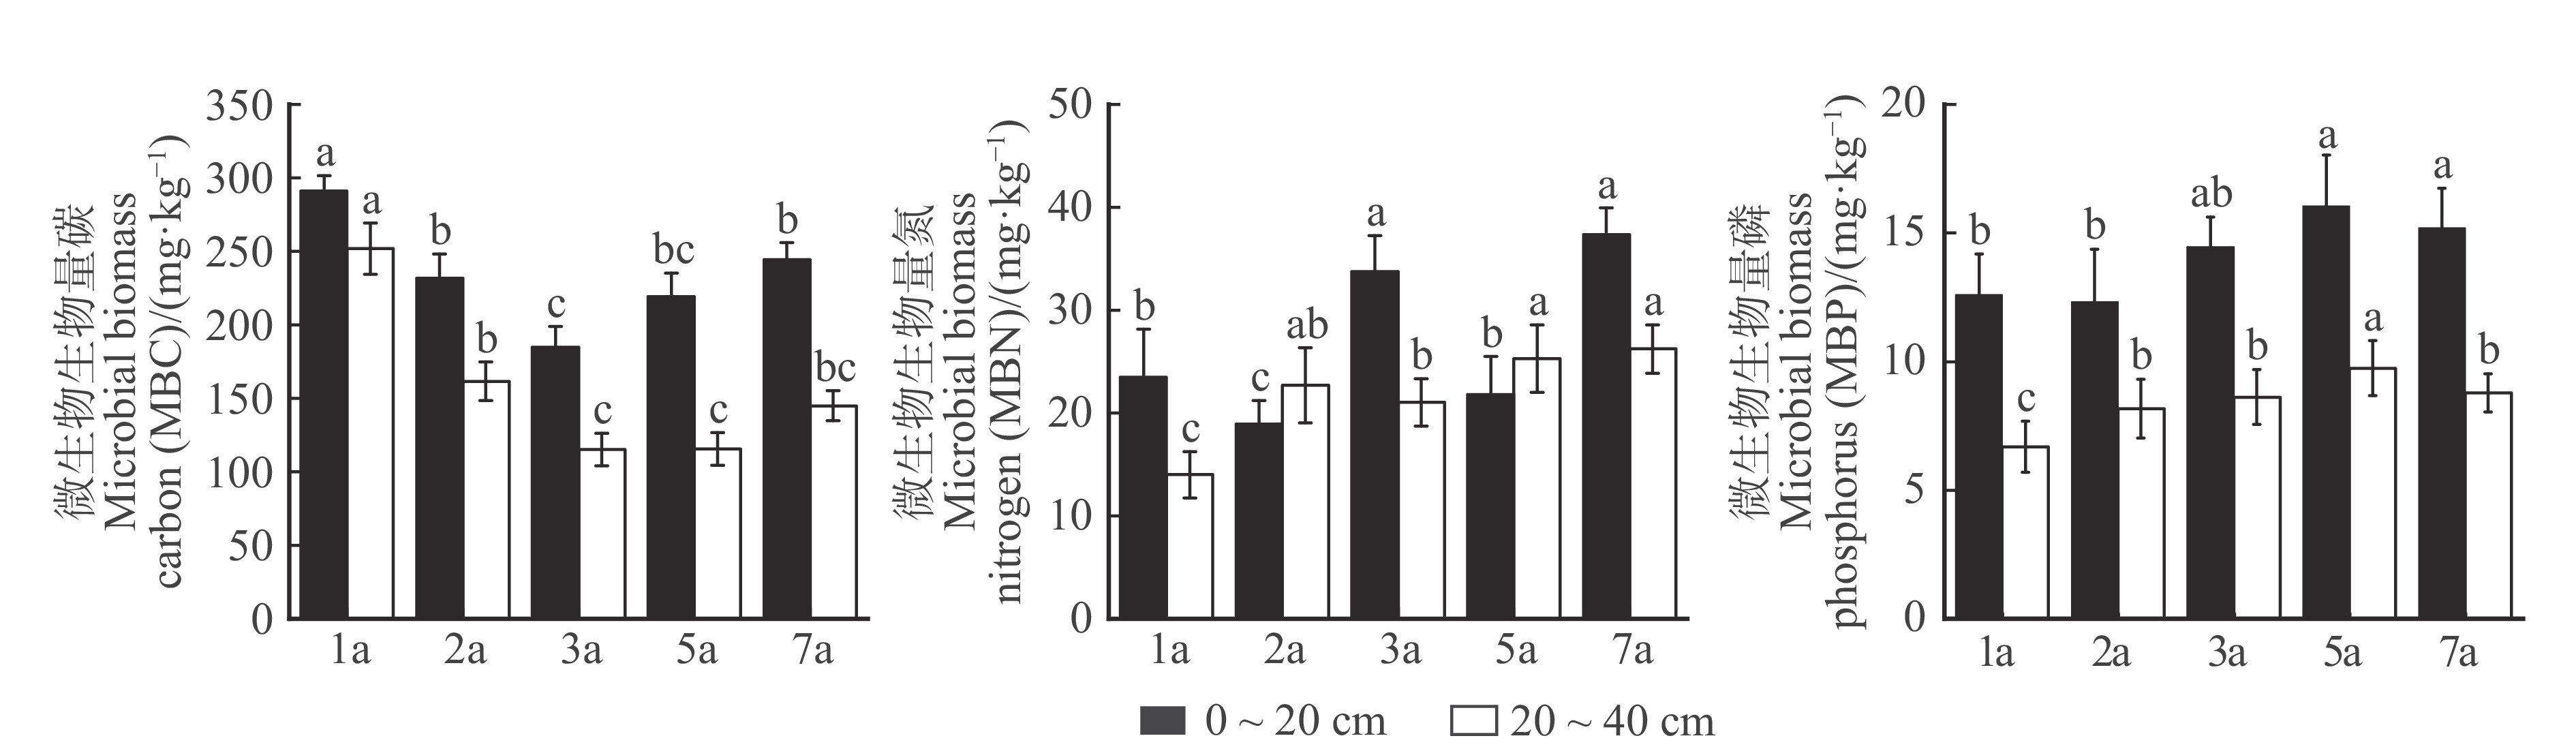
Result(1) With the growth of stand age, soil total organic carbon (TOC), total nitrogen (TN), dissolved organic carbon (DOC), dissolved organic nitrogen (DON), and microbial biomass carbon (MBC) as a whole showed a decreasing and then increasing trend, and microbial biomass nitrogen (MBN) and phosphorus (MBP) increased significantly with the growth of stand age. (2) The soil nutrient stoichiometric ratios of TOC/TN showed an increasing and then decreasing trend, while MBN/TN and MBP/TP increased significantly with the age of forest, and MBC/MBN and MBC/MBP decreased significantly with stand age, which was characterized by “surface layer aggregation”, and TOC/TP, TN/TP, MBC/TOC and MBN/MBP showed different patterns and were greatly influenced by soil layer. TOC/TP, TN/TP, MBC/TOC, and MBN/MBP showed different patterns and were greatly influenced by soil layer. (3) α-diversity decreased significantly with increasing soil depth and dominant soil bacterial taxa were Acidobacteria and Proteobacteria phylum. (4) Co-occurrence network analysis showed that bacteria were dominated by co-occurrence, with greater synergistic effects among bacteria, and the network complexity was higher in 7-year-old stand, suggesting that its more complex interactions among bacterial communities were conducive to stabilization of soil biological factors. Bacterial functions were predicted to be dominated by carbohydrate metabolism and amino acid metabolism, and most of unctional differences were not significant with stand age. (5) TN, DON, TP, and TN/TP were significantly and positively correlated with lower abundance bacterial groups WPS-2 phylum, Bacteroidetes phylum, and Firmicutes phylum, suggesting that lower taxa may also play a role in maintaining soil stability.
ConclusionIt is initially shown that C, N and P in the soil of eucalyptus plantation are important limiting factors in growth process, and attention should be paid to the growth management of eucalyptus plantation in the early stage, appropriately lengthening the rotational period, and applying organic fertilizers or bacterial fertilizers to improve the stability of structure of bacterial community, especially the stability of dominant taxa, which is of great significance to the improvement of quality of eucalyptus plantation soils and sustainable development of eucalyptus plantation.
-
Keywords:
- eucalyptus plantation /
- soil bacteria /
- community structure /
- functional diversity
-
近自然森林经营理论是经过了法正林−恒续林−近自然森林经营一百多年的不断发展而形成的[1],是实现森林可持续经营的有效途径。目标树经营是近自然经营的主要技术体系,把所有林木分类为目标树、特殊目标树、干扰树和其他树木等4种类型[2]。目标树经营的核心技术体系是以选择的目标树为培育对象,通过采伐干扰树来实现林地的综合效益。国外已经开展了很多关于目标树经营的实践和研究[3],国内由于开展时间较晚,干扰树采伐对林分的影响研究较少,目前针对传统采伐对林分的影响研究较多[4−6]。
森林生长的周期很长,一些传统特征指标,如蓄积、生长量等对森林经营措施的响应较慢,而空间结构是森林经营过程可以调控的因子[7],通过对空间结构的影响研究可以及时反映出经营效果,为森林精准经营提供基础。森林空间结构在很大程度上决定了森林发展的状态、林分稳定性和经营空间的大小[8],目前国际上模拟森林经营的主要研究内容之一便是空间结构的分析和比较。国内外针对目标树经营效果的研究主要集中在一些传统指标上[9−14],对空间结构的研究尚不多见。
森林空间结构指标的研究较多,许多学者选取不同的指标研究了林分空间结构对环境因素以及人类经营活动的响应[15−16]。然而选择的指标不同,关注的角度就不同,在评判空间结构的优劣时得出的结论可能不一致[17−18]。因此选取合适的指标,并实现各个空间结构要素之间的联立,构建一个定量化综合指标来对林分空间结构进行综合分析,才能对森林空间结构进行更为客观全面的描述,从而为经营决策提供准确依据。
蒙古栎(Quercus mongolica)属壳斗科(Fagaceae)栎属(Quercus)植物,又称柞木、柞树,在我国主要分布于东北和华北地区,是我国温带地区落叶阔叶林及针阔混交林的主要树种[19−22]。相关研究发现,栎属树种平均生长季的日用水量明显低于其他树种[23],许多栎属树种能适应较温暖和更加极端的气候,在森林经营中,栎类的生态学和经济学地位很可能会因此得以提升[24−26]。殷晓洁等[27]研究发现未来气候变化将使蒙古栎的地理分布范围扩大,成为我国大兴安岭和小兴安岭最主要的树种。但由于人们对蒙古栎的生长特性认识不足,而且大部分蒙古栎林的现实林分生长不良,没有充分发挥其多种效益。蒙古栎次生林在我国分布面积很大,如何通过经营来改善其林分状况,实现其经济价值和生态效益具有重要意义。
基于以上因素,本研究采取基于相邻木关系的混交度(M)、大小比数(U)、角尺度(W)和密集度(C)等4个常用的林分空间结构指标,构建空间结构综合指数(comprehensive spatial structure index,CSSI)。以吉林省汪清林业局塔子沟林场蒙古栎次生林传统经营和目标树经营样地为研究对象,分别采用4个空间结构指标以及CSSI从目标树水平和林分水平分析了基于目标树经营的抚育间伐与传统抚育间伐对蒙古栎次生林空间结构的影响,以期为蒙古栎次生林的空间结构优化和确定合理目标树选择密度提供借鉴。
1. 材料与方法
1.1 研究地区概况
研究区位于吉林省延边朝鲜族自治州汪清林业局塔子沟林场,地形以低山丘陵为主,地理坐标为129°56′ ~ 131°04′E,43°05′ ~ 43°40′N。该区属于温带大陆性季风气候,年均气温3.9 ℃,年平均降水量500 ~ 600 mm,且主要集中在夏季。研究区森林覆盖率达到90%以上,主要乔木树种有蒙古栎、红松(Pinus koraiensis)、白桦(Betula platyphylla)、黑桦(Betula dahurica)、大青杨(Populus ussuriensis)、色木槭(Acer mono)、长白落叶松(Larix olgensis)、紫椴(Tilia tuan)、臭冷杉(Abies nephrolepis)、春榆(Ulmus japonica)、水曲柳(Fraxinus mandschurica)等。主要灌木树种有:山葡萄(Vitis amurensis)、毛榛(Corylus mandshurica)、暴马丁香(Syringa reticulata var. amurensis)、五味子(Schisandra chinensis)、忍冬(Lonicera japonica)、刺五加(Acanthopanax senticosus)等。
1.2 数据来源
在吉林省汪清林业局塔子沟林场选取林分条件相对一致的蒙古栎次生林,设置9块面积为1 hm2(100 m × 100 m)的试验样地,并用森林罗盘仪将每块样地划分100个10 m × 10 m的网格单元。在每个网格单元内,对胸径5 cm以上的树木进行了每木调查,记录树种,测量胸径、树高、枝下高、东西南北冠幅、林木健康状况等因子,并利用徕卡激光测距仪测定每木的坐标(X,Y)。选取的样地林分均处于中龄林阶段,主林层蒙古栎的林龄介于40 ~ 70年之间。样地基本概况和林分基本信息见表1和表2。
表 1 样地基本概况Table 1. General description of sample plot样地号
Sample plot No.海拔
Altitude/m坡位
Slope position坡度
Slope gradient/(°)郁闭度
Canopy density密度/(株·hm− 2)
Stand density/(tree·ha− 1)树种组成
Species composition处理
Treatment1 705 中 Middle 8 0.70 766 6蒙1桦1杨1红1其他 T1 2 738 中 Middle 8 0.71 896 4蒙2杨1桦1色1椴1红 T2 3 721 中 Middle 7 0.72 1 038 5蒙2桦1色1杨1椴 T3 4 741 中 Middle 8 0.83 992 4蒙2桦1色1椴1红1其他 T2 5 637 中 Middle 8 0.85 998 5蒙2桦1红1黑1其他 T1 6 635 中 Middle 8 0.88 1 047 5蒙3桦1黑1红 T3 7 677 中 Middle 7 0.90 800 6蒙1黑1胡1水1其他 T1 8 685 中 Middle 7 0.77 929 6蒙2桦1黑1其他 T3 9 703 中 Middle 6 0.87 995 4蒙3桦1杨2其他 T2 注:蒙代表蒙古栎,桦代表白桦,杨代表大青杨,红代表红松,色代表色木槭,椴代表紫椴,落代表长白落叶松,黑代表黑桦,胡代表胡桃楸,水代表水曲柳,其他代表其他树种。Notes: 蒙 stands for Quercus mongolica, 桦 stands for Betula platyphylla, 杨 stands for Populus ussuriensis, 红 stands for Pinus koraiensis, 色 stands for Acer mono, 椴 stands for Tilia tuan, 落 stands for Larix olgensis, 黑 stands for Betula dahurica, 胡 stands for Juglans mandshurica, 水 stands for Fraxinus mandschurica, 其他 stands for other tree species. 表 2 蒙古栎次生林林分基本信息Table 2. General information of oak secondary forest样地号
Sample plot No.胸径 DBH/cm 树高 Tree height/m 优势平均高
Mean dominant height/m蓄积
Volume/m3最小 Min. 平均 Average 最大 Max. 最小 Min. 平均 Average 最大 Max. 1 5.0 14.6 66.0 2.0 11.0 29.6 22.2 150.72 2 5.0 13.7 59.1 0.5 11.2 24.1 21.5 162.31 3 5.0 13.0 55.7 1.3 10.25 28.5 21.6 172.00 4 5.0 13.6 50.2 1.5 10.9 25.8 21.2 176.10 5 5.0 13.1 50.9 1.5 8.9 22.4 21.5 162.30 6 5.0 12.8 58.5 3.2 11.5 31.1 22.2 173.91 7 5.0 14.3 52.2 1.4 9.8 24.9 21.8 154.45 8 5.0 14.3 70.1 3.1 12.6 24.2 22.9 179.20 9 5.0 14.1 58.2 2.2 11.0 26.5 22.7 186.90 注:采用汪清林业局一元立木材积表[28]计算单木材积和林分蓄积,选取样地最高的5株林木计算优势高平均值。Notes: volume of wood was calculated by the tree volume table of Wangqing Forestry Bureau, and the mean dominant height was calculated by choosing five highest trees in each sample plot. 在完成上述因子调查后采取完全随机区组设计,确保随机区组后各组林分的基本特征没有显著差异。试验设置3种处理,3次重复,共9块固定监测样地。3种处理包括:(1)传统经营,即T1处理(1、5、7号样地),遵循《森林抚育规程》(GB/T15781-2009)的规定进行抚育间伐设计,采伐强度控制在25%以下,采伐对象主要是生长不良的林木,伐后郁闭度在0.6以上;(2)目标树经营密度1,即T2处理(2、4、9号样地),按照目标树单株木集约经营理念制定采伐设计,用材目标树选取密度约为70株/hm2,将影响目标树生长的林木确定为干扰木并进行采伐;(3)目标树经营密度2,即T3处理(3、6、8号样地),用材目标树选取密度为100株/hm2,其余措施与T2一致。采伐前林木分布如图1所示。干扰树采伐与传统采伐的根本区别在于采伐对象不同,常规采伐主要是针对没有培育前途的林木,多是林分中密度过大,质量低劣的林木,而干扰树采伐的对象是影响用材目标树生长的林木,可能是林层中的优势木和亚优势木,对不影响目标树生长的其他林木不采取任何措施。
考虑到样地边缘林木的相邻木可能处于边界以外,空间结构单元并不完整[29],为消除边缘效应,将样地距离边界线5 m以内的林木作为缓冲区林木,只作为相邻木来参与计算。其他区域视为核心区(90 m × 90 m),计算核心区内每株林木的空间结构参数。本研究以任一中心木和其周围的4株最近的相邻木组成空间结构单元,以此来计算空间结构指标[30]。
1.3 分析方法
1.3.1 空间结构综合指数
森林空间结构的研究主要集中在3个方面[31]:(1)树种空间隔离程度,即不同树种的混交程度;(2)林木间的竞争状况,也即立木的大小差异程度和密集程度;(3)林木的空间分布格局,也即林木在地面上的空间分布形式,这3个方面构成了森林结构的三要素。目前评价林分空间结构的指标很多,但许多指标之间存在重复,综合计算时难以科学界定权重。一些学者提出了基于相邻木关系的混交度(M)、大小比数(U)和角尺度(W)3个指标,这3个指标便于计算,可以较完整的表达出单木和林分的空间结构,在国内外应用广泛,效果较好[32−36]。但这3个指标都与距离无关,假如2株参照木周围分布的相邻木在树种混交、大小差异程度以及空间分布形式上均一致,但相邻木与参照木的距离不同,这时如果只采用这3个指标就会对空间结构造成误判,误认为2株参照木的空间结构一致。为解决这一问题,胡艳波等[37]在基于空间结构单元的基础上,提出了密集度(C)的概念。密集度直观表达了林分的疏密程度,也反映了林木间的竞争情况。
本文采用以上4个指标,在董灵波等[38]提出的天然林空间结构指数的基础上进行了修改。以W、U、M和C为“投入”,将林分的空间结构作为“产出”构建了空间结构综合指数(CSSI)。结合4个空间结构指标的定义,可以认为林分的M越大,U和C越小,角尺度中等的条件下林分的空间结构最佳(CSSI = 100),鉴于U和C均是体现林木竞争关系的指标,因此两者权重各取50%来作为“投入”。函数表达式如下:
CSSI=3√¯M(100−2×|¯W−50|)×√(100−¯U)(100−¯C) (1) 式中:
CSSI 为空间结构综合指数,¯M 、¯W 、¯U 、¯C 分别为林分平均混交度、平均角尺度、平均大小比数和平均密集度。本研究中0 ≤ CSSI ≤ 100,0 ≤¯M ≤ 100,0 ≤¯U ≤ 100,0 ≤¯W ≤ 100,0 ≤¯C ≤ 100。1.3.2 混交度
本研究采用混交度(M)表示树种空间隔离程度,其概念是由Gadow[39]和Füldner[40]提出的,定义为参照树i周围4株相邻木j中与其不是同一树种的个体所占的比例。认为林分的稳定性与M呈正相关关系。计算公式如下[8]:
Mi=144∑j=1vij (2) 式中:
Mi 为第i株个体的混交度,vij 表示参照木与相邻木的树种是否相同,如相同,则vij = 0;反之则为1。林分的平均混交度
¯M 计算公式如下:¯M=1NN∑i=1Mi (3) 式中:
N 为林分中消除边缘效应后的有效个体数量。1.3.3 角尺度
本研究选用角尺度(
W )来对林木空间分布格局进行计算,角尺度表示参照树i 周围的相邻木的均匀性,其定义是任意两株相邻木与参照木构成的夹角α小于标准角α0(α0 = 72°)的个数占相邻木(n )的比例,公式如下[41−43]:Wi=1nn∑j=1Zij (4) 式中:
Zij 表示夹角α是否小于标准角α0,当第j 个α角小于标准角α0时,Zij = 1,反之为0。用
¯W 表示林分整体的平均角尺度,当¯W < 0.475时林分为均匀分布,¯W ∈[0.475,0.517]时为随机分布,当¯W > 0.517时为聚集分布。1.3.4 大小比数
本文采用大小比数(
U )来表示林木间的大小差异程度及空间优势程度,选用胸径作为比较指标。计算公式如下[44]:Ui=14n∑j=1kij (5) 式中:
Ui 表示比参照木大的相邻木数量所占4株最近相邻木的比例,kij 表示参照木与相邻木的大小,如果参照木i 比相邻木j 大,那么kij=0 ;反之则为1。由定义可知,Ui 值越小,参照木的优势越明显,林分的平均大小比数用¯U 来表示。1.3.5 密集度
本研究采用密集度(
C )来表示林木的密集程度,其定义为所考察的相邻木与参照木树冠相接的株数的比例,计算公式为[37]:Ci=144∑j=1yij (6) 式中:
yij 表示参照树i与相邻木j的树冠投影是否重叠,重叠时yij 取值为1,反之为0。密集程度的高低反映了林木间的竞争程度,当计算林分密集度时将格局因子考虑进去,计算公式为:
¯C=1nn∑i=1CiλWi (7) 式中:
λWi 为格局权重因子,其赋值由林木的角尺度取值所决定。¯C 值与林分的密集程度呈正相关关系。2. 结果与分析
2.1 目标树结构单元的空间结构指标
T2、T3样地干扰树采伐前后目标树结构单元的混交度(M)、角尺度(W)、大小比数(U)和密集度(C)均值如表3所示。采伐干扰树后,目标树的M平均值提高,空间隔离程度增大,T3的提升幅度略高于T2。T2、T3目标树结构单元的W平均值都大于0.5,干扰树间伐对目标树的W均值影响不大:T3目标树W平均值略有上升,更趋向聚集分布;T2则有所下降,趋近随机分布。表明林木空间分布格局对干扰树采伐的响应具有不确定性。
表 3 采伐前后目标树结构单元的各个空间结构指标Table 3. Spatial structure indexes of target trees before and after thinning抚育间伐方式
Thinning treatment类型
TypeM平均值
Mean uniform angle indexW平均值
Mean neighborhood patternU平均值
Mean uniform angel indexC平均值
Mean crowding degreeT2 伐前 Before thinning 0.615 5 0.529 2 0.184 0 0.415 1 伐后 After thinning 0.638 3 0.524 1 0.177 7 0.409 4 T3 伐前 Before thinning 0.509 9 0.533 2 0.226 7 0.407 4 伐后 After thinning 0.529 7 0.536 0 0.216 7 0.395 3 注:M代表混交度;W代表角尺度;U代表大小比数;C代表密集度;T2代表目标树经营密度1;T3代表目标树经营密度2。下同。Notes: M represents for mingling degree, W represents for uniform angel index, U represents for neighborhood comparison, C represents for crowding degree, T2 represents for target tree management with density 1, T3 represents for target tree management with desity 2. Same as below. 目标树的
U 平均值在0.2左右,这是由于目标树选取的大都是优势木,竞争力较强。目标树结构单元的U 平均值均有一定程度的下降,说明干扰树间伐提高了目标树的空间优势度以及大小分化程度,T3的下降幅度大于T2。目标树结构单元的C 平均值都有所下降,T3下降幅度最大。U 和C 的变化说明干扰树采伐降低了目标树结构单元的竞争压力。2.2 林分树种空间隔离程度
不同抚育间伐方式林分采伐前后M分布及林分平均混交度(
¯M )的变化情况如表4所示。3种抚育间伐后样地中零度混交的林木比例下降,极强度混交的林木比例上升,¯M 都有所提高。其中T3处理后¯M 提升幅度略高于T2,T3和T2处理后¯M 提升幅度均显著高于T1,说明相对于传统经营采取的抚育间伐,以培育目标树为导向的干扰树间伐更有利于提高林分混交度,改善林分树种间隔离程度。表 4 不同抚育间伐方式林分采伐前后M 频率分布及林分平均混交度(¯M )Table 4. M frequency distribution and mean mingling degree of different thinning treatments before and after thinning抚育间伐方式
Thinning treatment伐前 Before thinning 伐后 After thinning 频率分布 Frequency distribution ¯M 频率分布 Frequency distribution ¯M 0.00 0.25 0.50 0.75 1.00 0.00 0.25 0.50 0.75 1.00 T1 0.159 2 0.190 1 0.242 1 0.248 0 0.160 5 0.515 1 0.150 3 0.192 0 0.252 7 0.243 3 0.161 7 0.518 5 T2 0.071 0 0.173 1 0.250 0 0.277 9 0.228 0 0.604 7 0.062 3 0.165 3 0.253 9 0.289 5 0.229 0 0.614 4 T3 0.107 9 0.193 9 0.258 5 0.255 1 0.184 6 0.553 7 0.092 2 0.194 5 0.267 3 0.259 2 0.186 9 0.563 5 注:T1代表传统经营措施。Note: T1 represents for traditional management. 2.3 林分空间分布格局
不同抚育间伐方式林分采伐前后的
W 分布及林分平均角尺度(¯W )的变化情况如表5所示。3种处理下,采伐前后¯W 均大于0.517,说明林分的空间分布格局呈聚集分布。W 取值为0.5的林木比例高于50%,说明大多数林木呈随机分布,3种处理的抚育间伐均降低了林分中绝对聚集分布的林木比例。T1、T2、T3处理采伐后¯W 更靠近随机分布的取值范围,林分空间分布格局趋向合理。3种处理对林分空间分布格局的改善情况为T2 > T3 > T1,其中T2和T3的改善程度显著优于T1。说明相对于传统经营采取的抚育间伐,以培育目标树为导向的干扰树间伐更有利于改善林分的空间分布格局。表 5 不同抚育间伐方式林分采伐前后W 频率分布及林分平均角尺度(¯W )Table 5. W frequency distribution and mean value of stand uniform angel index of different thinning treatments before and after thinning抚育间伐方式
Tninning treatment伐前 Before thinning 伐后 After thinning 频率分布 Frequency distribution ¯W 频率分布 Frequency distribution ¯W 0.00 0.25 0.50 0.75 1.00 0.00 0.25 0.50 0.75 1.00 T1 0.005 9 0.167 8 0.553 3 0.196 1 0.077 0 0.542 6 0.006 7 0.165 1 0.558 6 0.196 8 0.072 8 0.540 9 T2 0.003 6 0.179 9 0.580 9 0.163 7 0.071 9 0.530 1 0.004 2 0.185 0 0.583 6 0.165 3 0.061 8 0.523 9 T3 0.004 9 0.164 2 0.578 2 0.191 4 0.061 2 0.535 0 0.006 1 0.168 0 0.584 5 0.184 3 0.057 0 0.529 5 2.4 林分大小分化程度
不同抚育间伐方式林分采伐前后的
U 分布及林分平均大小比数(¯U )变化情况如表6所示。T1、T2、T3处理的¯U 均接近0.5,说明整体大小分化程度和优势度都接近于中等水平。且U 各个取值的林木分布频率相对一致,都在20%左右。采伐后U 为0的林木比例增加,其他取值的频率分布变化无明显规律。总体上讲,3种抚育间伐对林分的大小分化度影响不大,T1、T3处理后¯U 的大小比数平均值略有下降,T2基本无变化。表 6 不同抚育间伐方式林分采伐前后U 频率分布及林分平均大小比数(¯U )Table 6. U frequency distribution and mean value of neighborhood comparison of different thinning treatments before and after thinning抚育间伐方式
Thinning treatment伐前 Before thinning 伐后 After thinning 频率分布 Frequency distribution ¯U 频率分布 Frequency distribution ¯U 0.00 0.25 0.50 0.75 1.00 0.00 0.25 0.50 0.75 1.00 T1 0.207 2 0.196 1 0.205 9 0.194 7 0.196 1 0.494 1 0.212 3 0.196 8 0.202 2 0.195 4 0.193 4 0.490 2 T2 0.207 7 0.204 6 0.194 2 0.192 0 0.201 4 0.493 7 0.209 8 0.197 2 0.201 4 0.190 6 0.200 9 0.493 9 T3 0.204 6 0.206 5 0.191 9 0.201 2 0.195 8 0.494 3 0.209 8 0.201 6 0.193 0 0.198 6 0.197 0 0.492 9 2.5 林分密集程度
不同抚育间伐方式下林分采伐前后的
C 分布及林分平均密集度(¯C )均值变化情况如表7所示,T1、T2、T3处理样地中C 取值为1.0的树木所占比例最大,说明林木很密集的结构单元较多。3种处理下¯C 都有不同程度的下降,下降幅度从高到底依次是T3、T2、T1。所有样地中C 取值为0、0.25、0.50的林木比例上升,C 取值为1的林木比例下降,说明林分的密集程度得到了改善,由很密集逐渐向比较密集过渡。表 7 不同抚育间伐方式林分采伐前后C 频率分布及林分平均密集度(¯C )Table 7. C frequency distribution and mean value of crowding degree of different thinning treatments before and after thinning抚育间伐方式
Thinning treatment伐前 Before thinning 伐后 After thinning 频率分布 Frequency distribution ¯C 频率分布 Frequency distribution ¯C 0.00 0.25 0.50 0.75 1.00 0.00 0.25 0.50 0.75 1.00 T1 0.059 9 0.138 8 0.166 4 0.221 7 0.413 2 0.338 3 0.063 3 0.140 8 0.175 2 0.217 0 0.403 6 0.336 3 T2 0.021 6 0.072 4 0.141 2 0.216 3 0.548 6 0.391 8 0.023 9 0.078 2 0.158 3 0.221 5 0.518 0 0.389 3 T3 0.018 5 0.074 8 0.163 8 0.221 1 0.521 9 0.384 1 0.021 9 0.080 4 0.183 3 0.235 7 0.478 6 0.378 1 2.6 空间结构综合指数
以上4个森林空间结构指标从不同角度说明了常规经营和目标树经营的抚育间伐对单木及林分的影响,但所得出的最优抚育间伐方式的结论并不统一。因此用空间结构综合指数(CSSI)计算各个指标的综合值,为评判森林经营措施的优劣提供直接依据。图2展示了3种抚育间伐处理下CSSI的变化。
![]() 图 2 林分空间结构综合指数(CSSI)变化情况Figure 2. Changes of comprehensive index of spatial structure (CSSI)
图 2 林分空间结构综合指数(CSSI)变化情况Figure 2. Changes of comprehensive index of spatial structure (CSSI)由图2可以看出,3种抚育间伐措施后,CSSI都得以提高,林分空间结构均有不同程度的优化,说明抚育间伐没有破坏样地中林木的空间结构情况,而是促使其更加合理。T1、T2、T3措施下CSSI的增加量分别为0.51%、1.04%和1.19%,表明基于目标树经营的抚育间伐对林分空间结构的改善情况优于传统抚育间伐,T2处理对林分的优化程度略高于T3。
3. 讨 论
相关研究表明目标树经营对促进林木生长、物种多样性并改善群落结构有积极的作用[45−47]。本研究结果表明干扰树间伐对蒙古栎次生林目标树以及林分的空间结构都有改善作用,且影响效果优于传统的抚育间伐,说明目标树经营是合理且成功的措施,与陈科屹等[48]的研究结果一致。
抚育间伐对目标树及林分林木分布格局的影响并不统一,这与吴建强等[49]的研究结果一致。认为林木分布格局具有一定的规律性,无论初始如何分布,最后都会有聚集分布转为随机分布,随机分布转为均匀分布的趋势[50−51]。大小比数这一空间结构指标在分析目标树抚育间伐前后大小分化程度时变化趋势明显,而抚育间伐前后林分的大小分化程度变化具有一定的不确定性。这与李建等[17]、赵中华等[52]的研究结果一致:大小比数更适合用于研究种群间的大小分化程度,从而确定某个或是几个种群的优势度。
本文中各个指标以及空间结构综合指数的变化幅度不大,且T2、T3差别较小。这可能是由于以下两个方面的原因:(1)研究结果体现的是蒙古栎次生林采伐初期的空间结构状况,部分林分空间结构对抚育间伐的响应需要较长时间;(2)本研究所选取的蒙古栎次生林处于中龄阶段,原则上已经晚于标准的选取目标树的时间,而此时的干扰树也较大,采伐后可能会对林分造成过大的扰动,为避免这种情况,本次抚育间伐的强度均控制在10%以内。对于之前未经过持续间伐的蒙古栎中龄林来说,为目标树生长释放足够的空间可能需要更高的采伐强度。
影响森林空间结构的因素很复杂,指标也很多,目前尚未有大家公认的统一的评价方法。本研究中所构建的林分空间综合指数是基于林分空间结构研究的3个方面和常用的4个指标,且认为林木空间分布格局、林木竞争关系与林分中间隔离程度对空间结构的贡献是相同的,这与董灵波等[38]、李建军等[53]的研究结果相一致,与曾群英等[54]、胡艳波等[55]提出的结构参数的决策优先性不一致。曹小玉等[16]认为林分的垂直结构参数近年来也被广泛研究,但鉴于研究区所在地为温带地区,林层结构相对单一,抚育间伐后的变化微乎其微,因此本研究所采用的空间结构评价指标未考虑垂直结构参数。如何加入其他表征空间结构合理指标,以及这些指标间如何进行联立值得更深入的研究。
本文侧重基于目标树经营和传统经营的抚育间伐对空间结构的初期效应,而这种初期效应可以持续多久,以及不同的抚育间伐方式和强度对森林空间结构和其他特征指标的长期影响,都值得进一步研究,为蒙古栎次生林的经营提供指导和依据。
4. 结 论
从目标树空间结构的变化来看,干扰树采伐后目标树的种间隔离程度、大小分化程度和密集程度3个方面明显改善,林木空间分布格局的变化不明显。从林分的空间结构变化来看,3种抚育间伐均提高了林分内种间隔离程度、降低了密集度,使林分空间分布格局趋向于随机分布。通过空间结构综合指数的分析来看,3种抚育间伐均对林分空间结构的改善起到了积极作用,其中基于目标树经营的抚育间伐对林分的综合空间结构改善效果要优于传统经营的抚育间伐。T3处理,即目标树选择密度约为100 株/hm2情况下采取的抚育间伐最有利于优化林分的空间结构,据此建议蒙古栎次生林可以选择目标树经营体系作业,目标树选择密度约为100 株/hm2。
-
![]()
图 1 不同林龄和土层土壤微生物生物量变化特征
Figure 1. Characterization of soil microbial biomass changes in different stand ages and soil layers
![]()
图 2 不同林龄和土层土壤养分和微生物生物量化学计量比变化特征
Figure 2. Characteristics of changes in stoichiometric ratios of soil nutrients and microbial biomass in different stand ages and soil layers
![]()
图 3 不同林龄和土层桉树人工林土壤细菌群落α-多样性变化特征
Figure 3. Characteristics of changes in α-diversity of soil bacterial communities in eucalyptus plantation of different stand ages and soil layers
![]()
图 4 不同林龄和土层土壤细菌门和属水平群落组成
Figure 4. Soil bacterial community composition at phylum and genus levels in different ages and soil layers
![]()
图 5 桉树人工林细菌群落门、属水平共现网络分析
节点根据相对丰度前10的门水平和属水平着色。P'.正相关系数;N.负相关系数。Nodes are colored according to top 10 relative abundance at phylum and genus levels. P', positive correlation coefficient; N, negative correlation coefficient.
Figure 5. Co-occurrence network analysis at phylum and genus levels of bacterial communities in eucalyptus plantation
![]()
图 6 基于ASV功能预测信息表的细菌功能随林龄增长变化特征
选取前10功能基因丰度作图。The top 10 functional gene abundances are selected for mapping.
Figure 6. Characteristics of bacterial function with age based on ASV function prediction information table
![]()
图 7 土壤细菌门水平组成与细菌功能的关系
Figure 7. Relationship between soil bacterial composition at phylum level and bacterial function
![]()
图 8 土壤因子、微生物生物量与土壤细菌门水平的相关性分析
Figure 8. Correlation analysis of soil factors, microbial biomass, and soil bacterial at phylum level
表 1 不同林龄和土层土壤理化性质的变化特征
Table 1 Characteristics of changes in soil physicochemical properties in different ages and soil layers
林龄/a
Stand
age/yearSWC/% pH TOC/(g·kg−1) TN/(g·kg−1) DOC/(mg·kg−1) DON/(mg·kg−1) TP/( g·kg−1) AP/(mg·kg−1) 0 ~
20 cm20 ~
40 cm0 ~
20 cm20 ~
40 cm0 ~
20 cm20 ~
40 cm0 ~
20 cm20 ~
40 cm0 ~
20 cm20 ~
40 cm0 ~
20 cm20 ~
40 cm0 ~
20 cm20 ~
40 cm0 ~
20 cm20 ~
40 cm1 17.81 ±
0.03 a*16.10 ±
0.01 b3.54 ±
0.07a*3.26 ±
0.09 b32.08 ±
7.27 a***9.88 ±
3.18 b2.91 ±
0.24 a***0.72 ±
0.05 ab215.08 ±
52.53 a***147.88 ±
28.57 b37.23 ±
3.45 a***17.34 ±
2.2 ab0.30 ±
0.03 b***0.17 ±
0.04 b7.93 ±
0.34 b***3.12 ±
0.54 c2 18.35 ±
0.02 a*16.34 ±
0.01 b3.46 ±
0.06 ab3.47 ±
0.19 ab18.20 ±
2.46 bc***7.45 ±
1.83 bc2.16 ±
0.17 ab***0.91 ±
0.30 a208.55 ±
7.12 a***144.73 ±
14.93 b29.45 ±
2.56 b***15.23 ±
3.36 b0.38 ±
0.02 a***0.26 ±
0.07 a8.46 ±
0.32 a***3.01 ±
0.22 c3 19.21 ±
0.01 a*18.59 ±
0.01 a3.56 ±
0.12 a3.53 ±
0.23 a18.47 ±
3.29 bc***7.45 ±
0.21 bc1.79 ±
0.11 b***0.63 ±
0.08 b158.17 ±
10.71 c214.76 ±
53.03 a**28.70 ±
3.00 b***12.78 ±
1.78 bc0.31 ±
0.04 b***0.14 ±
0.02 c8.11 ±
0.10 ab***4.40 ±
0.07 b5 13.47 ±
0.02 b16.44 ±
0.02 b*3.52 ±
0.06 a3.51 ±
0.11 a21.10 ±
3.3 b***10.41 ±
2.34 ab1.78 ±
0.35 b***0.58 ±
0.12 b183.07 ±
9.28 ab**133.11 ±
17.55 b31.66 ±
5.64 ab***14.51 ±
2.96 b0.20 ±
0.04 c0.28 ±
0.05a*8.02 ±
0.10 ab***4.23 ±
0.39 b7 14.98 ±
0.19 b*13.28 ±
0.01 c3.27 ±
0.12 b3.37 ±
0.08 b22.79 ±
4.75 ab***12.98 ±
2.23 a2.34 ±
0.37ab***0.89 ±
0.35a220.37 ±
49.03a191.85 ±
9.13a33.11 ±
4.21a***20.45 ±
4.33 a0.29 ±
0.04 b*0.21 ±
0.02 a8.28 ±
0.13 ab***4.70 ±
0.21 a注:不同小写字母表示不同林龄之间有显著差异(P < 0.05);*、**和*** 表示不同土层之间存在显著差异,显著性分别为P < 0.05、P < 0.01 和 P < 0.001。SWC.土壤含水率;pH.土壤酸碱度;TOC.总有机碳;TN.全氮;DOC.可溶性有机碳;DON.可溶性有机氮;TP.全磷;AP.有效磷。下同。Notes: different lowercase letters indicate significant differences (P < 0.05) between varied stand ages; *, ** and *** indicate significant differences between varied soil horizons, with significance of P < 0.05, P < 0.01 and P < 0.001, respectively. SWC, soil water content; pH, soil acidity and alkalinity; TOC, total organic carbon; TN, total nitrogen; DOC, dissolved organic carbon; DON, dissolved organic nitrogen; TP, total phosphorus; AP, effective phosphorus. Same as below.  下载: 导出CSV
表 2 桉树人工林土壤细菌门和属水平的共现网络参数
Table 2 Co-occurrence network parameters at phylum and genus levels for soil bacteria in eucalyptus plantation
林龄/a
Stand
age/year水平
Level边
Edge节点
Node平均聚类系数
Average clustering
coefficient网络直径
Network
diameter图密度
Graph
density路径平均长度
Average path
length平均加权度
Average
weighting模块化
Modularized1 门
Phylum7 353 300 0.597 7 0.164 2.449 49.020 0.378 2 4 544 300 0.517 8 0.103 2.358 30.497 0.330 3 6 861 300 0.630 7 0.200 2.348 59.463 0.288 5 6 238 300 0.569 6 0.140 2.537 41.726 0.350 7 7 746 300 0.613 6 0.174 2.675 51.813 0.414 1 属
Genus6 016 300 0.602 6 0.137 2.494 40.843 0.438 2 4 262 300 0.597 6 0.096 2.576 28.508 0.345 3 6 327 300 0.659 8 0.145 2.448 43.467 0.338 5 4 898 300 0.567 5 0.109 2.638 32.653 0.376 7 6 520 300 0.608 6 0.142 2.452 42.321 0.429
下载: 导出CSV
-
[1] Cui Y, Fang L, Guo X, et al. Responses of soil microbial communities to nutrient limitation in the desert-grassland ecological transition zone[J]. Science of the Total Environment, 2018, 642(1): 45−55.
[2] Barona Y M, Phillips R, Milo R. The biomass distribution on Earth[J]. Proceedings of the National Academy of Sciences of the United States of America, 2018, 115(25): 6506−6511.
[3] Wang Z, Wang H, Chen Z, et al. Ecological niche differences regulate the assembly of bacterial community in endophytic and rhizosphere of Eucalyptus[J/OL]. Forest Ecology and Management, 2022, 524: 120521[2024−05−27]. https://doi.org/10.1016/j.foreco.2022.120521.
[4] 毛晓雅, 刘晋仙, 贾彤, 等. 芦芽山华北落叶松林土壤剖面细菌群落分布格局[J]. 环境科学, 2023, 44(6): 3376−3385. Mao X Y, Liu J X, Jia T, et al. Distribution pattern of bacterial community in soil profile of Larix principis-rupprechtii forest in Luya Mountain[J]. Environmental Science, 2023, 44(6): 3376−3385.
[5] Hu W, Ran J, Dong L, et al. Aridity-driven shift in biodiversity-soil multifunctionality relationships[J]. Nature Communications, 2021, 12(1): 5350[2024−02−12]. https://doi.org/10.1038/s41467-021-25641-0.
[6] 张健飞, 王淳, 徐雯雯, 等. 华北落叶松不同代际人工林土壤养分及细菌群落变化特征[J]. 北京林业大学学报, 2020, 42(3): 36−45. Zhang J F, Wang C, Xu W W, et al. Changes in soil nutrients and bacterial communities of Larix principis-rupprechtii plantations of different generations[J]. Journal of Beijing Forestry University, 2020, 42(3): 36−45.
[7] 李娜, 王宝荣, 安韶山, 等. 黄土高原草地土壤细菌群落结构对于降水变化的响应[J]. 环境科学, 2020, 41(9): 4284−4293. Li N, Wang B R, An S S, et al. Response of soil bacterial community structure to precipitation change in grassland of Loess Plateau[J]. Environmental Science, 2020, 41(9): 4284−4293.
[8] 杨安娜, 李曾燕, 牟凌, 等. 上海大金山岛不同植被类型土壤细菌群落的变异[J]. 植物生态学报, 2024, 48(3): 377−389. Yang A N, Li Z Y, Mou L, et al. Variation in soil bacterial community across vegetation types in Dajinshan Island, Shanghai[J]. Chinese Journal of Plant Ecology, 2024, 48(3): 377−389.
[9] Ma X D, Qu H T, Liao S M, et al. Changes in assembly processes and differential responses of soil microbial communities during mining disturbance in mining reclamation and surrounding grassland[J/OL]. Catena, 2023, 231: 107332[2024−02−12]. https://doi.org/10.1016/j.catena.2023.107332.
[10] 高禾苗, 任爱天, 张绍聪, 等. 西藏高原不同树龄核桃林土壤细菌多样性及其影响因素分析[J]. 北京林业大学学报, 2023, 45(11): 100−109. doi: 10.12171/j.1000-1522.20230051 Gao H M, Ren A T, Zhang S C, et al. Soil bacterial diversity and its influencing factors of walnut forests with different stand ages in Xizang Plateau of northwestern China[J]. Journal of Beijing Forestry University, 2023, 45(11): 100−109. doi: 10.12171/j.1000-1522.20230051
[11] Gong X, Jarvie S, Wen J, et al. Compared with soil fungal diversity and microbial network complexity, soil bacterial diversity drives soil multifunctionality during the restoration process[J/OL]. Journal of Environmental Management, 2024, 354: 120379[2024−02−17]. https://doi.org/10.1016/j.jenvman.2024.120379.
[12] 李媛媛, 徐婷婷, 艾喆, 等. 不同海拔鬼箭锦鸡儿根际和非根际土壤细菌群落多样性及PICRUSt功能预测[J]. 环境科学, 2023, 44(4): 2304−2314. Li Y Y, Xu T T, Ai Z, et al. Diversity and predictive functional of Caragana jubata bacterial community in rhizosphere and non-rhizosphere soil at different altitudes[J]. Environmental Science, 2023, 44(4): 2304−2314.
[13] 杨钙仁, 张秀清, 蔡德所, 等. 广西主要人工林凋落物分解过程及其对淋溶水质的影响[J]. 应用生态学报, 2012, 23(1): 9−16. Yang G R, Zhang X Q, Cai D S, et al. Litter decomposition of dominant plantations in Guangxi and its effects on leachate quality[J]. Chinese Journal of Applied Ecology, 2012, 23(1): 9−16.
[14] Yao X Y, Zhang Q C, Zhou H J, et al. Introduction of Dalbergia odorifera enhances nitrogen absorption on Eucalyptus through stimulating microbially mediated soil nitrogen-cycling[J]. Forest Ecosystems, 2021, 8(1): 1−12. doi: 10.1186/s40663-020-00279-4
[15] 段春燕, 何成新, 徐广平, 等. 桂北不同林龄桉树人工林土壤养分及生物学特性[J]. 热带作物学报, 2019, 40(6): 1213−1222. doi: 10.3969/j.issn.1000-2561.2019.06.025 Duan C Y, He C X, Xu G P, et al. Soil nutrients and biological characteristics in Eucalyptus plantations of different planting ages at north Guangxi[J]. Chinese Journal of Tropical Crops, 2019, 40(6): 1213−1222. doi: 10.3969/j.issn.1000-2561.2019.06.025
[16] 竹万宽, 许宇星, 王志超, 等. 不同生长阶段尾巨桉人工林土壤–微生物化学计量特征[J]. 浙江农林大学学报, 2021, 38(4): 692−702. doi: 10.11833/j.issn.2095-0756.20200536 Zhu W K, Xu Y X, Wang Z C, et al. Soil-microbial stoichiometry of Eucalyptus urophylla × E. grandis plantation at different growth stages[J]. Journal of Zhejiang A & F University, 2021, 38(4): 692−702. doi: 10.11833/j.issn.2095-0756.20200536
[17] 兰秀, 刘永贤, 宋同清, 等. 广西不同龄级桉树人工林植被与土壤特征及相关分析[J]. 中南林业科技大学学报, 2022, 42(7): 127−136. Lan X, Liu Y X, Song T Q, et al. Characteristics and correlation analysis of vegetation and soil of Eucalyptus plantations of different ages in Guangxi[J]. Journal of Central South University of Forestry & Technology, 2022, 42(7): 127−136.
[18] 郭文, 高李文, 彭紫薇, 等. 不同林龄杉木根际与非根际土壤微生物群落特征[J]. 水土保持研究, 2022, 29(6): 260−267. Guo W, Gao L W, Peng Z W, et al. Characteristics of microbial community in rhizosphere and non-rhizophere soil of Cunninghamia lanceolata plantation with different stand ages[J]. Research of Soil and Water Conservation, 2022, 29(6): 260−267.
[19] 赵子麒, 李一华, 黄康庭, 等. 桉树人工林土壤细菌群落对不同免炼山林地更新模式的季节动态响应[J]. 中南林业科技大学学报, 2022, 42(3): 39−52. Zhao Z Q, Li Y H, Huang K T, et al. Seasonal dynamic response of soil bacterial community of Eucalyptus plantation to different without slash-burning woodland renewal models[J]. Journal of Central South University of Forestry & Technology, 2022, 42(3): 39−52.
[20] 鲍士旦. 土壤农化分析[M]. 3版. 北京: 中国农业出版社, 2000. Bao S D. Soil and agricultural chemistry analysis[M]. 3rd ed. Beijing: China Agriculture Press, 2000.
[21] Edwards K A, Jefferies R L. Inter-annual and seasonal dynamics of soil microbial biomass and nutrients in wet and dry low-Arctic sedge meadows[J]. Soil Biology & Biochemistry, 2013, 57: 83−90.
[22] 李万年, 黄则月, 赵春梅, 等. 望天树人工幼林土壤微生物量碳氮及养分特征[J]. 北京林业大学学报, 2020, 42(12): 51−62. doi: 10.12171/j.1000-1522.20200191 Li W N, Huang Z Y, Zhao C M, et al. Characteristics of soil microbial biomass C, N and nutrients in young plantations of Parashorea chinensis[J]. Journal of Beijing Forestry University, 2020, 42(12): 51−62. doi: 10.12171/j.1000-1522.20200191
[23] 李炎龙, 季荣博, 吴云, 等. 我国北方3种典型土壤–作物体系中微生物量磷库特征[J]. 生态学报, 2022, 42(8): 3325−3332. Li Y L, Ji R B, Wu Y, et al. Soil microbial biomass phosphorus pool in farmlands of the Northern China[J]. Acta Ecologica Sinica, 2022, 42(8): 3325−3332.
[24] Doyle J J. A rapid DNA isolation procedure for small quantities of fresh leaf tissue[J]. Phytochemical Bulletin, 1987, 19(1): 11−15.
[25] Lan Y H, Wang S Q, Zhang H, et al. Intercropping and nitrogen enhance eucalyptus productivity through the positive interaction between soil fertility factors and bacterial communities along with the maintenance of soil enzyme activities[J]. Land Degradation & Development, 2023, 34(8): 2403−2417.
[26] 闫冰, 付嘉琦, 夏嵩, 等. 厌氧氨氧化启动过程细菌群落多样性及 PICRUSt2功能预测分析[J]. 环境科学, 2021, 42(8): 3875−3885. Yan B, Fu J Q, Xia S, et al. Diversity and PICRUSt2-based predicted functional analysis of bacterial communities during the start-up of ANAMMOX[J]. Environmental Science, 2021, 42(8): 3875−3885.
[27] Lee M H, Park J H, Matzner E. Sustained production of dissolved organic carbon and nitrogen in forest floors during continuous leaching[J]. Geoderma, 2018, 310(1): 163−169.
[28] Lan Y H, Zhang H, He Y Q, et al. Legume-bacteria-soil interaction networks linked to improved plant productivity and soil fertility in intercropping systems[J/OL]. Industrial Crops and Products, 2023, 196: 116504[2024−02−17]. https://doi.org/10.1016/j.indcrop.2023.116504.
[29] 焦宏哲, 李欢, 陈惠, 等. 氮沉降对杉木人工林土壤可溶性有机质数量和结构的影响[J]. 生态学报, 2021, 41(4): 1593−1602. Jiao H Z, Li H, Chen H, et al. Effects of nitrogen deposition on the quantity and structure of soil dissolved organic matter of Cunninghamia lanceolata plantations with different depths[J]. Acta Ecologica Sinica, 2021, 41(4): 1593−1602.
[30] Sanderman J, Baldock J A, Amundson R. Dissolved organic carbon chemistry and dynamics in contrasting forest and grassland soils[J]. Biogeochemistry, 2008, 89(2): 181−198. doi: 10.1007/s10533-008-9211-x
[31] Chung H, Zak D R, Reich P B, et al. Plant species richness, elevated CO2, and atmospheric nitrogen deposition alter soil microbial community composition and function[J]. Global Change Biology, 2007, 13(5): 980−989. doi: 10.1111/j.1365-2486.2007.01313.x
[32] 詹学齐. 马尾松林冠下套种阔叶树20年间土壤肥力变化[J]. 北京林业大学学报, 2018, 40(6): 55−62. Zhan X Q. Changes in soil fertility after interplanting pure Pinus massioniana plantations with broadleaved forest under the canopy during 20 years[J]. Journal of Beijing Forestry University, 2018, 40(6): 55−62.
[33] Xu Y X, Du A P, Wang Z C, et al. Effects of different rotation periods of Eucalyptus plantations on soil physiochemical properties, enzyme activities, microbial biomass and microbial community structure and diversity[J/OL]. Forest Ecology & Management, 2020, 456: 117683[2024−02−17]. https://doi.org/10.1016/j.foreco.2019.117683.
[34] Zhu L Y, Wang X H, Chen F F, et al. Effects of the successive planting of Eucalyptus urophylla on soil bacterial and fungal community structure, diversity, microbial biomass, and enzyme activity[J]. Land Degradation & Development, 2019, 30(6): 636−646.
[35] Li X G, Ding C F, Hua K, et al. Soil sickness of peanuts is attributable to modifications in soil microbes induced by peanut root exudates rather than to direct allelopathy [J/OL]. Soil Biology & Biochemistry, 2014, 78: 149−159[2014−07−19]. https://doi.org/10.1016/j.soilbio.2014.07.019.
[36] Delgado-Baquerizo M, Eldridge D J, Ochoa V, et al. Soil microbial communities drive the resistance of ecosystem multifunctionality to global change in drylands across the globe[J]. Ecology Letters, 2017, 20(10): 1295−1305. doi: 10.1111/ele.12826
[37] Dang P, Yu X, Le H, et al. Effects of stand age and soil properties on soil bacterial and fungal community composition in Chinese pine plantations on the Loess Plateau[J]. PLoS One, 2017, 12(10): 1−18.
[38] Kielak A M, Castellane T C L, Campanharo J C, et al. Characterization of novel Acidobacteria exopolysaccharides with potential industrial and ecological applications[J/OL]. Scientific Reports, 2017, 7: 41193[2017−01−24]. https://doi.org/10.1038/srep41193.
[39] Bashir S, Iqbal A, Hasnain S. Comparative analysis of endophytic bacterial diversity between two varieties of sunflower Helianthus annuus with their PGP evaluation[J]. Saudi Journal of Biological Sciences, 2020, 27(2): 720−726. doi: 10.1016/j.sjbs.2019.12.010
[40] Chen Y J, Neilson J W, Priyanka K, et al. Life-history strategies of soil microbial communities in an arid ecosystem[J]. The ISME Journal, 2021, 15(3): 649−657. doi: 10.1038/s41396-020-00803-y
[41] Dong X, Du X, Sun Z H, et al. Effects of residue retention and removal following thinning on soil bacterial community composition and diversity in a Larix olgensis plantation, Northeast China[J]. Forests 2021, 12(5): 559[2021−04−29]. https://doi.org/10.3390/f12050559.
[42] Liao Z X, Ye S M, Wang S Q. Soil bacterial community structure as affected by stand age in Chinese fir plantations: insights at the aggregate scale[J]. Land Degradation & Development [J]. 2023, 34(2): 389−402.
[43] Wang C, Masoudi A, Wang M, et al. Land-use types shape soil microbial compositions under rapid urbanization in the Xiong’an New Area, China[J/OL]. The Science of the Total Environment, 2021, 777: 145976[2021−02−27]. https://doi.org/10.1016/j.scitotenv.2021.145976.
[44] 蔡锰柯, 韩海荣, 程小琴, 等. 山西太岳山不同林龄华北落叶松林土壤微生物群落结构特征[J]. 北京林业大学学报, 2022, 44(5): 86−93. doi: 10.12171/j.1000-1522.20210132 Cai M K, Han H R, Cheng X Q, et al. Characteristics of soil microbial community structure with different plantation ages in larch forest in Taiyue Mountain of Shanxi Province, northern China[J]. Journal of Beijing Forestry University, 2022, 44(5): 86−93. doi: 10.12171/j.1000-1522.20210132
[45] 何中声, 谷新光, 江蓝, 等. 戴云山南坡不同海拔森林土壤优势细菌群落特征及影响因素[J]. 北京林业大学学报, 2022, 44(7): 107−116. doi: 10.12171/j.1000-1522.20200278 He Z S, Gu X G, Jiang L, et al. Characteristics and its influencing factors of forest soil dominant bacterial community in different elevations on the southern slope of Daiyun Mountain, Fujian Province of eastern China[J]. Journal of Beijing Forestry University, 2022, 44(7): 107−116. doi: 10.12171/j.1000-1522.20200278
[46] Navarrete A A, Kuramae E E, de Hollander M, et al. Acidobacterial community responses to agricultural management of soybean in Amazon forest soils[J]. FEMS Microbiology Ecology, 2013, 83(3): 607−621. doi: 10.1111/1574-6941.12018
-
期刊类型引用(1)
1. 周肖,陈昊,时映,陈烽,王叶,王垚,杨亮. 膨润土改性及其在缓释农药载体上的应用研究与展望. 植物医学. 2023(03): 31-40 .  百度学术
百度学术
其他类型引用(2)


计量
- 文章访问数: 235
- HTML全文浏览量: 27
- PDF下载量: 73
- 被引次数: 3
