
Biomass allocation patterns and allometric models of Ginkgo biloba
-
摘要: 以苏北地区银杏人工林为研究对象,选取13株进行整株挖掘,分析不同器官生物量的分配格局,以及地上和地下生物量之间的关系;再分别以胸径(D)、树高(H)、D2H、DaHb为自变量建立银杏各器官生物量模型,选择调整决定系数(Radj2)、残差平方和(SSE)、平均偏差(ME)、平均绝对偏差(MAE)和平均相对误差(MPE)作为选择最优模型的检验指标,根据检验结果筛选出各器官的最优模型。结果表明:13株银杏的整株生物量变化范围为28.50~320.27 kg,树干生物量占总生物量的49.4%~56.6%,树枝生物量占总生物量的12.1%~18.9%,树叶生物量占总生物量的3.8%~5.5%,根生物量占总生物量的26%;地上部分生物量与地下生物量线性方程的斜率为0.35,具有显著的线性相关性(P<0.01);枝和叶生物量都集中于树冠中部,树冠上层和下层的枝、叶生物量明显低于树冠中层生物量(P<0.05),上层和下层生物量之间差异不显著(P>0.05),70%根生物量集中0~1.0 m的土层;枝水平上,基于基径和枝长的枝生物量模型解释量超过95%;在各器官生物量最优模型选择上,以D为自变量的W=aDb的叶、枝、地上部分生物量模型要优于其他模型;树干、根和全株生物量则是以W=aDbHc模型最优。银杏各器官生物量表现为干>根>枝>叶,枝和叶生物量垂直分配上,中冠层占最大比例;基于树高和胸径的相对生长模型可以实现对银杏各器官生物量的准确拟合,银杏生物量及碳储量的有效估算。Abstract: Based on the Ginkgo biloba plantation in northern area of Jiangsu Province, eastern China, 13 sample trees with different diameters at breast height (DBH) were selected, and used to analyze the relationships between above- and below-ground biomass and their allocation patterns. At the individual tree level, allometric models for each component biomass were developed based on independent variables of DBH, tree height (H), D2H and DaHb. The best fitting models were identified by the fitting and test results of parameter estimation, the statistical parameters used in this paper were adjusted determination coefficient (Radj2), sum of squares for error (SSE), statistics estimating the standard deviation SEE, mean relative deviation (ME), mean relative deviation absolute (MAE), mean estimated error (MPE). The results showed that the whole variation range for plant biomass of the 13 ginkgo trees was 28.50-320.27 kg for each tree. Relative proportions of stem, branch, leaf, and root to total tree biomass were 49.4%-56.6%, 12.1%-18.9%, 3.8%-5.5%, and 26%, respectively. The aboveground biomass was significantly linearly correlated with belowground biomass. The slope of the fitted linear model was 0.35. Results showed that the majority leaf and branch biomass occurred in the middle canopy layers, with significant difference between the middle, upper and lower layers in combined biomass of leaves and branches, and there was no significance between upper and lower layers. For all sample trees, about 70% of roots were observed in the 0-1.0 m soil layer. With soil depth increasing, the root biomass decreased exponentially. At branch level, allometric models based on two variables (i.e. BD and BL) of branch biomass explained more than 95% of the variations in data. The results showed that D was a best independent variable in estimating the biomass of leaf, branch, aboveground section than the rest variables, and D-H was the best in estimating stem, root and total tree biomass. The mean value of proportion of different biomass components showed an order of stem > root > branch > leaf. The middle canopy layers occupied the maximum ratio in vertical and horizontal distribution of branch and leaf biomass, and these results were in consistence with the isometric biomass allocation theory. Allometric models based on independent variables of DBH, and H would be suitable for predicting the above- and below-ground component biomass of ginkgo, and the calculation of ginkgo biomass and carbon storage.
-
Keywords:
- biomass /
- allocation pattern /
- allometric model /
- ginkgo plantation
-
随着人们对食品安全关注度的提升,天然产品越来越受到人们的重视,从天然原料中寻找和开发活性成分逐渐成为学者的研究热点,其中天然色素因其安全性高、着色自然,常具有医药保健功能而受到人们更多的关注[1]。橡子是壳斗科(Fagaceae)植物果实的通称,我国是世界橡子的主要产地之一,拥有丰富的橡树资源,橡子的果实营养价值丰富,可加工成许多产品,然而橡子壳作为橡子加工副产物除了少部分用作活性炭加工外,大部分作为废弃物被直接抛弃或者焚烧,这不仅对环境造成了一定的污染,还是一种资源的浪费。研究表明,从橡子壳中提取的橡子壳色素是一种天然坚果果壳色素,是类似咖啡色的粉末状固体[2],可以用来代替焦糖色素,是一种优良的天然食用色素[3-4]。此外,橡子壳色素含有大量黄酮和多酚类物质,具有较好的抗肿瘤、抗突变、抑菌等作用[5],但是目前关于橡子壳色素的抗氧化活性的研究报道很少。抗氧化活性研究主要包括体外抗氧化活性和体内抗氧化活性研究[6]。本文以常见抗氧化剂Vc为对照,以还原力和1、1-二苯基苦基苯肼自由基清除率为考察指标,研究了橡子壳色素体外抗氧化作用;同时采用60Coγ射线辐照小鼠建立氧化损伤模型,测定小鼠血清中CAT活力、SOD活力、MDA的含量对橡子壳色素的体内抗氧化活性进行探究。通过对橡子壳色素体外和体内抗氧化活性的研究,可以为橡子壳色素作为天然抗氧剂在食品方面的应用提供理论依据。
1. 材料与方法
1.1 材料
选用产自小兴安岭9月成熟后的橡子,该橡子为辽东栎(Quercus wutaishanica)种子;昆明种小鼠,体重(18±2.0) g,黑龙江中医药大学,许可证号:SCXK(黑)2013-004。
1.2 试剂
1、1-二苯基苦基苯肼DPPH(0.04 mg/mL),西安沃尔森生物技术有限公司,无水乙醇均为分析纯;磷酸缓冲液(磷酸氢二钠+磷酸二氢钠+氯化钠配置成缓冲溶液),铁氰化钾(0.30 mol/mL),三氯乙酸(6.12 mol/mL),三氯化铁(0.062 mol/mL)均为分析纯;超氧化物歧化酶(SOD)测定试剂盒,过氧化氢酶(CAT)测定试剂盒,丙二醛(MDA)测定试剂盒南京建成生物工程研究所。其他试剂均为分析纯。
1.3 仪器与设备
FD-1A-80冷冻干燥机,上海比朗仪器有限公司;A1604电子天平,上海天平仪器厂;DK-8D电热恒温水槽,巩义市予华仪器有限责任公司;DHG-9030A电热恒温鼓风干燥箱,巩义市予华仪器有限责任公司;JH-722s可见分光光度计,上海精密科学仪器有限公司;RE-501旋转蒸发仪,郑州巩义;LXJ-ⅡB型离心机,上海安亭科学仪器厂。
1.4 方法
1.4.1 橡子壳色素的提取
橡子壳色素的提取是在张志建等[7]的提取方法基础上做一定的修改。具体提取方法如下:称取100 g橡子壳粉,按1:50(g/mL)的料液比,加入溶度为40%的乙醇提取溶剂,在60 ℃条件下提取5 h。浸提结束后自然冷却至室温,离心分离(3 000 r/min,5 min),得到1次色素提取液,残渣进行2次浸提,将2次色素提取液与1次色素提取液合并。将合并的色素提取液在50 ℃条件下真空旋转浓缩,浓缩至溶液呈粘稠状,浓缩液用真空冷冻法干燥,得到棕色粉末状橡子壳色素,备用。
1.4.2 橡子壳色素主要成分测定
1) 橡子壳色素多酚类物质含量的测定。根据GB/T8313—2008的方法,采用Folin-酚法,以没食子酸为标准品绘制标准曲线测定橡子壳色素中多酚成分的含量,以每克橡子壳色素中没食子酸当量计算多酚含量,并按下面公式计算橡子壳色素中多酚的含量。
橡子壳色素中多酚含量=C/M×100%,式中:C为橡子壳色素中多酚类物质的质量,mg;M为橡子壳色素质量,mg。
2) 橡子壳色素中黄酮类物质含量的测定。根据DB13T 385—1998的方法,采用硝酸铝方法,以芦丁为标准品绘制标准曲线,测定橡子壳色素中黄酮类物质含量,以每克样品中芦丁当量计,并按下面公式计算橡子壳色素中黄酮的含量。
橡子壳色素中黄酮含量=C/M×100%,式中:C为橡子壳色素中黄酮类物质的质量,mg;M为橡子壳色素质量,mg。
1.4.3 橡子壳色素体外抗氧化活性测定
1) 橡子壳色素对DPPH·的清除率测定。 本实验采用DPPH·比色法[8]测定橡子壳色素对DPPH·的清除能力。测定方法为:分别配置橡子壳色素与维生素C的浓度为:2、4、6、8、10、20、30、40、50 μg/mL水溶待测液,在测定管A1中加入2 mL待测液和2 mL DPPH·溶液,在对照管A2中加入2 mL待测液和2 mL的无水乙醇,在空白管A3中加入2 mL DPPH·溶液和2 mL的无水乙醇作空白。摇匀后,在室温下避光静置30 min,于517 nm处测定吸光值,分别记为A1、A2、A3,测定时用无水乙醇调零。按下列公式计算待测样品对DPPH·的清除能力。以Vc作为标准对照。做3次重复取平均值。
DPPH·清除率=[1-(A1-A2)/A3]× 100%。式中:A1为待测液和DPPH·试剂的吸光值;A2为待测液和空白溶剂的吸光值;A3为DPPH·试剂与空白溶剂混合液的吸光值。
2) 橡子壳色素还原力的测定。 本实验采用普鲁士蓝生成法[9]测定橡子壳色素的还原力,测定方法为:分别配置橡子壳色素及维生素C质量浓度0.05、0.1、0.2、0.4、0.6、0.8、1.0 mg/mL的水溶样液。在试管中加入1 mL样液、1 mL磷酸缓冲液、1 mL铁氰化钾,摇匀,50 ℃水浴20 min。流水冷却。加1 mL三氯乙酸,吸取1 mL后加入6 mL蒸馏水和0.2 mL三氯化铁,反应10 min,在700 nm处检验溶液的吸光度,记录A值,重复3次取平均值。
1.4.4 橡子壳色素体内抗氧化活性测定
1) 实验动物的分组与模型建立。 昆明种小鼠48只,雌雄各半,随机分为6组,每组8只。分为空白组、模型组、橡子壳色素高(200 mg/(kg·d))、中(100 mg/(kg·d))、低(50 mg/(kg·d))剂量组、维生素C(100 mg/(kg·d))。灌胃4周后,除空白组外其余组均给予6.0 Gy的60Coγ射线一次性全身均匀照射12 min,正常饲养7 d后,对小鼠进行单独眼球取血、离心、获得血清以备指标测定,颈椎处死后取出小鼠的主要脏器器官(心脏、肝脏、脾脏、肾脏)进行称质量,并计算小鼠的脏器指数[10]。
计算公式为:脏器系数=器官质量小鼠体重×100% 2) 指标测定。 SOD活力测定:羟胺法;CAT活力测定:钼酸铵比色法。MDA含量测定:硫代巴比妥酸(TBA)法,以上各指标均按试剂盒说明对样品进行处理和测定。
1.5 统计方法
实验数据以X±SD表示,采用SPSS19.0软件进行一维方差分析(ANOVA)统计分析法分析,显著性检验采用LSD检验法,P<0.05表示差异显著,用Origin 8.5做图。
2. 结果与分析
2.1 橡子壳色素中主要活性成分测定
本实验所选橡子壳为小兴安岭9月成熟后的橡实外壳,该橡实属于辽东栎种。经过对橡子壳色素主要成分测定发现其中含丰富多酚类和黄酮类物质,总多酚含量达到27.8%,总黄酮含量达到8.6%,可见该品种橡子壳色素应该具有较好的抗氧化功能。
2.2 橡子壳色素体外抗氧化能力
2.2.1 橡子壳色素对DPPH·的清除率
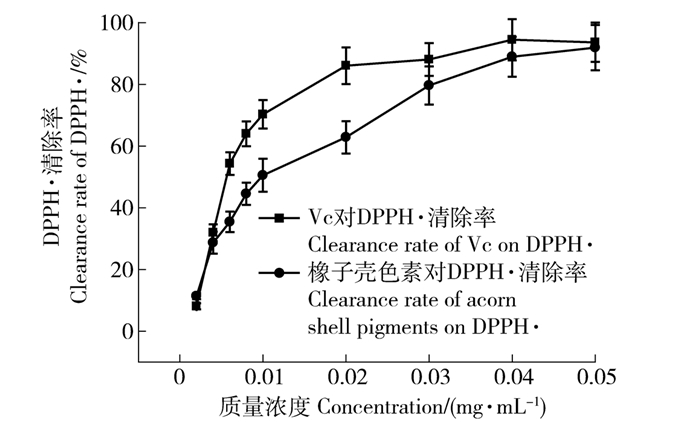
Vc有很强的抗氧化能力,通常用Vc作对照组,来比较待测物的抗氧化能力。本实验测定了样液对DPPH·清除率,DPPH·是一种比较稳定的脂性自由基,在517 nm处呈紫色,其N上有一个游离电子可与抗氧化剂中的一个电子配对,使紫色褪去。紫色褪去程度越大,表明对游离电子清除作用越强,即抗氧化能力越强[11]。由图 1可知,橡子壳色素及Vc溶液对DPPH·的清除率呈量效关系,橡子壳色素在质量浓度小于5 μg/mL时对DPPH·的清除率迅速增加,且低质量浓度下清除率接近于Vc。随着橡子壳色素浓度的增加清除率上升缓慢,其中橡子壳色素对DPPH·清除率达到50%时的质量浓度IC50=10 μg/mL,Vc对DPPH·清除率的IC50=5 μg/mL,橡子壳色素质量浓度在40 μg/mL左右时其清除率达到90%,几乎达到了Vc的清除能力,且要好于板栗壳色素抗氧化能力[12];由此可知橡子壳色素对DPPH·具有较强的清除能力。由于橡子树受地域气候影响而有很多品种,导致橡子壳中成分及含量亦不相同,因此不同来源橡子壳色素抗氧化活性可能存在显著差异[13]。
![]() 图 1 样品质量浓度对DPPH·清除率的影响Figure 1. Influence of sample concentration on the clearance rate of DPPH·
图 1 样品质量浓度对DPPH·清除率的影响Figure 1. Influence of sample concentration on the clearance rate of DPPH·2.2.2 橡子壳色素还原Fe3+能力
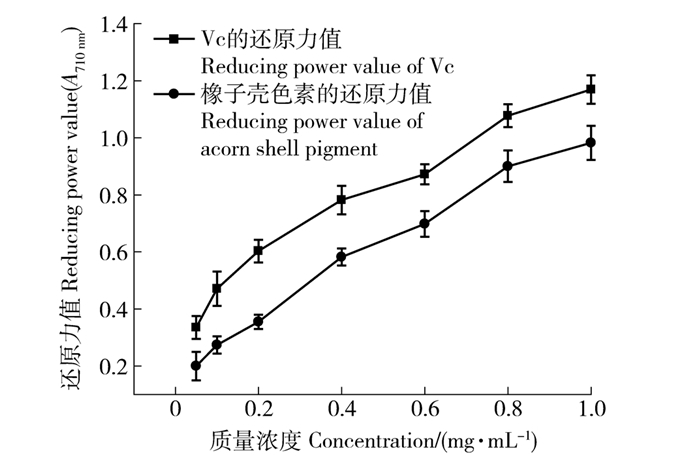
以Vc为阳性对照,采用铁氰化钾法对橡子壳色素的还原力进行测定[14]。由图 2可知,橡子壳色素及Vc的吸光度随浓度升高呈直线上升趋势,即橡子壳色素对Fe3+的还原力随浓度升高而增大,其中色素的还原力稍弱于Vc,当样品质量浓度为1 mg/mL时,橡子壳色素还原能力(A710 nm为0.98)接近Vc的还原能力(A710 nm为1.17),这与栓皮栎橡子壳色素具有较强还原能力的结果基本一致[13]。
2.3 橡子壳色素体内抗氧化活性
2.3.1 橡子壳色素对小鼠主要内脏质量的影响
实验灌胃期间,每天观察小鼠皮毛光滑度,行动灵活性,进食及大便是否正常,并每周对小鼠称体重1次,结果见表 1。通过观察发现各组小鼠皮毛光滑润泽,行动灵活,进食及大便正常。由表 1可知,各组小鼠之间体重变化无明显差异,前21 d都呈现生长迅速的状态,第28天与第21天相比无显著差异(P>0.05),体重增长很少,已经达到稳定状态。小鼠的体重增长变化符合其生长规律,说明橡子壳色素对小鼠没有产生急性和亚急性毒性作用。而辐照7 d后与辐照前相比,模型组小鼠体重显著下降(P<0.05),较辐照前体重降低了16.75%,其他各组小鼠体重均下降不显著(P>0.05),其中未经辐照的空白组小鼠体重保持最大(P<0.05),这一现象说明辐照对小鼠生长产生了影响,而灌喂橡子壳色素和Vc对小鼠辐射损伤起到了一定的抑制和修复作用。
表 1 实验期间各组小鼠体重变化Table 1. Mass changes of mice during the experiment组别
Group剂量Dose/
(mg·kg-1·d-1)第1天
1st day/g第7天
7th day/g第14天
14th day/g第21天
21st day/g第28天
28th day/g辐照后7 d
7th day after irradiation/g模型组Model group 18.70±0.39aA 22.72±0.75aB 24.93±1.03aC 28.19±1.39aD 30.85±1.78aD 25.68±1.73aC 空白组Blank group 18.44±0.51aA 23.04±0.94aB 25.02±1.33aC 28.97±1.4aD 30.97±1.27aD 30.22±2.80cD Vc组Vc group 100 18.28±0.55aA 22.50±1.14aB 25.42±1.54aC 28.70±1.27aD 30.73±1.87aD 28.04±1.63bD 橡子壳色素组
Acorn shell pigment group50 18.63±0.78aA 22.59±0.53aB 25.77±1.25aC 28.69±1.08aD 30.24±1.65aD 28.23±1.34bD 100 18.98±0.99aA 22.91±0.86aB 24.28±1.77aC 28.31±2.00aD 29.88±1.90aD 27.93±1.71bD 200 18.88±0.48aA 22.91±0.69aB 24.66±1.58aC 28.05±1.52aD 29.01±2.11aD 28.45±1.98bD 注:不同小写字母表示每一组各列之间差异显著(P<0.05);不同大写字母表示各组每一行之间差异显著(P<0.05)。下同。Notes: different small letters within a column mean significant difference at P<0.05 level; different capital letters within a row mean significant difference at P<0.05 level. The same below. 辐照7 d后,与空白组相比,其他各组小鼠均出现精神萎靡、食量减少、大便颜色发黄且较臭现象。 解剖时对各组小鼠的心脏、肝脏和肾组织在色泽、形状等方面与空白组进行观察比较发现无明显差异。从表 2中各组小鼠的心脏指数、肝脏指数、脾脏指数和肾指数统计分析可以看出,与空白组相比,模型组小鼠的各项脏器指数均显著下降(P<0.05),而Vc组和橡子壳色素组小鼠的各项脏器指数下降不显著(P<0.05);说明辐照对小鼠内脏有一定的影响,损害了小鼠各脏器的功能,同时也说明橡子壳色素与和Vc对小鼠脏器有保护功能,即对小鼠的主要器官有一定的修复作用。
表 2 各实验组的小鼠脏器系数Table 2. Mouse organ coefficient of each experiment group组别
Group剂量Dose/
(mg·kg-1·d-1)心脏指数
Heart index/%肝脏指数
Hepatic index/%脾脏系数
Spleen index/%肾指数
Kidney index/%模型组Model group 0.48±0.008 8a 4.06±0.10a 0.20±0.007 5a 1.45±0.098a 空白组Blank group 0.67±0.005 9b 5.60±0.066b 0.25±0.009 4b 1.76±0.087b Vc组Vc group 100 0.62±0.007 9b 5.44±0.095b 0.24±0.008 6b 1.69±0.097b 橡子壳色素组
Acorn shell pigment group50 0.60±0.0090b 5.04±0.083b 0.25±0.0087b 1.74±0.078b 100 0.63±0.0054b 4.98±0.077b 0.24±0.0082b 1.73±0.092b 200 0.64±0.0074b 5.27±0.063b 0.24±0.0076b 1.74±0.088b 注:不同小写字母表示每一组各列之间有显著差异(P<0.05)。Note: different small letters within a column mean significant difference at P<0.05 level. 2.3.2 橡子壳色素对小鼠血清超氧化物歧化酶(SOD)活性的影响
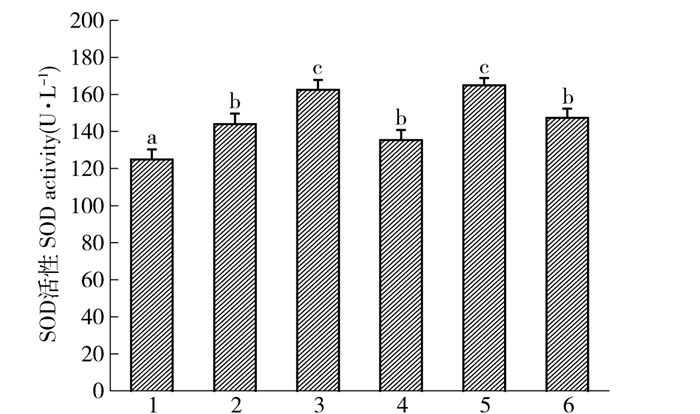
SOD是生物体内清除自由基的主要生物酶,能对抗与阻断因氧自由基对细胞造成的损害,并能够及时修复因自由基造成对细胞的损伤,因此SOD活性的大小可反应橡子壳色素体内抗氧化能力的大小,对小鼠血清SOD活性的测定结果见图 3。由图 3可知,与空白组相比,模型组小鼠血清中SOD活性下降了13.30%(P<0.05),表明60Coγ照射降低了小鼠血清中SOD的活性。而橡子壳色素低、中、高剂量组以及Vc组小鼠血清中SOD活性显著高于模型组(P<0.05),其中中剂量组及Vc组小鼠血清中SOD活性最高(P<0.05),分别达到了164.96、162.43 u/L。从实验结果可以看出,橡子壳色素对小鼠血清SOD有显著的修复作用,可以提高小鼠血清中SOD活性,且100 mg/(kg·d)剂量橡子壳色素与Vc效果一致。本实验与用黑高粱色素[15]和石榴皮多酚色素[16]灌胃小鼠显著提高了SOD酶活性,对脂质过氧化损伤有保护作用的实验结果相一致。
![]() 图 3 橡子壳色素对小鼠血清SOD活性的影响1.模型组;2.空白组; 3.维生素C组; 4.色素低剂量组; 5.色素中剂量组; 6.色素高剂量组; 不同小写字母表示各组之间有显著差异(P<0.05)。下图同此。Figure 3. Influence of acorn shell pigment on serum SOD activity of mice1, model group; 2, blank group; 3, Vc group; 4, low level group of acorn shell pigments; 5, middle level group of acorn shell pigments; 6, high level group of acorn shell pigments; different small letters within a group mean significant difference at P < 0.05 level. The same below.
图 3 橡子壳色素对小鼠血清SOD活性的影响1.模型组;2.空白组; 3.维生素C组; 4.色素低剂量组; 5.色素中剂量组; 6.色素高剂量组; 不同小写字母表示各组之间有显著差异(P<0.05)。下图同此。Figure 3. Influence of acorn shell pigment on serum SOD activity of mice1, model group; 2, blank group; 3, Vc group; 4, low level group of acorn shell pigments; 5, middle level group of acorn shell pigments; 6, high level group of acorn shell pigments; different small letters within a group mean significant difference at P < 0.05 level. The same below.2.3.3 橡子壳色素对小鼠血清过氧化氢酶(CAT)活性的影响
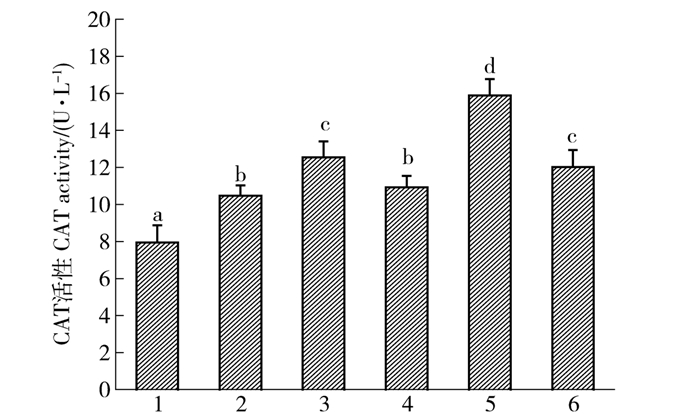
H2O2是细胞正常代谢的产物,而过氧化氢酶(CAT)可催化细胞内过氧化氢分解,防止过氧化,CAT活性越大,说明抗氧化能力越强。因此本实验研究了各实验组小鼠血清的CAT活性情况,结果见图 4。由图 4可知,模型组小鼠血清中CAT活性显著低于空白组(P<0.05),其活性下降了23.13%,表明辐射降低了小鼠血清中的CAT活性。橡子壳色素组和Vc组小鼠血清中CAT活性与模型组相比均有显著差异(P<0.05),表明对小鼠血清的CAT活性有一定的修复作用。橡子壳色素低剂量组小鼠血清中CAT活性与空白组相比无显著差异(P>0.05),而橡子壳色素中、高剂量组小鼠血清CAT活性显著高于空白组(P<0.05),说明色素可提高小鼠血清中CAT的活性。与Vc组小鼠血清中CAT活性相比,橡子壳色素中剂量组显著高于Vc组(P<0.05),而橡子壳色素高剂量组与Vc组相比无显著差异(P>0.05),可以看出橡子壳色素中剂量组提高CAT活性能力最强。从分析结果可以看出,橡子壳色素可使小鼠体内过氧化氢酶活性提高,且中剂量组效果最好,CAT活性可达到15.88 u/L。其结果与桑色素对全氟辛酸诱导小鼠肝损伤具有保护作用,其可显著提高肝中CAT水平的结果一致[17]。该结果表明SOD与CAT共同维持了机体的抗氧化能力,它们之间存在一定的协同作用。
![]() 图 4 橡子壳色素对小鼠血清过氧化氢酶(CAT)活性的影响Figure 4. Effects of acorn shell pigment on serum CAT activity of mice
图 4 橡子壳色素对小鼠血清过氧化氢酶(CAT)活性的影响Figure 4. Effects of acorn shell pigment on serum CAT activity of mice2.3.4 橡子壳色素对小鼠血清丙二醛(MDA)含量的影响
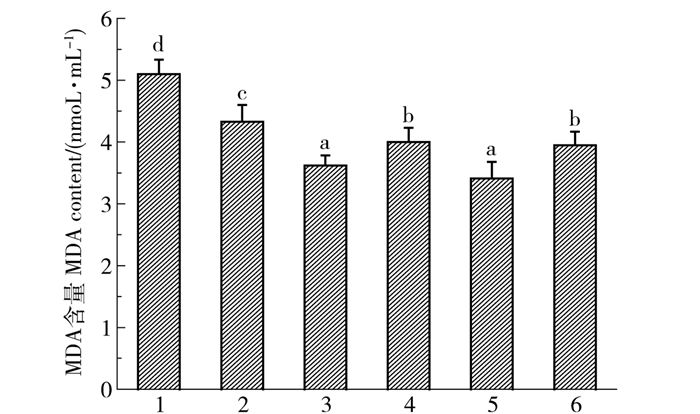
在生物机体内,氧自由基作用于生物膜上的不饱和脂肪酸发生过氧化反应,最终生成丙二醛(MDA),MDA含量的高低间接反映了机体受自由基影响氧化衰老的速度。因此本实验测定了各实验组小鼠血清中MDA含量,结果见图 5。由图 5可知,模型组小鼠的MDA含量明显高于空白组(P<0.05),已达到5.12 nmol/mL。而其他各组小鼠的MDA含量显著低于空白组(P<0.05),其中Vc组和橡子壳色素中剂量组小鼠血清中的MDA含量最低(P<0.05)。从数据分析结果可以说明,辐照作用能够使小鼠血清中的MAD含量增高,而Vc和橡子壳色素能够提高小鼠抗辐射能力,而且中剂量的橡子壳色素抗辐射作用与Vc作用效果一致,能够使小鼠血清中MDA水平降到3.48 nmol/mL。由此可知,橡子壳色素能够提高小鼠抗辐射能力而降低血清中MDA含量,并且具有量效关系。本实验结果与高璐等[18]用葡萄籽色素灌胃由D-半乳糖诱导的氧化衰老模型的小鼠,可显著降低MDA含量的结果相一致。从以上3个体内抗氧化指标可以看出中剂量橡子壳色素的抗氧化效果最好,这可能是橡子壳色素灌喂剂量过大,对小鼠产生一定的副作用。
![]() 图 5 橡子壳色素对小鼠血清MDA含量的影响Figure 5. Effects of acorn shell pigment on serum MDA levels in mice
图 5 橡子壳色素对小鼠血清MDA含量的影响Figure 5. Effects of acorn shell pigment on serum MDA levels in mice3. 结论
橡子壳色素作为一种天然的坚果果壳色素,含有丰富的多酚类和黄酮类物质,本实验中橡子壳色素总多酚含量达到27.8%,总黄酮含量8.6%。体外抗氧化实验表明,当橡子壳色素浓度在40 μg/mL时对DPPH·清除率达到90%,在1 mg/mL时对Fe3+还原能力的吸光值达到0.98,抗氧化能力接近Vc。采用60Coγ射线照射小鼠的氧化伤害实验结果表明,橡子壳色素对小鼠辐射损伤具有一定的修复功能,并且能够提高血清中的SOD、CAT活性,降低MDA的含量,其中效果最好的为中剂量组(100 mg/(kg·d))橡子壳色素,并与相同剂量的Vc组相当。由此可知,橡子壳色素具有很好的抗氧化作用,可以应用到抗氧化保健品的开发应用中去,从而提高橡子资源的利用率。
-
![]()
图 1 银杏地上生物量与地下生物量之间的关系
Figure 1. Relationship between aboveground and belowground biomass of Ginkgo biloba
![]()
图 2 银杏树干、树枝、树叶、树根生物量空间分布图
Figure 2. Horizontal and vertical distribution of stem, branch, leaf and root biomass of G. biloba
表 1 标准木基本信息表
Table 1 Basic characteristics of sample trees
径级
Diameter at breast height (DBH) class/cm株数
Tree number胸径
DBH/cm树高
Tree height(H)/m树冠长度
Grown length/m南北向冠幅
South-north crown width/m东西向冠幅
East-west crown width/m生物量
Biomass/kg10~15 7 10.9 11.1 6.6 2.6 3.3 28.50 11.4 11.2 9.3 3.2 2.3 35.70 13.3 12.3 10.2 5.3 6.4 56.05 13.4 12.0 9.6 6.0 5.0 56.61 13.5 11.4 7.8 4.9 4.8 52.35 13.6 11.2 8.1 4.9 4.5 59.46 13.8 11.7 9.3 4.7 4.3 60.26 15~20 3 17.1 13.9 11.9 3.9 8.8 81.36 17.7 13.5 9.6 5.1 5.6 102.84 18.8 12.6 10.2 5.7 6.3 108.95 >20 3 20.1 13.0 11.5 6.0 7.2 134.82 24.8 14.5 12.0 6.5 8.6 223.20 27.2 13.6 12.6 8.4 9.7 320.27  下载: 导出CSV
表 2 株水平上各器官生物量测定值
Table 2 Measurement of each component biomass at the tree level
kg 组分
Component径级DBH class 10~15 cm 15~20 cm >20 cm 叶生物量
Leaf biomass2.62 3.80 17.96 干生物量
Stem biomass28.20 51.59 146.00 枝生物量
Branch biomass6.02 16.01 72.60 地上部分生物量
Aboveground biomass36.84 71.40 236.56 根生物量
Root biomass13.01 26.32 83.70 总生物量
Total biomass49.85 97.72 320.26
下载: 导出CSV
表 3 枝水平上枝生物量异速生长模型
Table 3 Allometric models for branch at branch level
生物量
Biomass/kg模型
Model系数Coefficient Radj2 显著性
Sig.CF SSE MAE MPE a b c 枝Branch lnW=a+blnBD -0.46 ns 3.039*** - 0.904 P<0.001 1.078 1.699 0.279 24.718 lnW=a+blnBD+ClnBL0.039 ns 0.916 ns 2.129 0.957 P<0.001 1.026 0.715 0.201 12.038 注:*表示在0.05水平上差异显著;**表示在0.01水平上差异显著;***表示在0.001水平上差异显著;ns表示在0.05水平上差异不显著;BD表示基径;BL表示枝长。下同。Notes: * means significant difference at P<0.05 level; ** means significant difference at P<0.01 level; *** means significant difference at P<0.01 level; ns means no significant difference at P<0.05 level; BD means branch diameter; BL means branch length. The same below.
下载: 导出CSV
表 4 银杏不同器官生物量模型参数估计、拟合结果和检验结果
Table 4 Parameter estimation, fitting and test results of different components of G. biloba biomass
模型
Model生物量
Biomass/kg系数Coefficient Radj2 显著性Sig. CF SSE MAE MPE a b c lnW=a+blnD 叶Leaf -5.21*** 2.37*** 0.868 P<0.001 1.025 0 0.752 0.199 17.535 干Stem -2.23*** 2.17*** 0.989 P<0.001 1.000 1 0.046 0.048 1.280 枝Branch -6.95*** 3.36*** 0.871 P<0.001 1.077 0 1.471 0.263 26.879 地上Aboveground -2.56*** 2.40*** 0.980 P<0.001 1.003 0 0.104 0.073 1.848 根Root -3.75*** 2.45*** 0.989 P<0.001 1.000 6 0.107 0.078 2.761 全株Total -2.29*** 2.41*** 0.985 P<0.001 1.000 2 0.081 0.066 1.550 lnW=a+blnH 叶Leaf -14.09** 6.13** 0.571 P<0.010 1.075 4 2.518 0.356 33.011 干Stem -10.75** 5.77*** 0.698 P<0.001 1.004 7 1.634 0.297 7.758 枝Branch -19.13** 8.53** 0.550 P<0.001 1.153 1 6.183 0.489 44.667 地上Aboveground -10.51** 5.09*** 0.668 P<0.001 1.005 4 2.166 0.325 7.890 根Root -13.24** 6.46*** 0.678 P<0.001 1.010 8 2.265 0.337 11.212 全株Total -11.55** 6.32*** 0.068 P<0.001 1.004 8 2.159 0.327 7.393 lnW=a+bln(D2H) 叶Leaf -6.95*** 1.03*** 0.853 P<0.001 1.025 4 0.770 0.206 17.974 干Stem -3.84*** 0.95*** 0.980 P<0.001 1.000 2 0.080 0.058 1.556 枝Branch -9.38*** 1.46*** 0.852 P<0.001 1.080 0 1.719 0.288 28.092 地上Aboveground -4.32*** 1.04*** 0.967 P<0.001 1.000 5 0.168 0.082 2.040 根Root -5.60*** 1.07*** 0.967 P<0.001 1.001 0 0.174 0.103 3.542 全株Total -4.07*** 1.05*** 0.972 P<0.001 1.000 3 0.145 0.080 1.823 lnW=a+blnD+clnH 叶Leaf -3.26*** 2.68*** -1.12*** 0.861 P<0.001 1.025 2 0.749 0.200 17.649 干Stem -1.61*** 2.27*** -0.36*** 0.990 P<0.001 1.000 2 0.046 0.480 1.277 枝Branch -3.14*** 3.97*** -2.18*** 0.870 P<0.001 1.077 2 1.377 0.257 26.786 地上Aboveground -1.18*** 2.62*** -0.79*** 0.981 P<0.001 1.000 3 0.100 0.073 1.864 根Root -2.64*** 2.63*** -0.64*** 0.980 P<0.001 1.000 7 0.104 0.074 2.657 全株Total -1.01*** 2.61*** -0.73*** 0.986 P<0.001 1.000 2 0.077 0.067 1.564
下载: 导出CSV
-
[1] OLSON J S, WATTS J A, ALLISON L J. Carbon in live vegetation of major world ecosystems[R]. 1983.
[2] 方精云, 刘国华, 徐嵩龄.我国森林植被的生物量和净生产量[J].生态学报, 1996, 16(5): 497-508. http://www.cqvip.com/Main/Detail.aspx?id=2354606 FANG J Y, LIU G H, XU S L. Biomass and net production of forest vegetation in China[J]. Acta Ecologica Sinica, 1996, 16(5): 497-508. http://www.cqvip.com/Main/Detail.aspx?id=2354606
[3] 国家林业局.第八次全国森林资源清查结果[J].林业资源管理, 2014(1): 1-2. http://d.old.wanfangdata.com.cn/Periodical/lyzygl201401001 State Forestry Administration. The 8th national forestry inventory results[J]. Forest Resources Management, 2014(1): 1-2. http://d.old.wanfangdata.com.cn/Periodical/lyzygl201401001
[4] 冯宗炜.中国森林生态系统的生物量和生产力[M].北京:科学出版社, 1999: 191-196. FENG Z W. Biomass and primary productivity of forest ecosystems in China[M]. Beijing: Science Press, 1999: 191-196.
[5] FANG J Y, WANG Z M. Forest biomass estimation at regional and global levels, with special reference to China's forest biomass[J]. Ecological Research, 2001, 16(3): 587-592. doi: 10.1046/j.1440-1703.2001.00419.x
[6] 罗云建, 张小全, 王效科, 等.森林生物量的估算方法及其研究进展[J].林业科学, 2009, 45(8): 129-134. doi: 10.3321/j.issn:1001-7488.2009.08.023 LUO Y J, ZHANG X Q, WANG X K, et al. Forest biomass estimation methods and their prospects[J]. Scientia Silvae Sinicae, 2009, 45(8): 129-134. doi: 10.3321/j.issn:1001-7488.2009.08.023
[7] 潘维俦, 李利村, 高正衡, 等.杉木人工林生态系统中的生物产量及其生产力的研究[J].湖南林业科技, 1978 (5): 2-14. http://www.cnki.com.cn/Article/CJFD1979-HLKJ197805000.htm PAN W S, LI L C, GAO Z H, et al. Study on biomass and productivity in ecology system of China fir plantation[J]. Hunan Forestry Science and Technology, 1978 (5): 2-14. http://www.cnki.com.cn/Article/CJFD1979-HLKJ197805000.htm
[8] 冯宗炜, 陈楚莹, 张家武, 等.湖南会同地区马尾松林生物量的测定[J].林业科学, 1982, 18(2): 127-134. http://www.cnki.com.cn/Article/CJFDTotal-LYKE198202002.htm FENG Z W, CHEN C Y, ZHANG J W, et al. Determination of biomass of Pinus massoniana stand in Huitong County, Hunan Province[J]. Scientia Silvae Sinicae, 1982, 18(2): 127-134. http://www.cnki.com.cn/Article/CJFDTotal-LYKE198202002.htm
[9] 李文华.小兴安岭谷地云冷杉林群落结构和演替的研究[J].资源科学, 1980, 2(4): 17-29. http://www.cnki.com.cn/Article/CJFDTotal-ZRZY198004002.htm LI W H. Community structure and succession of valley spruce-fir forest in Xiaoxing'an Mountains, China[J]. Natural Resources, 1980, 2(4): 17-29. http://www.cnki.com.cn/Article/CJFDTotal-ZRZY198004002.htm
[10] 李意德, 曾庆波, 吴仲民, 等.尖峰岭热带山地雨林生物量的初步研究[J].植物生态学与地植物学学报, 1992, 16(4): 293-300. http://www.cnki.com.cn/Article/CJFDTotal-ZWSB199204000.htm LI Y D, ZENG Q B, WU Z M, et al. Study on biomass of tropical mountain rain forest in Jianfengling, Hainan Province[J]. Chinese Journal of Plant Ecology, 1992, 16(4): 293-300. http://www.cnki.com.cn/Article/CJFDTotal-ZWSB199204000.htm
[11] 张志, 田昕, 陈尔学, 等.森林地上生物量估测方法研究综述[J].北京林业大学学报, 2011, 33(5): 144-150. http://j.bjfu.edu.cn/article/id/9663 ZHANG Z, TIAN X, CHEN E X, et al. Review of methods on estimating forest aboveground biomass[J]. Journal of Beijing Forestry University, 2011, 33(5): 144-150. http://j.bjfu.edu.cn/article/id/9663
[12] CHUNG S Y, YIM J S, CHO H K, et al. Comparison of forest biomass estimation methods by combining satellite data and field data[J/OL]. Proceedings of IUFRO Division, 2009, 4[2016-08-02]. https://www.researchgate.net/publication/237334259.
[13] 王维枫, 雷渊才, 王雪峰, 等.森林生物量模型综述[J].西北林学院学报, 2008, 23(2): 58-63. http://d.old.wanfangdata.com.cn/Periodical/xblxyxb200802014 WANG W F, LEI Y C, WANG X F, et al. A review of forest biomass models[J]. Journal of Northwest Forestry University, 2008, 23(2): 58-63. http://d.old.wanfangdata.com.cn/Periodical/xblxyxb200802014
[14] 唐守正, 张会儒, 胥辉.相容性生物量模型的建立及其估计方法研究[J].林业科学, 2000, 36(增刊1): 19-27. http://d.old.wanfangdata.com.cn/Periodical/lykx2000Z1003 TANG S Z, ZHANG H R, XU H. Study on establish and estimate method of compatible biomass model[J]. Scientia Silvae Sinicae, 2000, 36(Suppl. 1): 19-27. http://d.old.wanfangdata.com.cn/Periodical/lykx2000Z1003
[15] CHAVE J, ANDALO C, BROWN S, et al. Tree allometry and improved estimation of carbon stocks and balance in tropical forests[J]. Oecologia, 2005, 145(1): 712-735. http://www.wanfangdata.com.cn/details/detail.do?_type=perio&id=687e13a4f79ffd6b30216f5e3963cd74
[16] 曾伟生, 唐守正.一个新的通用性相对生长生物量模型[J].林业科学, 2012, 48(1): 48-52. http://d.old.wanfangdata.com.cn/Periodical/lykx201201009 ZENG W S, TANG S Z. A new general biomass allometric model[J]. Scientia Silvae Sinicae, 2012, 48(1): 48-52. http://d.old.wanfangdata.com.cn/Periodical/lykx201201009
[17] 罗天祥.中国主要森林类型生物生产力格局及其数学模型[D].北京: 中国科学院研究生院, 1996. http://cdmd.cnki.com.cn/Article/CDMD-80061-2006113572.htm LUO T X. Patterns of net primary productivity for Chinese major forest types and their mathematical models[D]. Beijing: Graduate University of the Chinese Academy of Sciences, 1996. http://cdmd.cnki.com.cn/Article/CDMD-80061-2006113572.htm
[18] 左舒翟, 任引, 翁闲, 等.亚热带常绿阔叶林9个常见树种的生物量相对生长模型[J].应用生态学报, 2015, 26(2): 356-362. http://d.old.wanfangdata.com.cn/Periodical/yystxb201502004 ZUO S D, REN Y, WENG X, et al. Biomass allometric equations of nine common tree species in an evergreen broadleaved forest of subtropical China[J]. The Journal of Applied Ecology, 2015, 26(2): 356-362. http://d.old.wanfangdata.com.cn/Periodical/yystxb201502004
[19] MUUKKONEN P. Generalized allometric volume and biomass equations for some tree species in Europe[J]. European Journal of Forest Research, 2007, 126(2): 157-166. doi: 10.1007/s10342-007-0168-4
[20] 曹福亮.中国银杏志[M].北京:中国林业出版社, 2007. CAO F L. Chinese notes of Ginkgo biloba[M]. Beijing: China Forestry Publishing House, 2007.
[21] 陈西娟, 王成章, 叶建中.银杏叶化学成分及其应用研究进展.生物质化学工程[J]. 2008, 42(4): 57-62. doi: 10.3969/j.issn.1673-5854.2008.04.012 CHEN X J, WANG C Z, YE J Z. Research progress of chemical constituents of Ginkgo biloba Linn. leaves and their application[J]. Biomass Chemical Engineering, 2008, 42(4): 57-62. doi: 10.3969/j.issn.1673-5854.2008.04.012
[22] 邵继平, 王伯初, 陈欣, 等.银杏叶提取物药用价值的研究进展[J].重庆大学学报(自然科学版), 2003, 26(1): 130-134. http://www.wanfangdata.com.cn/details/detail.do?_type=perio&id=cqdxxb200301034 SHAO J P, WANG B C, CHEN X, et al. Advanced research on pharmacology value of the extracts of Ginkgo biloba leaves[J]. Journal of Chongqing University(Natural Science Edition), 2003, 26(1): 130-134. http://www.wanfangdata.com.cn/details/detail.do?_type=perio&id=cqdxxb200301034
[23] 彭方仁, 张纪林, 李杰, 等.海岸带不同林农复合经营模式的生物生产力研究[J].南京林业大学学报(自然科学版), 2000, 24(2): 78-82. doi: 10.3969/j.issn.1000-2006.2000.02.019 PENG F R, ZHANG J L, LI J, et al. Studies on biomass productivity of three different agroforestry models in seacoast area[J]. Journal of Nanjing Forestry University(Natural Sciences Edition), 2000, 24(2): 78-82. doi: 10.3969/j.issn.1000-2006.2000.02.019
[24] 曹林, 阮宏华, 代劲松, 等.基于HJ-1A/1B CCD数据的区域银杏生物量估测及碳密度制图[J].南京林业大学学报(自然科学版), 2013, 37(2): 8-14. http://www.wanfangdata.com.cn/details/detail.do?_type=perio&id=njlydxxb201302002 CAO L, RUAN H H, DAI J S, et al. The regional biomass estimation and carbon density mapping of Ginkgo biloba based on HJ-1A/1B CCD satellite image[J]. Journal of Nanjing Forestry University(Natural Sciences Edition), 2013, 37(2): 8-14. http://www.wanfangdata.com.cn/details/detail.do?_type=perio&id=njlydxxb201302002
[25] 于庚康, 罗艳, 高苹, 等.区域农业经济气象敏感性和气象经济效益[J].生态学杂志, 2012, 31(5): 1265-1271. http://d.old.wanfangdata.com.cn/Periodical/stxzz201205033 YU G K, LUO Y, GAO P, et al. Meteorological sensitivity and meteorological services economic benefit of regional agricultural economy[J]. Chinese Journal of Ecology, 2012, 31(5): 1265-1271. http://d.old.wanfangdata.com.cn/Periodical/stxzz201205033
[26] 孟宪宇.测树学[M].北京:中国林业出版社, 2006: 197-199. MENG X Y. Forest measurement[M]. Beijing: China Forestry Publishing House, 2006: 197-199.
[27] WANG C. Biomass allometric equations for 10 co-occurring tree species in Chinese temperate forests[J]. Forest Ecology and Management, 2006, 222(1): 9-16. http://www.wanfangdata.com.cn/details/detail.do?_type=perio&id=d480b7b7505f7c5bcdc3b33c43141c0f
[28] 明安刚, 郑路, 麻静, 等.铁力木人工林生物量与碳储量及其分配特征[J].北京林业大学学报, 2015, 37(2): 32-40. doi: 10.13332/j.cnki.jbfu.2015.02.015 MING A G, ZHEN L, MA J, et al. Biomass and carbon stock and allocation characteristic in Mesua ferrea plantation[J]. Journal of Beijing Forestry University, 2015, 37(2): 32-40. doi: 10.13332/j.cnki.jbfu.2015.02.015
[29] GOWER S T, KUCHARIK C J, NORMAN J M. Direct and indirect estimation of leaf area index, APAR, and net primary production of terrestrial ecosystems[J]. Remote Sensing of Environment, 1999, 70(1): 29-51. doi: 10.1016/S0034-4257(99)00056-5
[30] HALL R J, CASE B S. Erratum: assessing prediction errors of generalized tree biomass and volume equations for the boreal forest region of west-central Canada[J]. Canadian Journal of Forest Research, 2008, 38(6): 878-889. doi: 10.1139/X08-906#.XXMLYPk6s7M
[31] SALIS S M, ASSIS M A, MATTOS P P. Estimating the aboveground biomass and wood volume of savanna woodlands in Brazil's Pantanal Wetlands based on allometric correlations[J]. Forest Ecology & Management, 2006, 228(1): 61-68. https://www.sciencedirect.com/science/article/pii/S0378112706001344
[32] TER-MIKAELIAN M T, KORZUKHIN M D. Biomass equations for sixty-five North American tree species[J]. Forest Ecology & Management, 1997, 97(1): 1-24. doi: 10.1016-S0378-1127(97)00019-4/
[33] ZIANIS D. Predicting mean aboveground forest biomass and its associated variance[J]. Forest Ecology & Management, 2008, 256(6): 1400-1407. http://d.old.wanfangdata.com.cn/NSTLQK/NSTL_QKJJ029672022/
[34] BEETS P N, KIMBERLEY M O, OLIVER G R, et al. Allometric equations for estimating carbon stocks in natural forest in New Zealand[J]. Forests, 2012, 3(3): 818-839. doi: 10.3390/f3030818
[35] NÁVAR J. Allometric equations for tree species and carbon stocks for forests of northwestern Mexico[J]. Forest Ecology & Management, 2009, 257(2): 427-434. http://www.wanfangdata.com.cn/details/detail.do?_type=perio&id=fe7cbaf2e457a8d05402279feb1f2f4c
[36] WANG C. Biomass allometric equations for 10 co-occurring tree species in Chinese temperate forests[J]. Forest Ecology & Management, 2006, 222(1): 9-16. https://www.sciencedirect.com/science/article/pii/S0378112705005888
[37] PARRESOL B R. Assessing tree and stand biomass: a review with examples and critical comparisons[J]. Forest Science, 1999, 45(4): 573-593. http://europepmc.org/abstract/AGR/IND22056385
[38] ZABEK L M, PRESCOTT C E. Biomass equations and carbon content of aboveground leafless biomass of hybrid poplar in Coastal British Columbia[J]. Forest Ecology & Management, 2006, 223(1-3): 291-302. https://www.sciencedirect.com/science/article/pii/S0378112705007206
[39] SILESHI G W. A critical review of forest biomass estimation models, common mistakes and corrective measures[J]. Forest Ecology and Management, 2014, 329: 237-254. doi: 10.1016/j.foreco.2014.06.026
[40] NELSON B W, MESQUITA R, PEREIRA J L G, et al. Allometric regressions for improved estimate of secondary forest biomass in the central Amazon[J]. Forest Ecology & Management, 1999, 117(1-3): 149-167. doi: 10.1016-S0378-1127(98)00475-7/
[41] KOZAK A, KOZAK R. Does cross validation provide additional information in the evaluation of regression models?[J]. Canadian Journal of Forest Research, 2003, 33(6): 1499.
[42] PEICHL M, ARAIN M A. Allometry and partitioning of above-and belowground tree biomass in an age-sequence of white pine forests[J]. Forest Ecology & Management, 2007, 253(1-3): 68-80. doi: 10.1016-j.foreco.2007.07.003/
[43] 董点, 林天喜, 唐景毅, 等.紫椴生物量分配格局及异速生长方程[J].北京林业大学学报, 2014, 36(4): 54-63. doi: 10.13332/j.cnki.jbfu.2014.04.013 DONG D, LIN T X, TANG J Y, et al. Biomass allocation patterns and allometric models of Tilia amurensis[J]. Journal of Beijing Forestry University, 2014, 36(4): 54-63. doi: 10.13332/j.cnki.jbfu.2014.04.013
[44] HOUGHTON R A, LAWRENCE K T, HACKLER J L, et al. The spatial distribution of forest biomass in the Brazilian Amazon: a comparison of estimates[J]. Global Change Biology, 2001, 7(7): 731-746. doi: 10.1046/j.1365-2486.2001.00426.x
[45] 汪金松, 张春雨, 范秀华, 等.臭冷杉生物量分配格局及异速生长模型[J].生态学报, 2011, 31(14): 3918-3927. http://d.old.wanfangdata.com.cn/Periodical/stxb201114007 WANG J S, ZHANG C Y, FAN X H, et al. Biomass allocation patterns and allometric models of Abies nephrolepis Maxim.[J]. Acta Ecologica Sinica, 2011, 31(14): 3918-3927. http://d.old.wanfangdata.com.cn/Periodical/stxb201114007
[46] ZHANG H, SONG T, WANG K, et al. Influences of stand characteristics and environmental factors on forest biomass and root-shoot allocation in southwest China[J]. Ecological Engineering, 2016, 91: 7-15. doi: 10.1016/j.ecoleng.2016.01.040
[47] 黄玫, 季劲钧, 曹明奎, 等.中国区域植被地上与地下生物量模拟[J].生态学报, 2006, 26(12): 4156-4163. doi: 10.3321/j.issn:1000-0933.2006.12.031 HUANG M, JI J J, CAO M K, et al. Modeling study of vegetation shoot and root biomass in China[J]. Acta Ecologica Sinica, 2006, 26(12): 4156-4163. doi: 10.3321/j.issn:1000-0933.2006.12.031
[48] LI Z, KURZ W A, APPS M J, et al. Belowground biomass dynamics in the carbon budget model of the Canadian forest sector: recent improvements and implications for the estimation of NPP and NEP[J]. Canadian Journal of Forest Research, 2011, 33(1): 126-136. doi: 10.1139/x02-165#.XXML6fk6s7M
[49] LEVERENZ J W. Shade-shoot structure, photosynthetic performance in the field, and photosynthetic capacity of evergreen conifers[J]. Tree Physiology, 1996, 16(16): 109-114. http://www.wanfangdata.com.cn/details/detail.do?_type=perio&id=HighWire000001746605
[50] BRIX H. Effects of thinning and nitrogen fertilization on branch and foliage production in Douglas-fir[J]. Canadian Journal of Forest Research, 1981, 10(11): 502-511. doi: 10.1139-x81-069/
[51] XIAO C W, CEULEMANS R. Allometric relationships for below-and aboveground biomass of young Scots pines[J]. Forest Ecology & Management, 2005, 203(1-3): 177-186. doi: 10.1016-j.foreco.2004.07.062/
[52] LACLAU P. Root biomass and carbon storage of ponderosa pine in a northwest Patagonia plantation[J]. Forest Ecology & Management, 2003, 173(1): 353-360. http://www.wanfangdata.com.cn/details/detail.do?_type=perio&id=bd23d10b04d27e526ac15a2c3d5a8434
[53] NETER J, KUTNER M H, NACHTSHEIM C J, et al. Applied linear statistical model[J]. Journal of the American Statistical Association, 1986, 81: 19-32. http://d.old.wanfangdata.com.cn/NSTLQK/NSTL_QKJJ026998328/
[54] 李轩然, 刘琪璟, 陈永瑞, 等.千烟洲人工林主要树种地上生物量的估算[J].应用生态学报, 2006, 17(8): 1382-1388. doi: 10.3321/j.issn:1001-9332.2006.08.005 LI X R, LIU Q J, CHEN Y R, et al. Aboveground biomass of three conifers in Qianyanzhou plantation[J]. The Journal of Applied Ecology, 2006, 17(8): 1382-1388. doi: 10.3321/j.issn:1001-9332.2006.08.005
[55] 向玮, 雷相东, 刘刚, 等.近天然落叶松云冷杉林单木枯损模型研究[J].北京林业大学学报, 2008, 30(6): 90-98. doi: 10.3321/j.issn:1000-1522.2008.06.014 XIANG W, LEI X D, LIU G, et al. Individual tree mortality models for semi-natural larch-spruce-fir forests in Jilin Province, northeastern China[J]. Journal of Beijing Forestry University, 2008, 30(6): 90-98. doi: 10.3321/j.issn:1000-1522.2008.06.014
[56] MOWRER H T, FRAYER W E. Variance propagation in growth and yield projections[J]. Canadian Journal of Forest Research, 1986, 16(6): 1196-1200. doi: 10.1139/x86-213
-
期刊类型引用(8)
1. 鹿林,张程凯,张慧. 自橡子壳中提取橡子壳棕色素的实验研究. 中国食品添加剂. 2024(10): 179-186 .  百度学术
百度学术
2. 靳子旋,张岩岩,杜黔运,徐静,赵余庆. 橡子化学成分及药理作用的研究进展. 中草药. 2023(24): 8301-8308 . 百度学术
3. 翟淑红,曹洪坤,余诗琴,朱斯豪. 红菜苔多酚超声提取工艺优化及其抗氧化活性研究. 农产品加工. 2023(22): 49-52+56 . 百度学术
4. 张博,李德海,王泽童,王楚雅,王怡雪. 橡子壳主要成分的生理功能及开发利用研究. 食品工业科技. 2022(07): 393-399 . 百度学术
5. 王荣芳,张子言,李德海. 酶解法对蒙古栎实壳提取物活性成分及抗氧化活性的影响. 北京林业大学学报. 2022(05): 150-160 . 本站查看
6. 豆佳媛,何志鹏,梁馨月,逯莉. 橡子中挥发油的提取及抗氧化性质研究进展. 广东化工. 2021(24): 55-56 . 百度学术
7. 黄艳,傅新征,吴琳珊,李烨. 锥栗壳色素抗氧化活性研究. 食品科技. 2019(02): 274-280 . 百度学术
8. 魏园园,侯盼盼,梁宗瑶,任维维,李珉梦,高鹏程,张建新,段旭昌. 栓皮栎橡子壳多酚的体外抗氧化与抑菌活性研究. 现代食品科技. 2019(09): 190-197+73 . 百度学术
其他类型引用(8)


计量
- 文章访问数: 3237
- HTML全文浏览量: 782
- PDF下载量: 113
- 被引次数: 16
