
Simulation analysis of effects of wind field and photovoltaic DC field allocation on aeolian-sand structure
-
摘要: 以对比分析不同风场及电站配置模式下光伏阵列对风沙输移的影响差异为研究目的,通过风洞模拟实验对不同风速、风向、电站阵列行距及是否布设麦草沙障时阵列在0~50 cm内的输沙情况进行分析,并对风沙流结构进行了探讨。结果表明:1)在0~50 cm高度范围内,阵列模型的输沙率与风速大小呈正比,与集沙高度呈反比,3个试验风速下输沙率均以多项式拟合关系最佳;2)当风向为南风时阵列输沙率及其风沙流结构特征值(λ)最高,南风(180°)、东北风(45°)、西北风(315°)的输沙最佳拟合函数分别为多项式函数、对数函数和指数函数;3)当阵列行距为20 cm时(以野外电场为原型等比例缩小值)阵列输沙率最高;4)当阵列前端布设麦草沙障后阵列风沙流结构特征值(λ)为1.75,即此时风沙流呈不饱和状态,具有挟沙能力。Abstract: The sand transport and aeolian-sand structure of the array in 0-50 cm with different wind speeds, wind direction, power station array spacing, and whether or not there are the wheat straw sand barrier were analyzed by wind tunnel simulation, which aimed to investigate the effect of photovoltaic array on drifting sand with different allocation of wind field and photovoltaic DC field. The results showed that: 1) the sand transport rate of the array was proportional to the wind speed, and inversely proportional to the sand collection height in 0-50 cm. And the polynomial simulation of the sand transport rate under 3 kinds of wind speed was optimal. 2) The sand transport rate of the array and its characteristic value (λ) of aeolian-sand flow were the highest when the wind was south. And the best simulation of the south wind (180°), northeast wind (45°) and northwest wind (315°) were polynomial, logarithmic and exponential function, respectively. 3)The sand transport rate of the array in 20 cm (reduced in equal proportion to electric field) was the highest. 4) The characteristic value of aeolian-sand flow structure was 1.75 when the wheat straw sand barrier was laid at the front of the array, indicating unsaturated status and sand carrying capacity of aeolian-sand flow at this time.
-
Keywords:
- photovoltaic array /
- wind speed /
- wind direction /
- line space /
- wheat straw sand barrier
-
-
![]()
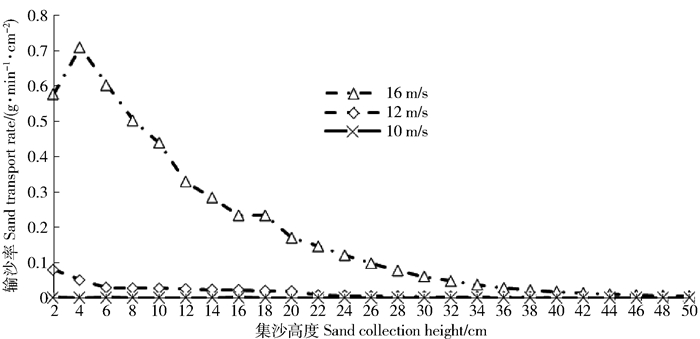
图 2 不同风速下输沙率随集沙高度的变化
Figure 2. Sand transport rate with sand collection height under different wind speeds
![]()
图 3 不同风向下输沙率随集沙高度的变化
Figure 3. Variation of sand transport rate with sand collection height
![]()
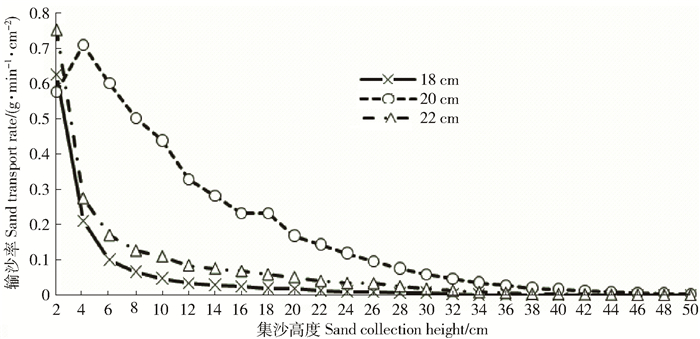
图 4 不同光伏阵列行距下输沙率随集沙高度的变化
Figure 4. Sand transport rate under different line spaces of photovoltaic array
![]()
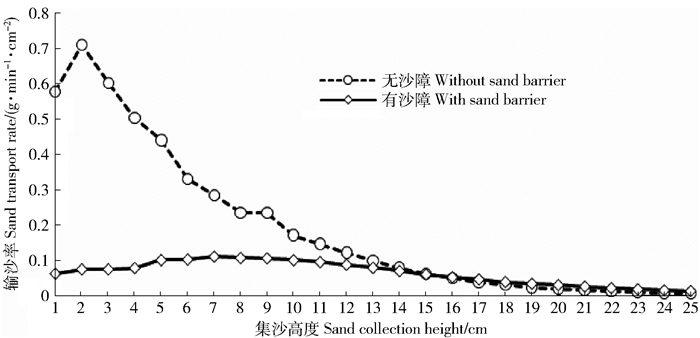
图 5 有无麦草沙障条件下输沙率随集沙高度的变化
Figure 5. Sand transport rate under laying straw sand barriers or not
表 1 光伏电板不同倾角理论发电值
Table 1 Theorectical power value for different dip angles of photovoltatic electroplax
kWh·m-2·d-1 月份
Month安装角度Installation angle 34° 35° 36° 37° 38° 39° 40° 41° 1月January 4.04 4.07 4.11 4.14 4.18 4.21 4.24 4.27 2月February 5.00 5.03 5.06 5.09 5.11 5.14 5.16 5.18 3月March 5.41 5.42 5.43 5.43 5.43 5.43 5.43 5.43 4月April 5.75 5.74 5.72 5.70 5.69 5.67 5.65 5.62 5月May 5.98 5.95 5.91 5.88 5.85 5.81 5.77 5.74 6月June 5.75 5.71 5.67 5.63 5.60 5.56 5.51 5.47 7月July 5.54 5.51 5.48 5.44 5.41 5.37 5.34 5.30 8月Augest 5.28 5.26 5.24 5.44 5.20 5.17 5.15 5.12 9月September 4.44 4.44 4.44 4.43 4.43 4.42 4.41 4.40 10月October 4.54 4.55 4.56 4.58 4.59 4.60 4.61 4.61 11月November 4.35 4.38 4.41 4.44 4.47 4.50 4.52 4.55 12月December 3.86 3.90 3.94 3.98 4.01 4.05 4.08 4.12 全年Annual/MWh 84 873.75 84 917.00 84 942.99 84 951.69 84 943.12 84 917.17 84 874.17 84 813.80  下载: 导出CSV
表 2 试验因素及水平的设置
Table 2 Test factors and levels for text
控制因素Test factor 试验水平Test level 水平1 Level 2 水平2 Level 2 水平3 Level 3 风向Wind direction/(°) 45 315 180 阵列行距Spacing of array/cm 18 20 22 是否布设沙障Setting barrier or not 是Exist 否Without
下载: 导出CSV
表 3 试验土壤颗粒的描述性统计特征
Table 3 Descriptive statistical characteristics of soil particle composition information
% 粒级Particle size 平均值Mean 最大值Max. 最小值Min. 标准差Standard deviation 粗沙Coarse sand (1.0~0.5 mm) 11.99 15.95 7.08 4.38 中沙Middle sand (0.5~0.25 mm) 47.46 49.18 44.45 2.04 细沙Silver sand (0.25~0.1 mm) 38.93 43.04 35.36 3.16 极细沙Very fine sand (0.1~0.05 mm) 1.49 2.65 0.7 0.88
下载: 导出CSV
表 4 不同风速下输沙率随集沙高度变化拟合方程
Table 4 Fitting equations for the relationships between sand transport rate and sand collection heights under different wind speeds
风速Wind speed/
(m·s-1)关系式
Relational expression相关系数
Correlation coefficient相关选择
Correlate selection10 Q=2×10⁻⁶h2-7×10⁻⁵h+0.000 7 R2=0.844 2 最佳Optimum Q=-3×10⁻⁴ln(h)+0.000 8 R2=0.840 4 相关Related 12 Q=-0.022ln(h)+0.065 3 R2=0.932 1 最佳Optimum Q=0.000 2h2-0.006 4h+0.061 6 R2=0.807 5 相关Related 16 Q=1.258 3e-0.215h R2=0.985 4 最佳Optimum Q=0.001 8h2-0.072 7h+0.744 1 R2=0.970 4 较佳Better Q=-0.249ln(h)+0.769 1 R2=0.925 2 较佳Better
下载: 导出CSV
表 5 风速对风沙流结构分布的影响
Table 5 Sand flow structure with different wind speeds
风速Wind speed/
(m·s-1)总输沙率
Total sand transport
rate/(g·min-1·cm-2)不同高度气流场输沙率
Sand transport rate of airflow field under different heights/%特征值
Characteristic value
(λ)0~10 cm 10~20 cm 20~50 cm 10 0.004 54.67 39.72 5.61 0.10 12 0.370 57.80 30.25 11.95 0.21 16 4.770 59.37 26.16 14.47 0.24
下载: 导出CSV
表 6 不同风向下输沙率随集沙高变化拟合方程
Table 6 Fitting equation for the relationships between sand transport rate and sand collection heights under different wind directions
风向 Wind direction 拟合关系式 Simulated relation expression 相关系数 Correlation coefficient 相关选择 Correlate selection 45° Q=0.379 8e-0.249h R2=0.974 2 最佳 Optimum Q= 1.703 8h-2.042 R2=0.842 0 相关 Related 315° Q=0.240 9e-0.159h R2=0.931 2 最佳 Optimum Q=-0.113 ln(h)+0.3273 R2=0.860 9 较佳 Better Q=0.001 1h2-0.039 3h+0.328 1 R2=0.809 6 较佳 Better 180° Q=1.258 3e-0.215h R2=0.985 4 最佳 Optimum Q=0.001 8h2-0.072 7h+0.744 1 R2=0.970 4 较佳 Better Q=-0.249 ln(h)+0.769 1 R2=0.925 2 较佳 Better
下载: 导出CSV
表 7 风向对风沙流结构分布的影响
Table 7 Sand flow structure with different sand directions
风向
Wind direction总输沙率
Total sand tansport rate/
(g·min-1·cm-2)不同高度气流场输沙率
Sand transport rate of different height airflow field/%特征值
Characteristic value (λ)0~10 cm 10~20 cm 20~50 cm 180° 4.77 59.37 26.16 14.47 0.24 315° 1.65 66.70 20.51 12.79 0.19 45° 1.42 72.46 17.53 10.02 0.14
下载: 导出CSV
表 8 输沙率随光伏阵列行距变化的拟合方程
Table 8 Fitting equations for the relationships between sand transport rate and sand collection heights with different line spaces of photovoltaic array
行距 Spacing/cm 关系式 Relation expression 相关系数 Correlation coefficient 相关选择 Correlate selection 18 Q=-0.122ln(h)+0.331 4 R2=0.626 2 最佳 Optimum Q=0.001 4h-0.045 4h+0.334 5 R2=0.559 3 较佳 Better 20 Q=1.258 3e-0.215h R2=0.985 4 最佳 Optimum Q=0.001 8h-0.072 7h+0.744 1 R2=0.970 4 较佳 Better Q=-0.249ln(h)+0.769 1 R2=0.925 2 较佳 Better 22 Q=0.537 2e-0.25h R2=0.975 3 最佳 Optimum Q=2.330 9h2.032 R2=0.829 4 相关 Related
下载: 导出CSV
表 9 光伏阵列行距对风沙流结构分布的影响
Table 9 Sand flow structure with different line spaces of photovoltaic array
行距
Spacing/cm总输沙率
Total sand transport rate/
(g·min-1·cm-2)不同高度气流场输沙率
Sand transport rate of different height airflow field/%特征值
Characteristic value
(λ)0~10 cm 10~20 cm 20~50 cm 18 1.22 85.73 10.13 4.15 0.05 20 4.77 59.37 26.16 14.47 0.24 22 1.98 72.72 17.29 9.99 0.14
下载: 导出CSV
表 10 输沙率随是否布设沙障的拟合方程
Table 10 Fitting equations for the relationships between sand transport rate and sand collection heights with laying straw sand barriers or not
是否布设沙障
Setting barrier or not关系式
Relation expression相关系数
Correlation coefficient相关选择
Correlate selection有 With Q=-0.000 3h2+0.004 2h+0.075 4 R2=0.855 2 最佳 Optimum Q=0.147 2e-0.078h R2=0.732 4 较佳 Better 无 Without Q=1.258 3e-0.215h R2=0.985 4 最佳 Optimum Q=0.001 8h2-0.072 7h+0.744 1 R2=0.970 4 较佳 Better Q=-0.249ln(h)+0.769 1 R2=0.925 2 较佳 Better
下载: 导出CSV
表 11 布设沙障对风沙流结构分布的影响
Table 11 Sand flow structure with laying straw sand barriers or not
是否布设沙障
Setting barrier or not总输沙率
Total sand transport rate/
(g·min-1·cm-2)不同高度气流场输沙率
Sand transport rate of airflow field under different heights/%特征值
Characteristic value
(λ)0~10 cm 10~20 cm 20~50 cm 有沙障Exist 1.59 24.43 32.93 42.64 1.75 无沙障Without 4.77 59.37 26.16 14.47 0.24
下载: 导出CSV
-
[1] 周青, 徐林波, 周艳红.占地集约化光伏阵列布置方式研究[J].建筑电气, 2016, 35(9):53-56. doi: 10.3969/j.issn.1003-8493.2016.09.011 ZHOU Q, XU L B, ZHOU Y H. A study on the layout mode of land-intensive photovoltaic arrays[J]. Building Electricity, 2016, 35(9):53-56. doi: 10.3969/j.issn.1003-8493.2016.09.011
[2] 常兆丰, 刘世增, 朱淑娟, 等.沙漠戈壁光伏电厂的生态功能(英文)[J].Journal of Resources and Ecology, 2016, 7(2):130-136. http://d.old.wanfangdata.com.cn/Periodical/zyystxb-e201602008 CHANG Z F, LIU S Z, ZHU S J, et al. Ecological functions of PV power plants in the desert and gobi[J]. Journal of Resources and Ecology, 2016, 7(2):130-136. http://d.old.wanfangdata.com.cn/Periodical/zyystxb-e201602008
[3] 张正偲, 董治宝, 赵爱国, 等.输沙量与输沙势的关系[J].中国沙漠, 2011, 31(4):824-827. http://d.old.wanfangdata.com.cn/Periodical/zgsm201104003 ZHANG Z C, DONG Z B, ZHAO A G, et al. Relationship between sand transport and sand drift potential[J]. Journal of Desert Research, 2011, 31(4):824-827. http://d.old.wanfangdata.com.cn/Periodical/zgsm201104003
[4] 岳高伟, 毕伟, 贾慧娜.风沙运动的理论模拟和风洞实验对比研究[J].干旱区地理, 2014, 37(1):81-88. http://d.old.wanfangdata.com.cn/Periodical/ghqdl201401009 YUE G W, BI W, JIA H N. Theoretical simulation and wind tunnel experiment in wind-blown sand movement[J]. Arid Land Geography, 2014, 37(1):81-88. http://d.old.wanfangdata.com.cn/Periodical/ghqdl201401009
[5] 蒋红, 佟鼎, 黄宁.坡面风沙运动的风洞实验及数值模拟[J].工程力学, 2011, 28(12):190-198. http://www.wanfangdata.com.cn/details/detail.do?_type=perio&id=gclx201112029 JIANG H, TONG D, HUANG N. The numerical simulation and wind tunnel experiment on windblown sand movement over the slope surface[J]. Engineering Mechanics, 2011, 28(12):190-198. http://www.wanfangdata.com.cn/details/detail.do?_type=perio&id=gclx201112029
[6] 吴正.风沙地貌学[M].北京:科学出版社, 1987: 38-39. WU Z. Aeolian geomorphology[M].Beijing: Science Press, 1987: 38-39.
[7] 李得禄, 满多清, 朱国庆, 等.丘间低地不同部位风沙流结构特征[J].中国沙漠, 2012, 32(5):1210-1215. http://d.old.wanfangdata.com.cn/Periodical/zgsm201205005 LI D L, MAN D Q, ZHU G Q, et al. Aeolian-sand flow structure characteristics at different position in inter-dune lowland[J]. Journal of Desert Research, 2011, 32(5):1210-1215. http://d.old.wanfangdata.com.cn/Periodical/zgsm201205005
[8] 包岩峰, 丁国栋, 吴斌, 等.毛乌素沙地风沙流结构的研究[J].干旱区资源与环境, 2013, 27(2):118-123. http://www.wanfangdata.com.cn/details/detail.do?_type=perio&id=ghqzyyhj201302021 BAO Y F, DING G D, WU B, et al. Study on the wind-sand flow structure in Mu Us Sandy Land[J]. Journal of Arid Land Resources and Environment, 2013, 27(2):118-123. http://www.wanfangdata.com.cn/details/detail.do?_type=perio&id=ghqzyyhj201302021
[9] 张伟, 杨淑敏.风速及碰撞系数对风沙流输沙率沿流向变化规律的影响[J].科学技术与工程, 2016, 16(30):142-147. doi: 10.3969/j.issn.1671-1815.2016.30.023 ZHANG W, YANG S M. Effect of wind speed and restitution coefficient on evolution of stream wise sand transport with distance[J]. Science Technology and Engineering, 2016, 16(30):142-147. doi: 10.3969/j.issn.1671-1815.2016.30.023
[10] 杜鹤强, 韩致文, 邓晓红, 等.基于GIS空间分析技术的新月形沙丘表面输沙率模型研究[J].中国沙漠, 2011, 31(4):815-823. http://d.old.wanfangdata.com.cn/Periodical/zgsm201104002 DU H Q, HAN Z W, DENG X H. A sand flux model for the surface of birchen dunes using gis-based spatial analysis[J]. Journal of Desert Research, 2011, 31(4):815-823. http://d.old.wanfangdata.com.cn/Periodical/zgsm201104002
[11] 柳本立, 张伟民, 刘小宁, 等.莫高窟顶戈壁偏东风作用下输沙率变化的观测研究[J].中国沙漠, 2010, 30(3):516-521. http://d.old.wanfangdata.com.cn/Periodical/zgsm201003008 LIU B L, ZHANG W M, LIU X N, et al. Field measurements of sand transport rate change under easterly wind condition over gobi land atop Mogao Grottoes[J]. Journal of Desert Research, 2010, 30(3):516-521. http://d.old.wanfangdata.com.cn/Periodical/zgsm201003008
[12] 黎小娟, 李宁, 周智彬, 等.尼龙网方格沙障的风沙流颗粒分布特征[J].水土保持学报, 2016, 30(5):128-134. http://d.old.wanfangdata.com.cn/Periodical/trqsystbcxb201605022 LI X J, LI N, ZHOU Z B, et al. Characteristic of sand flux structure and sand particle size distribution based on nylon net check board barrier[J]. Journal of Soil and Water Conservation, 2016, 30(5):128-134. http://d.old.wanfangdata.com.cn/Periodical/trqsystbcxb201605022
[13] 周颖, 曹月娥, 杨建军, 等.古尔班通古特沙漠东缘风沙流结构特征[J].水土保持学报, 2016, 30(3):78-83. http://d.old.wanfangdata.com.cn/Periodical/trqsystbcxb201603015 ZHOU Y, CAO Y E, YANG J J, et al. Sand flow structure characteristics in East of Gurban Tunggut Desert[J]. Journal of Soil and Water Conservation, 2016, 30(3):78-83. http://d.old.wanfangdata.com.cn/Periodical/trqsystbcxb201603015
[14] 徐军, 郝玉光, 刘芳, 等.乌兰布和沙漠不同下垫面风沙流结构与变异特征[J].水土保持研究, 2013, 20(4):95-98. http://d.old.wanfangdata.com.cn/Periodical/stbcyj201304019 XU J, HAO Y G, LIU F, et al. Wind-sand flow structure and its variation under different surface conditions in the Ulanbuh Desert[J]. Research of Soil and Water Conservation, 2013, 20(4):95-98. http://d.old.wanfangdata.com.cn/Periodical/stbcyj201304019
[15] 高函, 张宇清, 吴斌, 等.柠条林防风阻沙效益模拟研究初报[J].北京林业大学学报, 2010, 32(4):175-180. http://j.bjfu.edu.cn/article/id/9437 GAO H, ZHANG Y Q, WU B, et al. Simulating efficiency of wind-speed reduction and sand-break of Caragana korshinskii coppice[J]. Journal of Beijing Forestry University, 2010, 32(4):175-180. http://j.bjfu.edu.cn/article/id/9437
[16] 马小明, 吕萍. 3种典型地表风沙流通量廓线研究现状[J].中国沙漠, 2016, 36(2):302-306. http://d.old.wanfangdata.com.cn/Periodical/zgsm201602007 MA X M, Lü P. The research status on mass-flux-density profile over three kinds of typical surface[J]. Journal of Desert Research, 2016, 36(2):302-306. http://d.old.wanfangdata.com.cn/Periodical/zgsm201602007
[17] 薛智德, 刘世海, 许兆义, 等.青藏铁路措那湖沿岸防风固沙工程效益[J].北京林业大学学报, 2010, 32(6):61-65. http://j.bjfu.edu.cn/article/id/9494 XUE Z D, LIU S H, XU Z Y, et al. Efficiency of wind erosion control measures along Cuona Labe on Qinghai-Tibet Railway, western China[J]. Journal of Beijing Forestry University, 2010, 32(6):61-65. http://j.bjfu.edu.cn/article/id/9494
[18] 邳华伟, 冯广龙.塔里木盆地西北部3种典型下垫面风沙活动特征[J].干旱区研究, 2016, 33(2):441-448. http://d.old.wanfangdata.com.cn/Periodical/ghqyj201602029 PI H W, FENG G L. Characteristics of wind-blown sand over three typical underlying surfaces in the northwest Tarim Basin[J]. Arid Zone Research, 2016, 33(2):441-448. http://d.old.wanfangdata.com.cn/Periodical/ghqyj201602029
[19] 陶彬彬, 刘丹, 管超, 等.库布齐沙漠南缘抛物线形沙丘表面风沙流结构变异[J].地理科学进展, 2016, 35(1):98-107. http://d.old.wanfangdata.com.cn/Periodical/dlkxjz201601011 TAO B B, LIU D, GUAN C, et al. Variation of aeolian sediment flux profiles on a parabolic dune at the southern fringe of the Hobq Desert[J]. Progress in Geography, 2016, 35(1):98-107. http://d.old.wanfangdata.com.cn/Periodical/dlkxjz201601011
[20] 王翠, 李生宇, 雷加强, 等.近地表风沙流结构对过渡带不同下垫面的响应[J].水土保持学报, 2014, 28(3):52-56, 71. http://d.old.wanfangdata.com.cn/Periodical/trqsystbcxb201403010 WANG C, LI S Y, LEI J Q, et al. Near-surface sand flux structure responses to different underlying surface in oasis-desert ecotone[J]. Journal of Soil and Water Conservation, 2014, 28(3):52-56, 71. http://d.old.wanfangdata.com.cn/Periodical/trqsystbcxb201403010
-
期刊类型引用(6)
1. 刘树超,邵全琴,杨帆,郭兴健,王东亮,黄海波,汪阳春,刘纪远,樊江文,李愈哲. 黄河源区放牧家畜数量及空间分布无人机遥感调查. 地球信息科学学报. 2021(07): 1286-1295 .  百度学术
百度学术
2. 郑硕,薛兴盛,白杨,吴艳兰. 徐淮地区冬季AOD时空特征及气象因子研究. 环境科学与技术. 2020(01): 78-85 . 百度学术
3. 柴曼,周滨,徐威杰,陈晨,刘文权. 基于多尺度分割GF-1影像地表覆盖信息提取研究. 内蒙古煤炭经济. 2020(06): 1-4 . 百度学术
4. 贾亮亮,汪小钦,苏华,王峰. 台湾岛高分一号卫星WFV数据气溶胶反演与验证. 环境科学学报. 2018(03): 1117-1127 . 百度学术
5. 李裕冬,罗艳,赵海涛,王程亮,杜杰. 基于MaxEnt模型的九寨沟国家级自然保护区川金丝猴适宜生境研究. 四川动物. 2018(05): 585-591 . 百度学术
6. 贾亮亮,汪小钦,王峰. 基于波段运算和纹理特征的高分一号多光谱数据云检测. 遥感信息. 2018(05): 62-68 . 百度学术
其他类型引用(6)

计量
- 文章访问数: 2722
- HTML全文浏览量: 497
- PDF下载量: 50
- 被引次数: 12
