
Quantitative characterization of decay detection in standing trees of Korean pine based on Resistograph and ERT
-
摘要:
为了定量表征红松活立木内部腐朽情况,在黑龙江省五营国家森林公园选取了15棵有不同腐朽程度的红松,应用Resistograph树木微钻阻抗仪和PiCUS Treetronic树木电阻断层成像仪得到南北向与东西向的微钻阻力变化和同样高度上的截面电阻率分布图,对比分析阻抗仪测量方向上的电阻率变化和微钻阻力变化。用树木生长锥在样木的测量位置附近各取南北向与东西向的木芯,将其带回实验室测量质量损失率。将微钻阻力的下降幅度定义为阻力损失,对阻力损失和木芯质量损失率进行回归分析。还用腐朽和健康部分的电阻率均值定义了电阻率的异常程度, 并对其和阻力损失进行了回归分析。以阻抗仪为基准在电阻率分布图上对腐朽部位定位,应用监督分类的方法在图上将腐朽与健康部分区分出来,并计算腐朽面积所占比例。然后用最小二乘法将算得的比例与木芯质量损失率作回归分析。结果表明:平均阻力损失与木芯质量损失率之间存在显著的线性相关关系,阻抗仪可以较准确地表征一维直线上的腐朽情况;微钻阻力变化曲线上发生阻力值明显下降的位置对应的电阻率也会发生明显变化,阻力损失值和电阻率异常程度存在显著指数关系,还能推断出电阻断层成像检测对于轻度腐朽更加敏感,而阻抗仪检测对较严重的腐朽更加敏感;联合阻抗仪和电阻断层成像技术能够确定腐朽的位置和面积,得到的腐朽面积所占比例与木芯质量损失率有显著线性相关关系。
Abstract:In order to quantify the extent of wood decay of Korean pine (Pinus koraiensis), fifteen Korean pine standing trees were selected in Wuying National Forest Park of Heilongjiang Province of northeastern China. Resistograph and PiCUS Treetronic ERT were applied to gain the variation of micro-drilling resistance and the distribution of cross-sectional electrical resistivity, which were compared in the same direction. Mass loss rate was measured through increment wood cores. Resistance loss, defined by the extent of micro-drilling resistance's decline, was compared with mass loss rate by regression analysis. Besides, abnormal extent of electrical resistivity was defined by the averages of electrical resistivity of decay and healthy portion and regression analysis was performed to derive the relation between it and resistance loss. The decay area can be located by the resistance curve on the electrical resistivity profile and computed through supervised classification. The percent of decay area we calculated was examined by its relation with mass loss rate with the method of ordinary linear square. The results indicated that: 1) the average of resistance loss had a significant linear relation with mass loss rate and Resistograph can be used to accurately detect the decay in one dimension. 2) Significant changes on the electrical resistivity profile took place where there was a noticeable decline on the micro-drilling resistance curve. Resistance loss showed a significant exponential relationship with abnormal extent of electrical resistivity and it can also be deduced that ERT detection was more sensitive to mild wood decay, while Resistograph detection was sensitive to severe decay. 3)The location and area of wood decay can be confirmed by combining Resistograph and ERT technique and there was a high linear correlation between the percent of calculated decay area and mass loss rate.
-
我国木材的综合利用率低,平均70%以下,与发达国家的平均80%以上有较大差距[1]。准确地检测木材缺陷对于提高木材利用率十分有效。木材无损检测能够在不破坏木材特性前提下,通过各种技术手段在较短时间内获得其理化特征来反映缺陷程度,是现今木材检测的重点研究方向[2]。
木材无损检测技术出现的相对较晚,但是近几十年中发展迅速,先后有学者将超声波、X射线、微波和电阻测量等技术应用到木材无损检测[3]。经过不断地探索和研究发现,每种方法都有各自的优点和不足。因此联合不同的测量方法对木材进行综合性评估有利于提高检测的精度,是未来木材无损检测的趋势[2]。国内外有学者采用联合方法对木材进行无损检测。Divos[4]使用声学断层成像和应力波技术,获得了树木内部截面上的缺陷形状。Wang等[5]比较了目测法、声学法及阻抗仪测量的特点,认为综合多种方法能够提高木材检测的准确性。孙天用和王立海[6]使用应力波和X射线二维CT图像技术测量了原木内部腐朽,发现两者都能反映腐朽区域的形状,且X射线能进一步反映腐朽程度。葛晓雯等[7]运用应力波和阻抗仪技术检测了旱柳立木的内部腐朽,结果表明两种方法都能确定腐朽的位置,微钻阻力和应力波速有一定相关性。
应用阻抗仪和电阻断层成像仪(ERT)在野外环境下对内部有不同腐朽程度的红松(Pinus koraiensis)活立木进行测量。阻抗仪能够记录探针钻入木材时一维直线方向上的微钻阻力变化,一旦木材内部发生腐朽、裂纹、虫蛀等缺陷,其力学性能会有所下降,在微钻阻力变化曲线上相应地表现为阻力值的下降[8]。电阻断层成像技术是电阻法应用于木材无损检测的发展,基于电磁理论和有限元理论,结合计算机成像技术,能够反映木材的二维或三维的电阻率分布情况[9]。关于联合这两种检测手段进行木材无损检测的研究很少。本研究比较和评价这两种检测方法的测量结果,并根据各自的优点联合两种方法,明确划定红松活立木二维截面上的腐朽区域,为定量表征红松活立木腐朽提供理论依据。
1. 材料与方法
1.1 材料
在黑龙江省五营国家森林公园内选择红松种植密集的区域,划定一块样地,其面积约为30 hm2,坡度平缓,一般不超过10°。由经验丰富的林场工作人员目测挑选15棵有不同腐朽程度的红松作为待测样木,相邻两棵样木的间距都大于10 m。15棵树的基本情况列于表 1。
表 1 样木的基本情况Table 1. Profile of 15 sample trees to be measured样木编号
No. of sample tree胸径
DBH/mm树高
Height of tree/m含水率
Moisture content/%1 411 22.8 40.88 2 796 31.4 38.44 3 618 29.7 50.46 4 600 27.9 69.92 5 713 30.8 46.97 6 487 27.7 41.50 7 461 25.6 53.67 8 359 21.7 54.42 9 439 24.9 34.33 10 640 30.3 49.17 11 563 27.5 32.01 12 583 28.4 34.13 13 537 26.8 56.97 14 665 29.2 35.39 15 468 26.1 53.90 1.2 研究方法
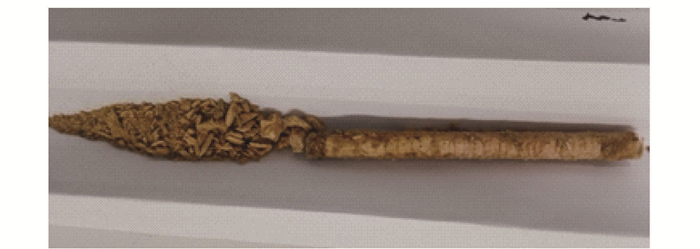
首先在距离地面130 cm处用胸径尺测量样木的直径, 记为D2,并使用指南针记录方向,同时用树木测高仪(瑞典制造)测量树高。再用PiCUS Treetronic树木电阻断层成像仪(德国制造)在同样高度的截面上测量,ERT的1号电压传感器置于正北(或南)方向,逆时针等间距布置12个传感器进行测量,测量完成后保存样木截面的电阻率图像。然后在同一高度上分别沿南北向和东西向用Resistograph树木微钻阻抗仪(德国制造)测量,记录微钻阻力变化曲线,文中所有阻力皆为微钻阻力。阻抗仪测量完成后,用树木生长锥(瑞典制造)分别在测量位置附近取1~2根木芯,放入密封袋中保存。图 1为6号样木的木芯照片。在实验室环境下取出木芯,用电子分析天平称其质量m1(g),再用电热鼓风干燥箱(70 ℃)将其烘干至恒重并记录质量m2(g)和长度a(a取树木生长锥的长度25 cm)。再选择木芯的一段健康部分测量其质量m3(g)和长度b(cm),用m3/b表示健康材的线密度,用am3/b表示健康材的质量,记为m4(g)。含水率MC(%)根据下式计算:
MC=m1−m2m2×100% 质量损失率L(%)由下面的公式计算得到。对同一棵树取得的多个木芯,以其均值代表它的质量损失率。
L=m4−m2m4×100% 2. 结果与分析
2.1 阻抗仪检测表征与木芯质量损失率的关系
图 2实线部分为沿东西方向测得的6号样木的微钻阻力变化曲线图。发生腐朽等缺陷区域的力学强度会减小,阻抗仪测得的微钻阻力值相对于健康部分有所下降。从图上能够看出两处明显的微钻阻力下降区域,在横坐标上分别用线段EF和GH标记其位置。用微钻阻力的下降幅度定量表征腐朽程度,定义阻力损失Z (resi)如下[10]:
![]() 图 2 电阻率和微钻阻力随探头钻入深度的变化H1和H2分别为波谷的左右两边在右侧微钻阻力坐标轴上的投影长度(resi);D1为波谷在横坐标上的投影长度(mm)。Figure 2. Electrical resistivity and micro-drilling resistance varying with drilling depthH1 and H2 are projection lengths (resi) of left and right sides of the trough on the vertical axis of mocro-drilling resistance curve, respectively; D1 is projection length (mm) of the trough on the horizontal axis.
图 2 电阻率和微钻阻力随探头钻入深度的变化H1和H2分别为波谷的左右两边在右侧微钻阻力坐标轴上的投影长度(resi);D1为波谷在横坐标上的投影长度(mm)。Figure 2. Electrical resistivity and micro-drilling resistance varying with drilling depthH1 and H2 are projection lengths (resi) of left and right sides of the trough on the vertical axis of mocro-drilling resistance curve, respectively; D1 is projection length (mm) of the trough on the horizontal axis.Z=(H1+H2)D12D2 式中:H1和H2分别为波谷的左右两边在右侧微钻阻力坐标轴上的投影长度,resi;D1为波谷在横坐标上的投影长度,mm;D2为所测截面的直径,mm。表 2中的平均阻力损失由该样木东西方向上的总阻力损失与南北方向上总阻力损失之和除以2得到,15棵样木的不同测量方向上的阻力损失列于表 3。
表 2 质量损失率与平均阻力损失Table 2. Mass loss rate and average of resistance loss样木编号
No. of sample tree平均阻力损失
Average of resistance loss/resi质量损失率
Mass loss rate/%1 19.00 32.48 2 21.51 46.24 3 7.24 19.80 4 5.04 36.12 5 2.15 10.46 6 22.55 35.37 7 4.45 24.63 8 4.64 19.33 9 26.00 40.04 10 6.37 7.81 11 32.18 51.15 12 19.64 43.47 13 4.22 23.95 14 15.44 29.45 15 26.74 68.92 表 3 阻力损失及对应的电阻率异常程度Table 3. Resistance loss and corresponding abnormal extent of electrical resistivity样木编号
No. of sample tree方向
Direction波谷个数
Number of troughs左端圆心距
Center distance of left end (d1)/mm右端圆心距
Center distance of right end (d2)/mm阻力损失
Resistance loss/resi电阻率异常程度
Abnormal extent of electrical resistivity/%1 东西向East-west 3 78.0 31.5 9.14 103.83 31.5 -44.0 8.50 43.73 -62.5 -77.0 1.37 39.63 2 南北向North-south 2 266.5 -43.5 27.36 116.56 257.0 185.5 6.68 57.53 东西向East-west 2 185.5 167.0 1.02 42.73 142.0 -23.0 7.94 77.21 3 东西向East-west 2 299.0 250.0 4.76 9.72 167.0 132.0 2.48 52.31 4 东西向East-west 1 160.0 119.0 5.04 96.23 5 南北向North-south 2 -10.5 -30.5 1.49 29.56 -30.5 -55.5 1.66 23.60 东西向East-west 1 314.0 284.5 1.14 5.17 6 南北向North-south 4 107.5 58.5 5.08 33.98 51.0 13.5 5.58 14.15 13.5 0.5 1.22 17.42 -21.5 -81.5 6.48 21.20 东西向East-west 2 156.5 71.0 7.17 42.33 39.5 -83.5 19.56 121.21 7 南北向North-south 2 -52.0 -72.5 2.75 8.12 -77.5 -92.5 1.37 19.72 东西向East-west 2 8.0 -19.5 3.00 42.00 -108.5 -125.5 1.77 61.47 8 南北向North-south 1 127.0 106.5 4.64 0.75 9 南北向North-south 2 29.5 -28.0 10.81 111.24 -28.0 -155.5 20.69 127.96 东西向East-west 4 113.5 54.5 7.73 90.79 44.5 -8.0 3.80 63.61 -8.0 -74.5 7.83 38.58 -116.0 -128.5 1.14 4.37 10 南北向North-south 2 25.0 -23.0 3.15 62.00 -34.0 -76.0 3.94 75.07 东西向East-west 1 194.0 106.0 5.64 64.32 11 南北向North-south 1 64.5 -154.5 34.62 129.35 东西向East-west 3 160.5 141.5 1.51 21.56 141.5 98.5 3.40 10.99 98.5 -134.5 24.83 111.51 12 南北向North-south 2 216.5 151.5 6.83 6.83 96.5 -33.5 4.46 4.46 东西向East-west 1 136.5 -103.5 27.99 112.42 13 南北向North-south 1 -121.5 -152.0 3.41 43.99 东西向East-west 1 -121.5 -166.5 5.03 91.07 14 南北向North-south 4 238.5 170.5 6.01 23.65 170.5 155.5 0.79 53.95 140.5 106.5 2.75 36.76 106.5 22.5 4.89 26.78 东西向East-west 2 161.5 5.0 13.06 109.34 -15.5 -71.5 3.37 3.49 15 南北向North-south 1 188.0 -167.0 32.03 114.87 东西向East-west 2 185.0 140.0 5.12 40.39 140.0 -56.0 16.33 120.13 质量损失率是反映木材性质的一个重要指标[11],在本试验中用它作为腐朽程度的真值。15棵样木的平均阻力损失和质量损失率列于表 2。以质量损失率为自变量,平均阻力损失为因变量进行一元回归分析,结果如图 3所示。回归方程Z=0.512L-2.232(R2=0.646,P<0.01)的拟合程度较高,表明了木芯的质量损失率越大,对应的阻力损失(即微钻阻力的下降程度)越大,两者呈线性正相关关系。
![]() 图 3 质量损失率与平均阻力损失散点图Figure 3. Scatter-plot of mass loss rate and average of resistance loss
图 3 质量损失率与平均阻力损失散点图Figure 3. Scatter-plot of mass loss rate and average of resistance loss出现这种现象的原因是随着腐朽的持续进行,木材降解程度增加,绝干密度减小,木芯质量损失率增加。相关研究表明:随着质量损失率增加,木材的弹性模量和抗弯强度等力学性能也会显著下降[12]。而阻抗仪记录的是探头受到的微钻阻力值,也是木材力学性能的表现。因此木材质量损失率和阻力损失有较强的线性相关关系,在本次试验中能够将微钻阻力下降的位置和相应的阻力损失作为该一维直线方向上腐朽的参考位置和相应的腐朽程度。
2.2 ERT检测表征与阻抗仪检测表征的关系
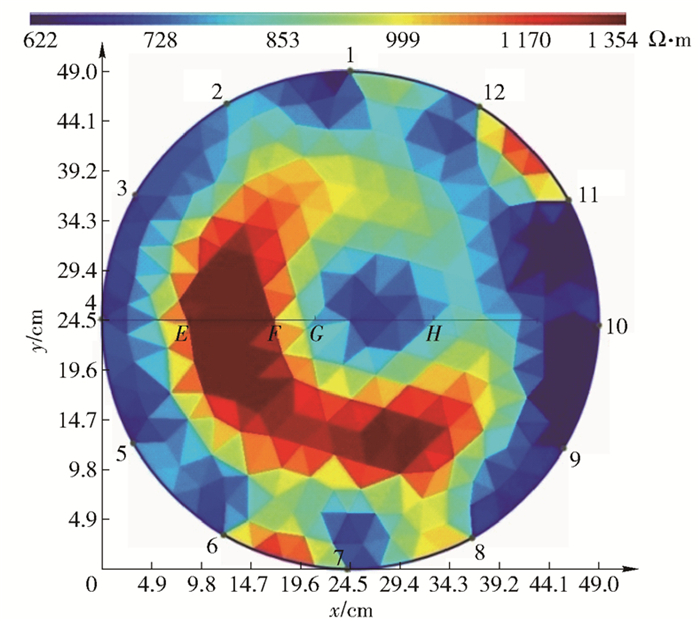
ERT的工作原理是通过激励电极在立木表面施加交变电流,在立木内部形成一定交变电场,内部电阻率的任何变化都会引起立木表面电位的变化,通过测量电极收集立木周围的电位变化信息,根据一定的算法重建立木截面上的电阻率分布,得到截面上的电阻率二维图像[13]。其中木材电阻率受含水率、温度、密度和纹理方向等因素的影响[11]。图 4为6号样木的ERT图像,能够展现立木二维截面上的电阻率分布,蓝色越深对应电阻率越小,红色越深则相反。ERT图像与微钻阻力变化曲线均在距地130 cm处测得。
前文已经证明了阻抗仪检测能够准确反映活立木一维直线方向上的腐朽情况,因此以微钻阻力变化曲线为参考,用同一方向上的电阻率变化与其对比。在ERT图像上根据颜色渐变手工提取东西和南北方向的电阻率值并制成曲线,图 2中的虚线部分为6号样木东西方向上的电阻率变化曲线。对比阻抗仪记录的微钻阻力变化曲线和相应的电阻率变化曲线,能够发现发生微钻阻力值明显下降的位置,相应的电阻率也有明显变化,如图 2中EF段电阻率陡然增大而GH段电阻率明显减小。因此这种现象定性地说明腐朽部分的电阻率值会变得与健康材质的电阻率明显不同,而变化趋势相反是因为这两处的腐朽程度不同或存在不同类型的缺陷。一般来说,与健康材的电阻率相比,处于前中期腐朽的木材的电阻率会发生明显下降[14],而非常严重腐朽或空洞部分的电阻率则会显著增大[15]。值得一提的是,由于阻抗仪检测是将探头从树皮逐渐打入木质部,因此得到的微钻阻力变化曲线包含一定厚度的树皮部分;而ERT检测则是将探测器直接钉入木质部,得到的图像是不包括树皮部分的,所以图 2中的电阻率与微钻阻力的曲线会受树皮厚度的影响,图 2只能用来定性判断微钻阻力下降与电阻率变化的关系。
因为前述的阻力损失Z与质量损失率L有很好的线性关系,能够通过微钻阻力下降的位置和相应的阻力损失大小判断腐朽的位置和腐朽程度,所以在ERT图像上的相同直线方向上标记出微钻阻力下降的位置作为腐朽发生的位置,如图 4上的EF和GH段。在ERT图像上判断腐朽时,为了消除树皮厚度对位置判断的影响,先从样木的胸径得出其半径(r=D2/2),再减去微钻阻力变化曲线上腐朽位置的两个坐标以消去树皮厚度,得到腐朽位置的圆心距,列于表 3。以6号样木为例,E点的圆心距d1=r-OE, F点圆心距d2=r-OF, 负值表示在圆心另一侧。再根据圆心距标记ERT图像上一维直线方向上的腐朽位置。在微钻阻力变化曲线范围内将其他部分标记为健康部分,如图 4中除了EF段和GH段以外的线段。为了研究腐朽部分与健康部分的电阻率差异,定义电阻异常程度V(%)如下:
V=|R1−R2|R2×100% 式中:R1为微钻阻力变化曲线中波谷对应线段(视为腐朽部分,如图 4中的EF段或GH段)的电阻率均值;R2表示在阻抗仪的测量长度范围内,除了波谷以外的区间(视为健康部分,如图 4中的除了EF段和GH段以外的部分)对应的电阻率均值。考虑到不同的样木的生长阶段和立地环境有差别,为了尽可能消除这些差别导致的电阻率差异,用每棵样木自身的腐朽部分与健康部分的电阻率差来抵消这些因素的影响,以便将不同样木腐朽与健康部分的电阻率差异进行比较。
表 3为15棵样木东西和南北方向上的阻力损失及对应的电阻率异常程度。阻力损失值由微钻阻力变化曲线上的波谷(微钻阻力的明显下降)计算而来, 部分样木只在一个方向的微钻阻力变化曲线上有明显的波谷,波谷的数量和位置(以圆心距表示)同样列于表 3。以电阻率异常程度为自变量,阻力损失为因变量做两者的散点图,非线性回归得到两者呈显著的指数关系,回归方程为Z=2.813+0.182e0.039V(R2=0.755,P<0.01),结果如图 4所示。从图上看出除了极少数几个点的电阻率异常程度小于5%,绝大多数的电阻率异常程度都大于10%。说明微钻阻力发生明显下降的腐朽部分,其对应的电阻率与健康部分相差普遍较大,能够根据ERT图像上电阻率的异常部分判断是否发生腐朽,即该部分的电阻率是否明显异于周围部分。这与我们从两者的曲线变化关系图中观察到的情况一致,也说明阻力损失和电阻率异常程度存在联系。
![]() 图 5 电阻率异常程度和阻力损失散点图Figure 5. Scatter-plot of abnormal extent of electrical resistivity and resistance loss
图 5 电阻率异常程度和阻力损失散点图Figure 5. Scatter-plot of abnormal extent of electrical resistivity and resistance loss回归曲线前半部分(V≤90%)呈现很平缓的上升。这段曲线的阻力损失都小于10 resi,对应着阻抗仪测试方向上有不连续而且腐朽程度较小的部分,其力学强度受腐朽的影响不大;而这些部分的电阻率均值与没有腐朽的部分相差从0到近100%,变化幅度非常明显。说明力学性能稍微下降的轻微腐朽部分的阻力损失都很小且彼此之间差别不大,此时阻力损失只能判断是否有轻度的腐朽发生;虽然轻微腐朽部分的力学性能相差很小,但影响其电阻率的某些微观因素(如离子浓度)却会发生很大变化[14],导致几乎相同的阻力损失值会对应相差很大的电阻率异常程度。所以此时电阻率异常程度和阻力损失间的正相关关系不明显,前者相比后者能更细致地反映轻微腐朽的程度,电阻率检测对轻微腐朽更加敏感。曲线的后半部分(V>90%)的斜率明显增大,呈现快速上升趋势。这段曲线的阻力损失明显变大,对应测试方向上有连续且腐朽程度较大的部分,其力学强度显著下降;这些部分的电阻率异常程度的变化不再明显,从100%到130%。说明当腐朽严重到力学性能发生大幅下降时,影响木材电阻率的因素的变化速度减慢,电阻率异常程度有小幅的增加,阻抗仪检测对较严重的腐朽更加敏感。这与相关研究所得到的电阻法对早期腐朽敏感,而阻抗仪法对严重腐朽的测量最为准确的结论相符[16]。
这一现象是因为两种检测方法的原理不同, 导致它们对腐朽的反应不同。活立木刚遭到腐朽菌感染后,其纤维素含量相对不变[17],腐朽菌会先消耗细胞内含物及细胞间隙物质,力学性能变化不大,所以曲线前部分的阻力损失值变化很小。随着腐朽持续进行,腐朽菌逐渐把细胞壁中的纤维素、半纤维素分解为糖类,使木材纤维结晶区的结晶度降低[18],这个过程由点到面逐渐进行,导致其力学性能发生较明显下降[19],这与曲线上斜率明显增大相对应。腐朽进行到后期时,细胞壁结构完全水解,木材组织遭到严重破坏,宏观结构发生变化, 如发生筛孔或轮裂等[20],所以曲线后部分的阻力损失很大。此外,裂纹和空洞缺陷也会使微钻阻力值陡然下降[21],在微钻阻力变化曲线上形成波谷, 其阻力损失大小由缺陷的尺寸决定。
相关研究表明木材电阻会在早期腐朽阶段大幅下降,因为在早期腐朽阶段,含水率虽然会上升但其并不是影响电阻率的主要因素,而作为主要因素的离子浓度会在木材腐朽菌作用下显著增加,导致其电阻率大幅下降[22]。所以曲线前部分的电阻率异常程度变化很大,表明此时腐朽使木材电阻率变化很快。而曲线的走势发生明显变化后,电阻率异常程度的变化程度比较小。此时腐朽部分的电阻率虽然比健康部分低很多,但是随着腐朽程度的增加其变化不再明显,说明木材电阻率在中后期腐朽时的变化则趋于平稳。这种现象与相关的腐朽对木材电阻影响的研究结果相符,其原因可能是木腐菌的分解作用会随着腐朽菌生长趋于平稳[14]。至于微钻阻力下降段的电阻率相对于健康部分增大的原因有两种:一是在腐朽非常严重的位置,树木组织失去功能,得不到水分供给,电阻率因水分减少而显著增大[15],此时电阻率异常程度和阻力损失值都很大;二是发生裂纹、空洞等缺陷部位的电阻率也会明显增大,这种情况下测得的电阻率其实近似为绝缘的空气电阻率,对应的电阻率异常程度都很大,而阻力损失的大小由缺陷的尺寸决定。
以微钻阻力变化曲线上有明显阻力下降的位置为腐朽的参考位置,用这些位置与健康部分的电阻率均值的差值定义了腐朽部分的电阻率异常程度。通过非线性回归发现阻力损失和电阻率异常程度呈正相关指数关系,且电阻率异常程度基本都大于10%,说明ERT图像上电阻率高于或低于周围区域的位置存在不同程度腐朽, ERT能够反映红松活立木二维截面上的腐朽情况。两者的回归曲线可以分为变化趋势相差很大的两部分,由此推断出ERT检测对于轻微腐朽更加敏感而阻抗仪检测对较严重的腐朽更加敏感。
2.3 联合ERT和阻抗仪的检测表征与质量损失率的关系
由于微钻阻力变化曲线上的波谷位置与ERT图像上电阻率极大值或极小值的位置相对应,电阻率异常程度与阻力损失存在较强的相关关系,因此可以认为ERT图像上电阻率的极值位置存在不同程度的腐朽或其他缺陷。然而ERT图像上电阻率是逐渐变化的,仅根据图像上电阻率大小所对应的颜色深浅只能对腐朽区域进行粗略定位。以图 4所示的6号样木的ERT图像为例,EF段及其周围的深红色高电阻率区域为电阻率呈极大值的腐朽区域,该区域的边界位置的黄色和浅黄色区域是否为腐朽却无法仅通过电阻率判断。此外,不同样木的生长阶段和立地条件总有差异,导致不同样木截面上影响电阻率的含水率、温度和密度等众多因素也有所差异。即使是在距地面同样高度的截面上,不同样木的腐朽位置测得的电阻率也不同。因此很难仅根据ERT图像界定腐朽电阻率的统一范围,无法根据腐朽区域的电阻率范围在ERT图像上明确确定腐朽的位置。
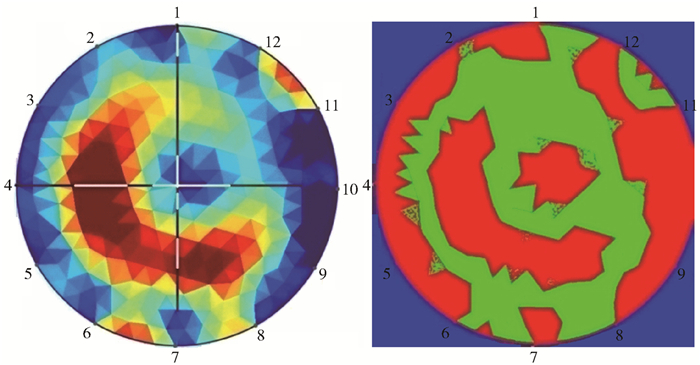
为了解决这个问题,考虑两种测量方法的优势,结合阻抗仪测得的微钻阻力变化曲线和ERT图像进行分析。在ERT图像上找出阻抗仪的测量方向及范围,用细的直条表示阻抗仪的测量方向和范围,微钻阻力值发生比较明显下降的位置的腐朽部分标记为白色,其他位置的健康区域标记为黑色,依据是阻抗仪能够在一维直线方向上准确地反应活立木的腐朽情况。然后运用监督分类的方法对ERT图像进行分析,以选出的腐朽部分为训练样区,区分腐朽部分与健康部分。监督分类法是以统计识别函数为理论基础,根据已知训练区提供的样本通过选择特征参数,求出特征参数作为决策规则,建立判别函数以对待分类影像进行的图像分类[23]。这样处理的依据是:ERT检测对轻微腐朽很敏感,即使是轻微的腐朽,其电阻率与健康部分相差较大,这些部分在ERT图像上与其他部分的颜色有较明显的差异,满足监督分类的要求。图 6为6号样木的ERT图像分析过程,左边为原ERT图像,其中白色直条为根据微钻阻力变化曲线标记的腐朽位置,黑色直条为健康位置,直条总长为阻抗仪测量长度;右图为经监督分类后图像,其中红色区域为处理后得到的腐朽区域,绿色为健康区域,蓝色为背景区域。用处理后的腐朽区域面积占总截面积的比例表示由这种方法得到的腐朽程度,具体公式为:
Pd=Pr1−Pb 式中: Pd为腐朽区域占截面的比例,%;Pr和Pb分别为红色所代表的腐朽区域和蓝色所代表的背景区域占整个图像的面积比,%。用这种方法对15棵样木的ERT图像进行分析,所得的腐朽面积占截面的比例见表 4。
表 4 ERT图像中腐朽面积占截面比例Table 4. Percentage of decay area in ERT image样木编号No. of sample tree 1 2 3 4 5 6 7 8 9 10 11 12 13 14 15 腐朽面积比例Percentage of decay area (Pd)/% 33.60 40.88 28.90 34.09 26.89 37.65 23.24 21.42 42.53 19.59 55.21 65.25 22.38 43.81 75.37 以质量损失率为自变量,上述方法得到的腐朽面积占截面的比例Pd为因变量,对两者进行线性回归分析,结果如图 7所示。回归方程Pd=0.917L-8.616(R2=0.787,P<0.01)的拟合程度很高,说明木芯的质量损失率越大,结合两种检测方法得到的腐朽面积越大,两者呈显著正相关关系。这一现象是由于ERT图像上监督分类的结果是用阻抗仪的微钻阻力变化曲线定位得到的,红色区域实质上是一维直线上力学性能下降的区域在二维截面上的扩展,扩展的依据是前文讨论的腐朽部分的阻力损失与电阻率异常程度之间存在相关关系,微钻阻力下降段的腐朽位置电阻率与其他健康位置的电阻率相差较大。而质量损失率作为本文中腐朽程度的参考值,已经证明它与阻力损失有线性正相关关系,会随力学性能下降而减小。因为计算得到的腐朽面积比例Pd和质量损失率L都与力学强度下降有密切关系,所以两者表现出较好的线性相关关系。这种现象也印证了腐朽会使木材的力学和电学性能都发生变化,这种联合阻抗仪和ERT图像表征腐朽程度的方法具有可行性。
![]() 图 7 质量损失率和ERT图像中腐朽面积比例散点图Figure 7. Scatter-plot of mass loss rate and percentage of decay area in ERT image
图 7 质量损失率和ERT图像中腐朽面积比例散点图Figure 7. Scatter-plot of mass loss rate and percentage of decay area in ERT image对比阻力损失与质量损失率的回归方程,此方法得到的腐朽程度与质量损失率的相关系数更大,拟合程度提高。说明与一维方向上的微钻阻力变化曲线相比,结合微钻阻力变化曲线对ERT图像分析后得到的二维截面图像,能更加全面地反映活立木内部的腐朽情况。而且此方法能明确地表示出红松活立木截面上的腐朽区域,充分利用了阻抗仪检测在一维方向上的准确性以及电阻率对轻微腐朽敏感的特点,克服了仅根据ERT图像难以明确确定腐朽区域的困难。
3. 结论
对ERT图像和阻抗仪两种无损检测方法进行了比较和评价,结合两种方法的优势,并利用监督分类的图像分析法对活立木树干内部腐朽进行了检测和定量表征,结果表明:
1) 根据微钻阻力下降的程度定义阻力损失,木芯的质量损失率与平均的阻力损失呈较显著的正相关关系,阻抗仪能够准确测量红松活立木一维直线方向上的腐朽情况。
2) 微钻阻力下降区域的电阻率与其他区域相差很大,以这些区域为腐朽区域,用腐朽区域和健康区域的电阻率值定义电阻率异常程度。阻力损失值和对应区域的电阻率异常程度存在显著指数关系,说明了ERT能够检测木材二维截面上的腐朽情况。但是仅从ERT图像不能明确得到腐朽的区域,只能根据电阻率过高或过低大致判断腐朽部位。由上述指数函数关系还得到ERT检测对于轻度腐朽更加敏感,而阻抗仪检测对较严重的腐朽更加敏感。
3) 结合阻抗仪和ERT图像检测各自的优点,根据微钻阻力变化曲线上阻力下降的位置,在ERT图像对应的一维方向上确定腐朽位置,运用监督分类的图像分析手段在红松活立木二维截面上明确确定腐朽区域,腐朽面积占截面比例与质量损失率呈显著正相关关系,证明了这种联合阻抗仪和ERT定量表征红松活立木腐朽的方法有相当的可行性。
-
![]()
图 2 电阻率和微钻阻力随探头钻入深度的变化
H1和H2分别为波谷的左右两边在右侧微钻阻力坐标轴上的投影长度(resi);D1为波谷在横坐标上的投影长度(mm)。
Figure 2. Electrical resistivity and micro-drilling resistance varying with drilling depth
H1 and H2 are projection lengths (resi) of left and right sides of the trough on the vertical axis of mocro-drilling resistance curve, respectively; D1 is projection length (mm) of the trough on the horizontal axis.
![]()
图 3 质量损失率与平均阻力损失散点图
Figure 3. Scatter-plot of mass loss rate and average of resistance loss
![]()
图 5 电阻率异常程度和阻力损失散点图
Figure 5. Scatter-plot of abnormal extent of electrical resistivity and resistance loss
![]()
图 7 质量损失率和ERT图像中腐朽面积比例散点图
Figure 7. Scatter-plot of mass loss rate and percentage of decay area in ERT image
表 1 样木的基本情况
Table 1 Profile of 15 sample trees to be measured
样木编号
No. of sample tree胸径
DBH/mm树高
Height of tree/m含水率
Moisture content/%1 411 22.8 40.88 2 796 31.4 38.44 3 618 29.7 50.46 4 600 27.9 69.92 5 713 30.8 46.97 6 487 27.7 41.50 7 461 25.6 53.67 8 359 21.7 54.42 9 439 24.9 34.33 10 640 30.3 49.17 11 563 27.5 32.01 12 583 28.4 34.13 13 537 26.8 56.97 14 665 29.2 35.39 15 468 26.1 53.90  下载: 导出CSV
表 2 质量损失率与平均阻力损失
Table 2 Mass loss rate and average of resistance loss
样木编号
No. of sample tree平均阻力损失
Average of resistance loss/resi质量损失率
Mass loss rate/%1 19.00 32.48 2 21.51 46.24 3 7.24 19.80 4 5.04 36.12 5 2.15 10.46 6 22.55 35.37 7 4.45 24.63 8 4.64 19.33 9 26.00 40.04 10 6.37 7.81 11 32.18 51.15 12 19.64 43.47 13 4.22 23.95 14 15.44 29.45 15 26.74 68.92
下载: 导出CSV
表 3 阻力损失及对应的电阻率异常程度
Table 3 Resistance loss and corresponding abnormal extent of electrical resistivity
样木编号
No. of sample tree方向
Direction波谷个数
Number of troughs左端圆心距
Center distance of left end (d1)/mm右端圆心距
Center distance of right end (d2)/mm阻力损失
Resistance loss/resi电阻率异常程度
Abnormal extent of electrical resistivity/%1 东西向East-west 3 78.0 31.5 9.14 103.83 31.5 -44.0 8.50 43.73 -62.5 -77.0 1.37 39.63 2 南北向North-south 2 266.5 -43.5 27.36 116.56 257.0 185.5 6.68 57.53 东西向East-west 2 185.5 167.0 1.02 42.73 142.0 -23.0 7.94 77.21 3 东西向East-west 2 299.0 250.0 4.76 9.72 167.0 132.0 2.48 52.31 4 东西向East-west 1 160.0 119.0 5.04 96.23 5 南北向North-south 2 -10.5 -30.5 1.49 29.56 -30.5 -55.5 1.66 23.60 东西向East-west 1 314.0 284.5 1.14 5.17 6 南北向North-south 4 107.5 58.5 5.08 33.98 51.0 13.5 5.58 14.15 13.5 0.5 1.22 17.42 -21.5 -81.5 6.48 21.20 东西向East-west 2 156.5 71.0 7.17 42.33 39.5 -83.5 19.56 121.21 7 南北向North-south 2 -52.0 -72.5 2.75 8.12 -77.5 -92.5 1.37 19.72 东西向East-west 2 8.0 -19.5 3.00 42.00 -108.5 -125.5 1.77 61.47 8 南北向North-south 1 127.0 106.5 4.64 0.75 9 南北向North-south 2 29.5 -28.0 10.81 111.24 -28.0 -155.5 20.69 127.96 东西向East-west 4 113.5 54.5 7.73 90.79 44.5 -8.0 3.80 63.61 -8.0 -74.5 7.83 38.58 -116.0 -128.5 1.14 4.37 10 南北向North-south 2 25.0 -23.0 3.15 62.00 -34.0 -76.0 3.94 75.07 东西向East-west 1 194.0 106.0 5.64 64.32 11 南北向North-south 1 64.5 -154.5 34.62 129.35 东西向East-west 3 160.5 141.5 1.51 21.56 141.5 98.5 3.40 10.99 98.5 -134.5 24.83 111.51 12 南北向North-south 2 216.5 151.5 6.83 6.83 96.5 -33.5 4.46 4.46 东西向East-west 1 136.5 -103.5 27.99 112.42 13 南北向North-south 1 -121.5 -152.0 3.41 43.99 东西向East-west 1 -121.5 -166.5 5.03 91.07 14 南北向North-south 4 238.5 170.5 6.01 23.65 170.5 155.5 0.79 53.95 140.5 106.5 2.75 36.76 106.5 22.5 4.89 26.78 东西向East-west 2 161.5 5.0 13.06 109.34 -15.5 -71.5 3.37 3.49 15 南北向North-south 1 188.0 -167.0 32.03 114.87 东西向East-west 2 185.0 140.0 5.12 40.39 140.0 -56.0 16.33 120.13
下载: 导出CSV
表 4 ERT图像中腐朽面积占截面比例
Table 4 Percentage of decay area in ERT image
样木编号No. of sample tree 1 2 3 4 5 6 7 8 9 10 11 12 13 14 15 腐朽面积比例Percentage of decay area (Pd)/% 33.60 40.88 28.90 34.09 26.89 37.65 23.24 21.42 42.53 19.59 55.21 65.25 22.38 43.81 75.37
下载: 导出CSV
-
[1] 魏旸艳, 陆文明, 郎书平.中国木材进口影响因素分析[J].世界林业研究, 2009, 22(2): 78-80. http://www.sjlyyj.com/ch/reader/view_abstract.aspx?file_no=20090216&flag=1 WEI Y Y, LU W M, LANG S P. An analysis of main influencing factors for timber import of China[J]. World Forestry Research, 2009, 22(2): 78-80. http://www.sjlyyj.com/ch/reader/view_abstract.aspx?file_no=20090216&flag=1
[2] 王立海, 杨学春, 徐凯宏.木材无损检测技术的研究现状与进展[J].森林工程, 2001, 17(6): 1-3. doi: 10.3969/j.issn.1001-005X.2001.06.001 WANG L H, YANG X C, XU K H. The research situations and development of non-destructive testing for wood properties[J]. Forest Engineering, 2001, 17(6): 1-3. doi: 10.3969/j.issn.1001-005X.2001.06.001
[3] BRIANK B, VOICHITA B, FERENC D, et al. Nondestructive testing and evaluation of wood: a worldwide research update[J]. Forest Products Journal, 2009, 59(3): 7-14.
[4] DIVOS F. Stress wave based tomography for trees evaluation[C]//Proceedings of the 12th International Symposium on Nondestructive Testing of Wood. 2000: 13-15.
[5] WANG X, ALLISON R B. Decay detection in red oak trees using a combination of visual inspection, acoustic testing, and resistance microdrilling[J]. Arboriculture & Urban Forestry, 2008, 34(1): 1-4. http://www.wanfangdata.com.cn/details/detail.do?_type=perio&id=b23f4a37293271e9180ada36d3e65048
[6] 孙天用, 王立海.基于应力波与X射线二维CT图像原木内部腐朽无损检测[J].森林工程, 2011, 27(6): 26-29. doi: 10.3969/j.issn.1001-005X.2011.06.006 SUN T Y, WANG L H. Non-destructive testing of log internal decay based on two-dimensional CT images of stress wave and X-ray testing[J]. Forest Engineering, 2011, 27(6): 26-29. doi: 10.3969/j.issn.1001-005X.2011.06.006
[7] 葛晓雯, 王立海, 孙天用, 等.基于应力波和阻抗仪技术的旱柳内部腐朽定量检测[J].林业科技开发, 2014, 28(5): 87-91. http://d.old.wanfangdata.com.cn/Periodical/lykjkf201405023 GE X W, WANG L H, SUN T Y, et al. Quantitative detection of Salix matsudana inner decay based on stress wave and resistograph techniques[J]. China Forestry Science and Technology, 2014, 28(5): 87-91. http://d.old.wanfangdata.com.cn/Periodical/lykjkf201405023
[8] 安源, 殷亚方, 姜笑梅, 等.应力波和阻抗仪技术勘查木结构立柱腐朽分布[J].建筑材料学报, 2008, 11(4): 457-463. doi: 10.3969/j.issn.1007-9629.2008.04.015 AN Y, YIN Y F, JIANG X M, et al. Inspection of decay distribution in wood column by stress wave and resistograph techniques[J]. Journal of Building Materials, 2008, 11(4): 457-463. doi: 10.3969/j.issn.1007-9629.2008.04.015
[9] 鲍震宇, 王立海.电阻测试法在立木腐朽检测中的应用研究进展[J].森林工程, 2013, 29(6): 47-51. doi: 10.3969/j.issn.1001-005X.2013.06.012 BAO Z Y, WANG L H. Application of electrical resistance testing method in detection of decay in standing trees[J]. Forest Engineering, 2013, 29(6): 47-51. doi: 10.3969/j.issn.1001-005X.2013.06.012
[10] 孙天用, 王立海, 孙墨珑.小兴安岭红松活立木树干腐朽与立地土壤理化特性的关系[J].应用生态学报, 2013, 24(7): 1837-1842. http://d.old.wanfangdata.com.cn/Periodical/yystxb201307008 SUN T Y, WANG L H, SUN M L. Correlations between standing trees trunk decay degree and soil physical-chemical properties in Korean pine-broadleaved mixed forest in Xiao Xing'an Mountains of northeast China[J]. Chinese Journal of Applied Ecology, 2013, 24(7): 1837-1842. http://d.old.wanfangdata.com.cn/Periodical/yystxb201307008
[11] 李坚.木材科学研究[M].北京:科学出版社, 2009. LI J. Wood science research[M]. Beijing: Science Press, 2009.
[12] 杨忠, 江泽慧, 任海青, 等.木材加速腐朽试验方法的研究[J].木材工业, 2007, 21(4): 12-14. doi: 10.3969/j.issn.1001-8654.2007.04.004 YANG Z, JIANG Z H, REN H Q, et al. An accelerated laboratory test method to assess wood decay[J]. China Wood Industry, 2007, 21(4): 12-14. doi: 10.3969/j.issn.1001-8654.2007.04.004
[13] 陶新民, 曲艺卓, 温少阳.基于电阻断层成像技术的立木探伤检测系统[J].应用科技, 2017, 44: 1-7. http://d.old.wanfangdata.com.cn/Periodical/yykj201704008 TAO X M, QU Y Z, WEN S Y. Tree flaw detection system based on electrical resistivity tomography[J]. Applied Science and Technology, 2017, 44: 1-7. http://d.old.wanfangdata.com.cn/Periodical/yykj201704008
[14] 鲍震宇.腐朽对木材电阻的影响研究[D].哈尔滨: 东北林业大学, 2015. http://cdmd.cnki.com.cn/Article/CDMD-10225-1015665582.htm BAO Z Y. The effect of decay on wood electrical resistance[D]. Harbin: Northeast Forestry University, 2015. http://cdmd.cnki.com.cn/Article/CDMD-10225-1015665582.htm
[15] GUYOT A, OSTERGAARD K T, LENKOPANE M, et al. Using electrical resistivity tomography to differentiate sapwood from heartwood: application to conifers[J]. Tree Physiology, 2013, 33(2): 187-194. doi: 10.1093/treephys/tps128
[16] 岳小泉, 王立海, 王兴龙, 等.电阻断层成像、应力波及阻抗仪3种无损检测方法对活立木腐朽程度的定量检测[J].林业科学, 2017, 53(3): 138-146. http://d.old.wanfangdata.com.cn/Periodical/lykx201703015 YUE X Q, WANG L H, WANG X L, et al. Quantitative detection of internal decay degree for standing trees based on three NDT methods—electric resistance tomography, stress wave imaging and resistograph techniques[J]. Scientia Silvae Sinicae, 2017, 53(3): 138-146. http://d.old.wanfangdata.com.cn/Periodical/lykx201703015
[17] SCHWARZE F W M R. Wood decay under the microscope[J]. Fungal Biology Reviews, 2007, 21(4): 133-170. doi: 10.1016/j.fbr.2007.09.001
[18] 张新玲, 王立海, 高珊.小兴安岭4树种健康材和腐朽材结晶度的试验[J].东北林业大学学报, 2010, 38(7): 83-84. doi: 10.3969/j.issn.1000-5382.2010.07.026 ZHANG X L, WANG L H, GAO X. Crystallinity of healthy and rotten wood of several tree species in Xiao Xing'an Mountain[J]. Journal of Northeast Forestry University, 2010, 38(7): 83-84. doi: 10.3969/j.issn.1000-5382.2010.07.026
[19] WILCOX W W. Review of literature on the effects of early stages of decay on wood strength[J]. Wood & Fiber, 1978, 9(4): 252-257.
[20] 尹思慈.木材学[M].北京:中国林业出版社, 1996. YIN S C. Wood science[M]. Beijing: China Forestry Publishing House, 1996.
[21] 张富文, 许清风, 张治宇, 等.钻入阻抗法检测木材缺陷[J].无损检测, 2016, 38(1): 6-9. http://www.wanfangdata.com.cn/details/detail.do?_type=perio&id=wsjc201601003 ZHANG F W, XU Q F, ZHANG Z Y, et al. Wood defect inspection by drilling resistance method[J]. Nondestructive Testing, 2016, 38(1): 6-9. http://www.wanfangdata.com.cn/details/detail.do?_type=perio&id=wsjc201601003
[22] TATTAR T A, SHIGO A L, CHASE T. Relationship between the degree of resistance to a pulsed electric current and wood in progressive stages of discoloration and decay in living trees[J]. Canadian Journal of Forest Research, 1972, 2(3): 236-243. doi: 10.1139/x72-039
[23] 蒋艳凰.遥感图像高精度并行监督分类技术研究[D].北京: 国防科学技术大学, 2004. http://cdmd.cnki.com.cn/Article/CDMD-90002-2005014429.htm JIANG Y H. High-accuracy and parallel algorithms for supervised remote-sensing image classification[D]. Beijing: National University of Defense Technology, 2004. http://cdmd.cnki.com.cn/Article/CDMD-90002-2005014429.htm
-
期刊类型引用(12)
1. 吴生海,王玉莹,檀婷婷,李黎明,兰雪涵,杜凤国. 针刺仪在林木检测中的应用现状及展望. 吉林林业科技. 2023(02): 36-40 .  百度学术
百度学术
2. 柳苏洋,辛振波,张厚江,王辉,张典. 基于红外热成像的古建筑望板腐朽状况无损检测研究. 北京林业大学学报. 2023(07): 139-152 . 本站查看
3. 徐鹏飞,管成,张厚江,宋海欧,袁江玉,段超,郭旺. 用于树干内部缺陷筛查的应力波临界波速确定研究. 西北林学院学报. 2022(01): 222-229 . 百度学术
4. 谢军明,王立海,林文树,郝泉龄,解光强,孟庆凯,李怡娜,阚相成. 随机森林在红松活立木腐朽分级中的应用. 东北林业大学学报. 2022(04): 99-103+110 . 百度学术
5. 梁星宇,丁叶蔚,何宇航,黄俣劼,王正. 电学无损检测法在活立木中的应用与展望. 木工机床. 2022(02): 12-15 . 百度学术
6. 杨露露,董喜斌,徐华东. 电阻法和应力波法在活立木内部腐朽缺陷检测中的对比. 森林工程. 2022(04): 82-88 . 百度学术
7. 常旭东,金光泽. 地形和土壤因子对红松活立木腐朽的影响. 林业科学. 2022(11): 71-82 . 百度学术
8. 刘唱. 基于反距离加权插值法的木材内部缺陷检测. 电子制作. 2021(03): 60-63 . 百度学术
9. 郝泉龄,徐国祺,王立海,时小龙,许明贤,纪文文,张广晖. 基于Logistic回归模型的红松立木腐朽分级预测. 南京林业大学学报(自然科学版). 2020(02): 150-158 . 百度学术
10. 徐群,徐华东,李其哲,程智星. 基于阻抗仪的红松活立木年轮宽度辨识方法. 森林工程. 2019(03): 32-35+40 . 百度学术
11. 王明谦,王昆,许清风. 木结构无损检测技术研究进展. 施工技术. 2019(21): 85-90 . 百度学术
12. 金川,申晓刚,陆萍. 扬州瘦西湖景区古树健康监测与评价. 扬州职业大学学报. 2018(02): 47-51 . 百度学术
其他类型引用(7)


计量
- 文章访问数: 3640
- HTML全文浏览量: 463
- PDF下载量: 30
- 被引次数: 19
