
Nondestructive testing of the decay condition of ancient building roof boarding based on infrared thermal imaging
-
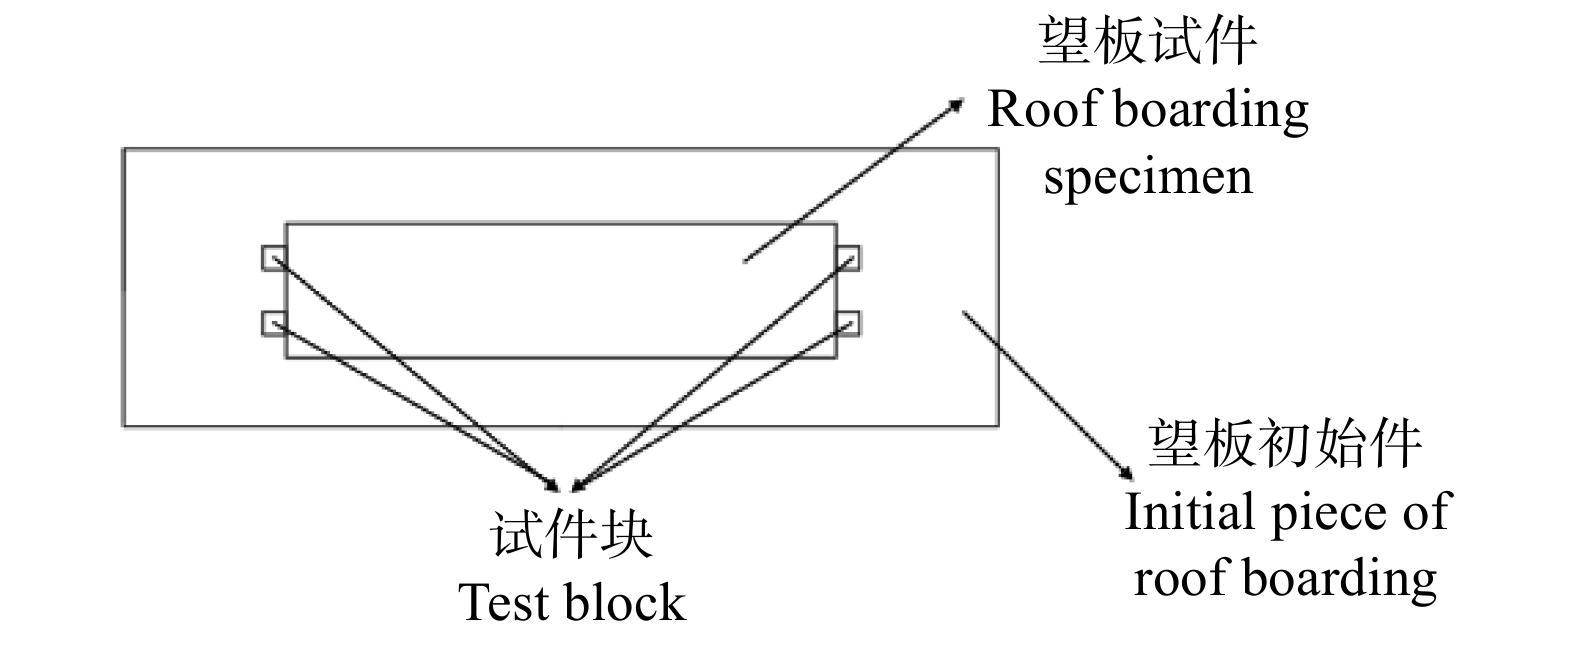
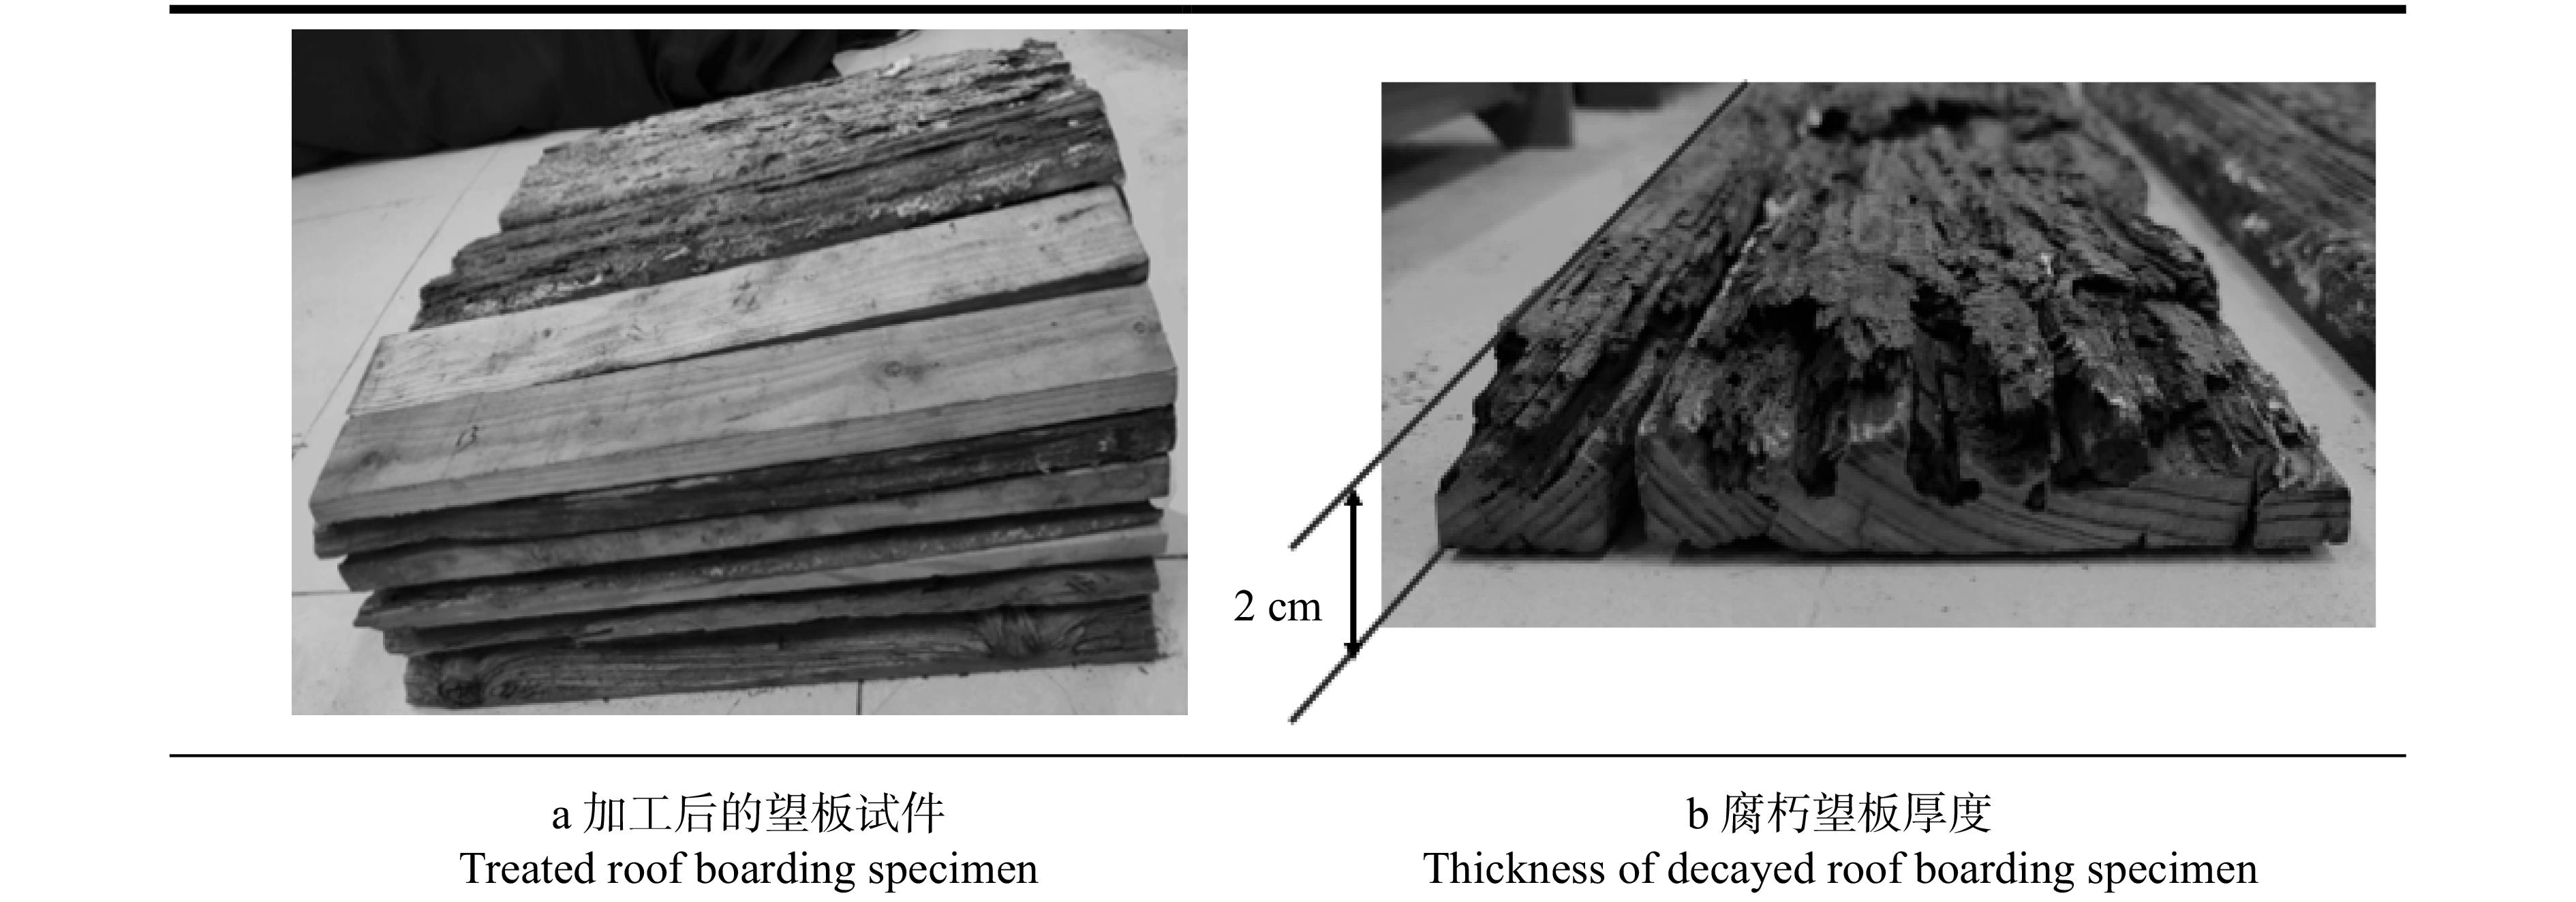
摘要:目的 望板是木结构古建筑屋顶的重要组成部分,由于屋顶漏雨、渗水等原因,望板与苫背接触的隐藏区域易发生腐朽损坏。本研究基于红外热成像原理开展腐朽望板检测理论和实验研究,以期为基于红外热成像的古建筑望板腐朽状况无损检测和评估技术的形成奠定前期基础。方法 首先,分析古建筑望板的传热过程,推导腐朽区和非腐朽区望板内表面平均温差的计算公式;然后,选取4种腐朽等级的望板试件,制作实验装置,通过参考法用红外热像仪测定了试件发射率,并进行4种腐朽等级望板试件内表面温度变化的检测实验。结果 理论研究结果表明:在得知望板的木材密度、比热容的基础上,可计算出红外检测望板腐朽状况的最佳检测时间。试验结果表明:同一时刻,望板腐朽等级越高,其内表面温度越高,红外图像颜色越深;腐朽望板与正常望板内表面间的温差随着加热的开始会逐渐变大,但达到一定程度后,温差会随加热时间进一步增长而变小。试验测得的腐朽望板红外最佳检测时间与理论计算得到的最佳检测时间有良好的一致性。望板腐朽最佳检测时间不受望板两侧温差、环境温度等影响,一般为20 ~ 30 min。望板两侧温差越大,腐朽望板与正常望板内表面间的温差越大,红外检测效果越好。结论 理论和实验结果均表明,基于红外热成像对古建筑望板腐朽状况进行无损检测是可行的。Abstract:Objective The roof boarding is an important part of the roof of ancient wooden structure building. Due to rain leakage, water seepage and other reasons, the hidden area where the roof boarding contacts the back of the tarpaulin is prone to decay and damage. Based on the principle of infrared thermal imaging, this paper carries out theoretical and experimental research on decayed roof boarding detection, which lays a preliminary foundation for the formation of nondestructive detection and evaluation technology for decayed ancient building roof boarding based on infrared thermal imaging.Method Firstly, the heat transfer process of ancient building roof boarding was analyzed, and the calculation formula of average temperature difference between the internal surfaces of roof boarding in decayed area and non-decayed area was deduced; then, four kinds of decay grade of roof boarding specimens were selected, experimental devices were made, the reference method was used to measure the emissivity of specimens with infrared thermal image, and the detection experiment of the temperature change of internal surface of four decay grade roof boarding specimens was conducted.Result The theoretical research results showed that the best detection time of infrared detection of roof boarding decay condition could be calculated based on the knowledge of wood density and specific heat capacity. The experimental results showed that at the same time, the higher the decay level of the roof boarding was, the higher the temperature of its internal surface was and the darker the color of the infrared image was; the internal surface temperature difference between the decayed roof boarding and the normal roof boarding will gradually increase with the start of heating. But it will decrease with the further increase of heating time after reaching a certain extent. The best infrared detection time of measured decay roof boarding in the experiment was in good agreement with the best detection time calculated theoretically. The best detection time for the decay roof boarding was not affected by the temperature difference between the two sides of roof boarding and the ambient temperature, which was generally 20−30 min. The greater the temperature difference between the two sides of the roof boarding was, the greater the temperature difference between the internal surfaces of the decayed roof boarding and the normal roof boarding was, and the better the infrared detection effect was.Conclusion The theoretical and experimental results show that it is feasible to detect the decay condition of ancient building roof boarding based on infrared thermal imaging.
-
Keywords:
- ancient building /
- roof boarding /
- decay /
- infrared thermography /
- nondestructive testing
-
随着全球气候的变化,干旱日益成为农林领域最为关注的问题之一。植物在生长过程中,生理会产生一定的响应[1−2],干旱环境可对植物生产造成显著影响,直接导致植物产量下降,限制农林产业的发展,同时也对生态环境带来一定的破环。干旱问题越来越受到人们的重视,加快干旱地区造林是解决干旱地区环境问题的有效途径之一,研究植物的抗旱机理和选育抗旱品种也是国内外专家一直研究的热点和方向。由此,在淡水资源匮乏、水土流失严重和干旱面积增加的情况下,对重要造林树种进行抗旱性综合评价,研究植物的抗旱机理,了解干旱胁迫下植物的响应和适应机制,选育优良的抗旱品种,对于改善干旱贫瘠地区的生态环境具有重要意义。
干旱胁迫会使植物的外部形态和生理生化特性发生改变,在生长指标方面,干旱环境会影响植物的根以及叶片的生长发育。光合作用是植物重要的生理过程,干旱胁迫会通过影响叶绿素的合成,进而影响光合作用。干旱还会导致植物细胞的结构和功能发生改变,细胞膜透性增加,细胞内物质大量外流,相对电导率上升,丙二醛(malondialdehyde,MDA)含量增加,同时会导致植物抗氧化酶活性和渗透调节物质发生相应变化[3−4]。
杨属(Populus)树种速生性强、繁殖速度快,其中黑杨派(Sect. Aigeiros)的美洲黑杨(P. deltoides)及其杂交种欧美杨(P. × euramericana)是优良的防护林和用材林树种,在我国林业建设中具有重要地位[5]。杨树在涵养水源、水土保持等方面发挥着不可替代的作用。发展杨树人工林是缓解全球森林资源短缺、满足社会发展需要以及促进经济发展的一项重大举措。目前,关于干旱胁迫对杨树的研究已有许多报道,大多集中在生长性状[6−7]、光合性状[8]和生理生化[9]研究等方面,但缺乏对黑杨派无性系抗旱性各项指标的综合评价。本试验利用盆栽试验方法,对10个黑杨派无性系进行干旱胁迫,研究在持续控水处理下,不同黑杨派无性系的生长及生理生化特性的变化规律,对10个无性系的抗旱性进行综合评价,筛选出抗旱能力强的无性系,以期为黑杨派无性系在干旱立地的推广应用提供依据。
1. 材料与方法
1.1 试验材料
本试验以10个黑杨派无性系为试验材料(表1),包括山东省林业科学研究院根据3年生试验林的表型性状初选的8个优良无性系,以及2个目前推广的无性系I-107和中林2025,其中I-107和中林2025作为对照。试验材料来自山东省单县国有高韦庄苗圃。
表 1 试验材料Table 1. Experimental materials无性系 Clone 拉丁学名 Latin name 母本 Female parent 父本 Male parent 1627 Populus × euramericana ‘1627’ 美洲黑杨 P. deltoides 欧洲黑杨 P. nigra 1640 P. × euramericana ‘1640’ 美洲黑杨 P. deltoides 欧洲黑杨 P. nigra 1641 P. × euramericana ‘1641’ 美洲黑杨 P. deltoides 欧洲黑杨 P. nigra 1716 P. deltoides ‘1716’ 美洲黑杨 P. deltoides 美洲黑杨 P. deltoides 1722 P. deltoides ‘1722’ 美洲黑杨 P. deltoides 美洲黑杨 P. deltoides 1723 P. deltoides ‘1723’ 美洲黑杨 P. deltoides 美洲黑杨 P. deltoides 1725 P. deltoides ‘1725’ 美洲黑杨 P. deltoides 美洲黑杨 P. deltoides 1733 P. × euramericana ‘1733’ 美洲黑杨 P. deltoides 欧洲黑杨 P. nigra I-107 P. × euramericana ‘Neva’ 美洲黑杨 P. deltoides 欧洲黑杨 P. nigra 2025 P. deltoides ‘2025’ 美洲黑杨 P. deltoides 美洲黑杨 P. deltoides 1.2 试验设计
试验在山东省林业科学研究院试验苗圃内的干旱棚中进行,采用盆栽试验方法。2021年4月中旬将各供试无性系硬枝插穗扦插于规格为350 mm × 280 mm的花盆中,每盆扦插1个插穗,每个无性系20盆。盆栽基质由苗圃熟土、草炭土、细沙按7∶2∶1的体积比例混合而成。扦插时以插穗最上面的芽刚露出土壤基质表面为宜,对试验苗木常规管理至测试时间。8月下旬每个无性系选择12株生长状况相近的苗木参加干旱试验。试验设计4个水分处理,3次重复,每盆苗木为1个重复。该试验通过人工供水后自然耗水的方法模拟干旱胁迫,预实验发现分别在自然耗水的第0、5、10、15天后,可以得到4组水分梯度:正常供水(土壤相对含水量(RWC)为80%以上)、轻度干旱(RWC为50% ~ 70%)、中度干旱(RWC为30% ~ 50%)、重度干旱(RWC为30%以下)[10]。试验前对盆栽苗木充分浇水,使土壤含水量达到饱和状态,然后通过持续控水的方法,逐渐降低土壤含水量达到水分胁迫梯度。取样时每个无性系每次选取3盆长势均一的植株,剪取从顶端数第4 ~ 6片的功能叶用于测定各项生理生化指标,取过叶片的植株下次不再取样,同时测定实时土壤含水量。
1.3 指标及其测定方法
1.3.1 生长指标的测定
生长指标包括苗高、地径、生物量等,用于研究干旱胁迫对黑杨派各无性系植株生长状况的影响。在试验开始前和结束后分别测定所有参试无性系的苗高和地径,无性系苗高(cm)用刻度尺测量,地径(mm)使用游标卡尺测量,胁迫后减去胁迫前的生长量即为胁迫期间的苗高和地径增长量。
每个无性系各定植20盆,选择12盆长势较为一致的参加试验,试验开始时,根据参试无性系的苗高均值,从剩余的8盆植株中选择3株与苗高均值相近的完整植株,用蒸馏水清洗表面杂物,将植株的根、茎、叶分开并用吸水纸迅速吸干,放入烘箱于105 ℃杀青,在75 ℃下烘至质量恒定,测定其生物量,取其均值为生物量1。试验结束时,每个无性系从参试的12盆植株中选择3株长势较为一致的完整植株,用蒸馏水清洗表面杂物,将植株的根、茎、叶分开后用吸水纸迅速吸干,放入烘箱于105 ℃杀青,并在75 ℃下烘至质量恒定,测定其生物量,记为生物量2,生物量增量则为生物量2与生物量1的差值。
1.3.2 生理生化指标的测定
采用乙醇提取比色法测定叶绿素含量,采用相对电导率法测定细胞膜透性,采用硫代巴比妥酸法测定丙二醛含量,采用氮蓝四唑光还原法测定超氧化物歧化酶(superoxide dismutase,SOD)活性,采用愈创木酚法测定过氧化物酶(peroxidase,POD)活性,采用茚三酮染色法测定游离脯氨酸含量[11]。
1.4 数据分析
运用Excel 2010软件对试验数据进行统计整理和图表绘制。用SPSS 22.0软件进行多重比较(Duncan’s新复极差法)、相关分析和主成分分析。
2. 结果与分析
2.1 干旱胁迫对黑杨派无性系生长指标的影响
在重度干旱胁迫下,10个供试无性系的各项生长指标见表2。苗高增量最大的无性系是1733、I-107,最小的是1722、2025;地径增量最大的无性系是1733、1627,最小的是1722、1640;生物量增量最大的无性系是1733、1627,最小的是2025、1722。无性系1733和1627的3个生长指标与对照2025的差异均达到显著水平,说明其具有较强的抗旱性。
表 2 土壤重度干旱对黑杨派无性系生长指标的影响Table 2. Effects of soil severe drought on differentgrowth of clones无性系
Clone苗高增量
Ramet height
increment/cm地径增量
Basal diameter
increment/mm生物量增量
Biomass
increment/g1641 16.3 ± 0.6ab 0.75 ± 0.13bc 5.67 ± 0.68abc 1733 19.6 ± 2.3a 1.02 ± 0.08a 7.04 ± 0.40a 1627 16.3 ± 0.7ab 0.89 ± 0.08ab 6.58 ± 0.43ab 2025 12.1 ± 0.9cd 0.63 ± 0.06c 4.38 ± 0.57c 1725 15.4 ± 1.4bc 0.73 ± 0.08bc 4.85 ± 1.07bc 1716 13.5 ± 1.0bcd 0.66 ± 0.07bc 5.56 ± 0.47abc 1722 10.1 ± 1.0d 0.58 ± 0.02c 4.78 ± 0.20bc I-107 16.6 ± 1.4ab 0.82 ± 0.09abc 6.28 ± 0.40abc 1723 14.9 ± 1.3bc 0.72 ± 0.05bc 5.01 ± 0.58bc 1640 15.0 ± 0.6bc 0.61 ± 0.07c 4.94 ± 0.60bc 注:同列中不同小写字母表示差异显著(P < 0.05)。下同。Notes: different lowercase letters in the same column indicate significant differences (P < 0.05). The same below. 2.2 干旱胁迫对黑杨派无性系叶绿素含量的影响
植物的叶绿素含量随着干旱胁迫的加剧而下降,不同植物在干旱胁迫下叶绿素含量出现不同程度的降低。从表3可以看出:无性系1716的叶片叶绿素含量随干旱程度加剧一直处于下降趋势,其余各无性系的叶绿素含量随干旱胁迫加剧表现出先上升后下降的规律,均在轻度干旱时叶片的叶绿素含量有所增加。随自然耗水时间的增加,土壤干旱胁迫加剧,叶绿素含量下降,在中度干旱和重度干旱处理下,所有无性系叶片的叶绿素含量均小于正常供水时。在重度干旱时,叶绿素含量较高的无性系为I-107和1627,显著高于对照2025。
表 3 土壤干旱对各无性系叶绿素含量的影响Table 3. Effects of soil drought on chlorophyll content of each clone无性系
Clone叶绿素含量 Chlorophyll content/(mg·g−1) 正常供水
Normal water
supply轻度干旱
Mild
drought中度干旱
Moderate
drought重度干旱
Severe
drought1641 2.50 ± 0.09a 3.71 ± 0.29a 1.84 ± 0.14abc 1.47 ± 0.08bcd 1733 2.32 ± 0.24abc 3.53 ± 0.14a 2.09 ± 0.14a 1.52 ± 0.12abc 1627 2.62 ± 0.07a 3.72 ± 0.25a 2.04 ± 0.11ab 1.68 ± 0.08ab 2025 1.83 ± 0.04d 2.02 ± 0.16e 1.41 ± 0.07e 1.29 ± 0.04cd 1725 2.04 ± 0.09bcd 2.85 ± 0.25bcd 1.73 ± 0.08bcd 1.41 ± 0.03cd 1716 2.42 ± 0.07ab 2.24 ± 0.11de 1.46 ± 0.06de 1.24 ± 0.05d 1722 2.44 ± 0.12ab 2.74 ± 0.22cd 1.45 ± 0.09de 1.22 ± 0.06d I-107 2.23 ± 0.20abcd 3.42 ± 0.22ab 1.93 ± 0.13ab 1.76 ± 0.14a 1723 1.99 ± 0.11cd 2.41 ± 0.16de 1.74 ± 0.04bcd 1.32 ± 0.07cd 1640 2.04 ± 0.13bcd 3.36 ± 0.23abc 1.55 ± 0.07cde 1.30 ± 0.07cd 2.3 干旱胁迫对黑杨派无性系细胞膜透性的影响
由表4可知,各供试无性系在不同干旱处理条件下,细胞膜透性变化差别明显。随着干旱胁迫的加剧,10个无性系的细胞膜透性呈明显的升高趋势,且在重度干旱时达到最大值。其中无性系1716和1722升高最明显,与正常供水时相比均升高117.0%以上,增幅最小的是无性系1733和1641,都在94.0%以下,说明干旱胁迫对无性系1733和1641的影响较小,对1716和1722的影响较大。
表 4 土壤干旱对各无性系细胞膜透性的影响Table 4. Effects of soil drought on membrane permeability of each clone无性系
Clone细胞膜透性 Membrane permeability/% 正常供水
Normal water
supply轻度干旱
Mild
drought中度干旱
Moderate
drought重度干旱
Severe
drought1641 12.5 ± 1.1bc 13.4 ± 0.4b 17.3 ± 1.3cd 24.2 ± 1.1cd 1733 11.1 ± 0.6c 13.5 ± 0.4b 16.9 ± 0.7cd 21.2 ± 1.8d 1627 11.2 ± 1.0c 13.1 ± 1.0b 15.9 ± 1.3d 22.1 ± 1.8d 2025 12.3 ± 0.7bc 14.1 ± 1.0b 18.6 ± 1.8bcd 24.9 ± 2.9bcd 1725 14.7 ± 0.9ab 15.5 ± 0.4ab 20.5 ± 2.9bcd 29.8 ± 2.8abc 1716 11.3 ± 0.4c 14.5 ± 0.2b 21.3 ± 1.1abc 33.1 ± 2.4a 1722 14.5 ± 1.2ab 17.6 ± 0.7a 25.7 ± 1.0a 31.5 ± 1.4ab I-107 12.8 ± 0.3bc 14.4 ± 1.3b 16.9 ± 0.5cd 24.9 ± 2.1bcd 1723 16.6 ± 0.6a 17.7 ± 1.2a 23.2 ± 1.7ab 33.0 ± 1.6a 1640 12.1 ± 0.9bc 14.3 ± 0.7b 19.1 ± 1.2bcd 25.2 ± 2.9bcd 2.4 干旱胁迫对黑杨派无性系MDA含量的影响
表5显示:随干旱胁迫程度的增加,10个无性系的叶片MDA含量表现出先升高后下降的变化规律,在中度干旱时达到最高水平,变幅在3.40 ~ 4.85 mmol/kg之间,其中MDA含量最高的是无性系1716,达到4.85 mmol/kg;MDA含量最低的是无性系1733,为3.40 mmol/kg。在重度干旱时,MDA含量下降,此时无性系1641和1627的MDA含量最低,显著低于对照2025。
表 5 土壤干旱对各无性系MDA含量的影响Table 5. Effects of soil drought on MDA content of each clone无性系
CloneMDA含量 MDA content/(mmol∙kg−1) 正常供水
Normal water
supply轻度干旱
Mild
drought中度干旱
Moderate
drought重度干旱
Severe
drought1641 1.87 ± 0.26a 2.36 ± 0.20b 3.79 ± 0.14b 1.11 ± 0.23e 1733 2.31 ± 0.12a 2.87 ± 0.22ab 3.40 ± 0.37b 1.65 ± 0.14bcde 1627 2.46 ± 0.21a 3.03 ± 0.36ab 3.50 ± 0.41b 1.28 ± 0.14de 2025 2.27 ± 0.13a 2.99 ± 0.27ab 4.12 ± 0.15ab 2.69 ± 0.23a 1725 2.31 ± 0.26a 3.47 ± 0.34a 4.24 ± 0.27ab 1.44 ± 0.15cde 1716 2.22 ± 0.16a 2.94 ± 0.22ab 4.85 ± 0.24a 1.74 ± 0.27bcde 1722 2.21 ± 0.13a 2.78 ± 0.35ab 4.65 ± 0.19a 2.18 ± 0.12ab I-107 2.16 ± 0.22a 3.04 ± 0.20ab 3.75 ± 0.27b 1.80 ± 0.13bcd 1723 1.86 ± 0.23a 2.54 ± 0.21b 4.21 ± 0.21ab 1.60 ± 0.35bcde 1640 2.13 ± 0.30a 2.73 ± 0.27ab 3.76 ± 0.14b 2.07 ± 0.16abc 2.5 干旱胁迫对黑杨派无性系SOD活性的影响
表6显示:在整个干旱胁迫过程中,各供试无性系的SOD活性表现出先升后降的变化规律。在干旱胁迫初期,植物体内会产生SOD来抵御干旱胁迫造成的伤害,所有无性系的SOD活性在中度干旱时最高,与正常处理相比,升高幅度较大的无性系是1627(28.8%)和1733(28.4%),升高幅度较小的是1725(12.8%)和1722(12.5%)。随干旱时间增加,保护酶活性下降,在重度干旱胁迫时降至最低,该处理下无性系1627和1733的SOD活性较高,无性系1716和1722的SOD活性较低,说明无性系1627的1733适应重度干旱环境的能力较强。
2.6 干旱胁迫对黑杨派无性系POD活性的影响
由表7可知:随干旱程度的加强,10个黑杨派无性系的POD活性先增大后减小,除无性系1716在轻度干旱POD活性达到峰值以外,其他无性系的POD活性均在中度干旱达到最高值,之后随着胁迫处理程度增加,在重度干旱时土壤水分严重匮乏,POD活性降低。中度干旱时,无性系1733和1641的POD活性升高幅度较大,增幅在265.0%以上;在重度干旱时,相比其他无性系,1733和1627的POD活性维持在较高水平,与对照2025和I-107差异显著。
表 6 土壤干旱对各无性系SOD活性的影响Table 6. Effects of soil drought on SOD activity of each clone无性系
CloneSOD活性 SOD activity/(U∙g−1) 正常供水
Normal water supply轻度干旱
Mild drought中度干旱
Moderate drought重度干旱
Severe drought1641 642.5 ± 32.8abc 728.5 ± 48.6ab 783.1 ± 20.5bcd 526.1 ± 25.5de 1733 619.4 ± 22.0bc 687.8 ± 16.6b 795.0 ± 11.5abc 667.5 ± 25.2ab 1627 637.3 ± 17.9abc 792.1 ± 11.4a 821.1 ± 23.7ab 700.7 ± 25.5a 2025 584.0 ± 18.7c 678.1 ± 13.3b 746.8 ± 8.1cd 603.5 ± 22.0abcd 1725 658.0 ± 27.0ab 736.3 ± 25.2ab 742.2 ± 31.4cd 547.4 ± 25.3cde 1716 684.4 ± 16.5ab 746.8 ± 9.4ab 795.4 ± 19.0abc 456.7 ± 15.2e 1722 645.9 ± 17.7abc 695.3 ± 12.7b 726.5 ± 20.8d 522.6 ± 39.0de I-107 619.0 ± 19.7bc 706.2 ± 12.9b 781.1 ± 22.2bcd 593.9 ± 14.3bcd 1723 703.0 ± 8.6a 785.9 ± 17.7a 855.3 ± 18.0a 605.1 ± 58.1abcd 1640 647.4 ± 4.9abc 682.0 ± 24.2b 777.5 ± 14.4bcd 629.8 ± 30.4abc 表 7 土壤干旱对各无性系POD活性的影响Table 7. Effects of soil drought on POD activity of each clone无性系
ClonePOD活性 POD activity/(U∙g−1) 正常供水
Normal water
supply轻度干旱
Mild
drought中度干旱
Moderate
drought重度干旱
Severe
drought1641 2 808 ± 197ab 6 108 ± 379b 10 275 ± 1032ab 4 633 ± 240bc 1733 2 358 ± 140ab 3 575 ± 388d 9 625 ± 516abc 5 075 ± 123ab 1627 3 392 ± 508a 7 692 ± 251a 11 400 ± 353a 5 433 ± 412a 2025 2 125 ± 205b 3 800 ± 486cd 6 617 ± 262ef 2 658 ± 183fg 1725 2 283 ± 243ab 3 258 ± 271d 7 142 ± 226def 3 075 ± 113ef 1716 3 417 ± 726a 8 092 ± 246a 4 092 ± 435g 2 183 ± 210g 1722 2 325 ± 194ab 4 983 ± 446bc 8 058 ± 130cde 3 567 ± 466de I-107 2 733 ± 269ab 5 792 ± 180b 9 225 ± 1318bc 4 192 ± 235cd 1723 2 325 ± 166ab 3 842 ± 718cd 5 825 ± 175fg 2 950 ± 181efg 1640 2 550 ± 238ab 3 917 ± 171cd 8 608 ± 484bcd 3 075 ± 101ef 2.7 干旱胁迫对黑杨派无性系游离脯氨酸含量的影响
从表8可以看出,各供试无性系叶片的游离脯氨酸含量随控水时间的延长而不断增加。10个无性系叶片的游离脯氨酸含量在中度干旱时明显上升,变幅在24.6 ~ 40.7 mg/g之间,该水平下游离脯氨酸含量最高的是无性系1733,达到40.7 mg/g;最低的是无性系1716,为24.6 mg/g,说明各无性系对干旱胁迫比较敏感。随着土壤含水量的不断降低,植物体内的游离脯氨酸含量持续升高,渗透调节能力逐渐增强。在重度干旱下,游离脯氨酸含量及升高幅度最大的均是无性系1627和1733,与对照2025呈显著性差异。
表 8 土壤干旱对各无性系游离脯氨酸含量的影响Table 8. Effects of soil drought on free proline content of each clone无性系
Clone游离脯氨酸含量 Free proline content/(mg·g−1) 正常供水
Normal water
supply轻度干旱
Mild
drought中度干旱
Moderate
drought重度干旱
Severe
drought1641 19.2 ± 0.6a 24.7 ± 0.7ab 32.0 ± 2.1abc 40.6 ± 2.7cd 1733 18.7 ± 1.6ab 26.0 ± 2.3ab 40.7 ± 3.4a 52.5 ± 4.9a 1627 15.0 ± 1.2cd 28.9 ± 0.7a 38.0 ± 5.4a 52.1 ± 3.4a 2025 20.0 ± 0.9a 23.8 ± 0.8abc 30.8 ± 2.7abc 35.5 ± 2.7cde 1725 18.1 ± 1.1abc 22.9 ± 1.4bcd 31.1 ± 2.7abc 42.1 ± 4.1bc 1716 13.4 ± 1.2d 18.3 ± 1.2cd 24.6 ± 1.3c 31.1 ± 2.5de 1722 14.2 ± 0.3d 17.2 ± 0.8d 24.9 ± 2.9c 28.8 ± 1.7e I-107 18.9 ± 1.2ab 25.2 ± 2.6ab 36.5 ± 3.8ab 50.9 ± 2.7ab 1723 15.5 ± 0.8bcd 22.0 ± 1.5bcd 25.7 ± 1.8c 35.2 ± 3.1cde 1640 15.1 ± 1.2cd 25.2 ± 3.3ab 28.1 ± 1.1bc 39.1 ± 1.0cd 2.8 相关性分析
对重度干旱胁迫下10个黑杨派无性系的各项指标进行相关性分析,根据表9可知:其苗高增量与地径增量、生物量增量和游离脯氨酸含量呈极显著正相关,与叶绿素含量、POD活性呈显著正相关;地径增量与生物量增量、POD活性和游离脯氨酸含量呈极显著正相关,与叶绿素含量呈显著正相关;生物量增量与POD活性、游离脯氨酸含量呈极显著正相关,与叶绿素含量呈显著正相关;叶绿素含量与游离脯氨酸含量呈极显著正相关,与POD活性呈显著正相关,与细胞膜透性呈显著负相关;细胞膜透性与游离脯氨酸含量呈极显著负相关,与SOD活性和POD活性呈显著负相关;SOD活性与游离脯氨酸含量呈显著正相关;POD活性与游离脯氨酸含量呈极显著正相关。
表 9 干旱胁迫下无性系各指标间相关性分析Table 9. Correlation analysis among indicators of clones under drought stress指标 Index X1 X2 X3 X4 X5 X6 X7 X8 X9 X1 1 X2 0.880** 1 X3 0.793** 0.906** 1 X4 0.695* 0.755* 0.757* 1 X5 −0.615 −0.627 −0.585 −0.651* 1 X6 −0.617 −0.541 −0.547 −0.482 0.116 1 X7 0.518 0.586 0.441 0.530 −0.704* −0.033 1 X8 0.634* 0.782** 0.791** 0.757* −0.752* −0.537 0.593 1 X9 0.857** 0.882** 0.807** 0.913** −0.789** −0.446 0.709* 0.788** 1 注:X1. 苗高增量;X2. 地径增量;X3. 生物量增量;X4. 叶绿素含量;X5. 细胞膜透性;X6. MDA含量;X7. SOD活性;X8. POD活性;X9. 游离脯氨酸含量。*表示在0.05水平上显著相关,**表示在0.01水平上极显著相关。Notes: X1, ramet height increment; X2, basal diameter increment; X3, biomass increment; X4,chlorophyll content; X5, membrane permeability; X6, MDA content; X7, SOD activity; X8, POD activity; X9, free proline content. * indicates significant correlation at the 0.05 level, ** indicates highly significant correlation at the 0.01 level. 根据相关性分析可知:各测定指标具有一定的相关性,大部分指标间存在着显著的正负相关关系,说明各指标间存在相同的或者相反的变化关系,表中指标所反映的信息有一定的重叠性,直接利用这些指标会比较片面,因此需要用综合评价方法对其进行评价分析。
2.9 主成分分析
对10个无性系在严重缺水条件下的生长及生理指标进行主成分分析,将多个相关指标转换为几个独立的综合指标,并对各个无性系进行综合评价。主成分分析结果如表10所示,第1、第2主成分的累积贡献率达83.962%,表明这2个主成分可以把原来9项指标83.962%的信息表达出来。由表10可知:第1主成分中地径增量、生物量增量、游离脯氨酸含量、苗高增量、POD活性、叶绿素含量的特征向量绝对值较大,且均为正值,说明第1主成分主要反映无性系的生长量、渗透调节物质和抗氧化酶信息;第2主成分中丙二醛含量、SOD活性、细胞膜透性的特征向量绝对值较大,其中除细胞膜透性为负值,其余均为正值,说明第2主成分主要反映膜脂过氧化、抗氧化酶信息。
表 10 干旱胁迫下各指标的主成分特征向量、特征值及累计贡献率Table 10. Principal component characteristic vector, characteristic value and cumulative contribution rate of each index under drought stress测定指标
Measurement index第1主成分
Principal
component 1第2主成分
Principal
component 2苗高增量 Ramet height increment 0.351 −0.169 地径增量 Basal diameter increment 0.371 −0.100 生物量增量 Biomass increment 0.354 −0.182 叶绿素 Chlorophyll 0.349 −0.017 细胞膜透性 Membrane permeability −0.313 −0.424 丙二醛 MDA −0.222 0.678 超氧化物岐化酶 SOD 0.271 0.528 过氧化物酶 POD 0.351 0.012 游离脯氨酸 Free proline 0.384 0.097 特征值 Characteristic value 6.335 1.221 累计贡献率 Cumulative contribution rate/% 70.393 83.962 根据主成分分析得到10个无性系的第1主成分值F1和第2主成分值F2,根据公式F = 0.703 93F1 + 0.135 69F2计算综合主成分值,并将其排序,对各供试无性系的抗旱能力进行综合评价比较。由表11可知:10个黑杨派无性系的抗旱能力由强到弱依次为1733、1627、I-107、1641、1640、1725、1723、2025、1716、1722,其中无性系1733和1627的抗旱性优于I-107。
表 11 干旱胁迫下10个无性系的综合主成分值Table 11. Intergrated principal component values of 10 clones under drought stress无性系
CloneF1 F2 F 排序
Ranking1641 0.936 −1.223 0.493 4 1733 3.904 0.302 2.789 1 1627 3.567 0.306 2.552 2 2025 −2.188 2.135 −1.250 8 1725 −0.580 −0.876 −0.527 6 1716 −2.545 −1.497 −1.995 9 1722 −3.092 0.202 −2.149 10 I-107 2.150 0.092 1.526 3 1723 −1.218 −0.596 −0.938 7 1640 −0.723 1.155 −0.352 5 注:F1和F2代表第1主成分值和第2主成分值,F代表综合主成分值。Notes: F1 and F2 represent the 1st and 2nd principal component values and F represents the composite principal component value. 3. 讨论与结论
外部环境和自我调控机制共同作用于植物的生长发育,两者相互促进,对植物的正常生命活动产生作用[12]。当植物受到干旱胁迫的影响时,植物的生长量和生物量分配发生变化,以适应干旱环境带来的伤害。在本试验中,不同程度的干旱胁迫对10个黑杨派无性系的生长产生抑制,并导致其叶绿素含量、细胞膜透性、抗氧化酶活性、游离脯氨酸含量等生理生化指标发生不同程度的变化,说明不同无性系对干旱环境的适应能力也不同。重度干旱胁迫下各无性系的苗高增量、地径增量和生物量增量均有所不同,其中无性系1733和1627的生物量增量较大,无性系2025和1722的生物量增量较小。
干旱会使植物叶片受到损伤,影响植物正常进行光合作用。研究表明,植物在受到干旱胁迫时,叶绿素含量呈下降趋势[13−14]。在本试验中,随着干旱胁迫时间的延长,各无性系的叶绿素含量在轻度干旱下较对照轻微增加,这可能是因为植物为保持光合作用的稳定和适应干旱环境,自我调节增加了体内叶绿素含量,也有可能是由于干旱导致了植株的叶片发育受到阻碍,造成叶片水分流失,从而叶绿素含量升高;而在干旱胁迫后期土壤水分降低,叶绿素含量下降,表明干旱胁迫对10个黑杨派无性系叶片的叶绿素合成具有明显的抑制作用,同时原有的叶绿素会加速分解,导致光合作用能力降低,进而影响其生长量和生物量积累。这与之前对小叶杨(P. simonii)无性系[15]、白杨派(Sect. Leuce)无性系[16]的研究中得出的结果相同。
干旱同样会危害植物的细胞膜系统,发生膜脂过氧化。植物细胞膜在正常供水条件下选择透过性比较稳定,当土壤水分匮乏,细胞膜受到损伤,透性增大。持续干旱胁迫下,10个黑杨派无性系叶片的细胞膜透性呈增加的变化趋势,这与邱兴等[17]对4个1年生杨树无性系的研究结果基本一致,说明干旱胁迫对各无性系的植株幼苗细胞膜系统均造成了破坏。但不同无性系的升高幅度不一致,表明干旱条件下植物细胞膜受到的损伤程度不同。重度干旱时,无性系1716叶片的细胞膜透性增加幅度最大,说明其受到的损伤最为严重;无性系1733叶片的细胞膜相对透性增加幅度最小,说明其受到的伤害最小,对干旱环境的更有耐受性。膜脂过氧化的最终产物丙二醛,会导致生物膜的结构和功能发生改变,对植物产生毒害作用,其含量的高低可以反映膜脂过氧化作用的强弱。前人[18]对美洲黑杨的研究结果表明:不同美洲黑杨在遇到干旱胁迫后,其MDA含量存在着较大的差异。在本试验中,10个无性系在受到干旱胁迫时,MDA含量大幅增加,这说明土壤水分亏缺导致细胞膜脂过氧化作用逐渐加强,细胞膜受到伤害,胞内电解质外溢。在干旱胁迫后期,MDA含量达到最高值后不再增加,并随着水分匮乏严重,其含量开始降低,这可能是细胞代谢紊乱所致[19]。从MDA的含量来看,无性系1716和1722受到干旱胁迫的膜伤害更早出现,而无性系1733和1627的细胞膜相对受害程度较轻,其抗旱能力较强。这与鲁俊倩等[20]对‘84K’杨(P. alba × P. glandulosa ‘84K’)的研究结果相同。
干旱能够促进植物增强抗氧化酶的活性来缓解氧化损伤[21−22],提高保护能力。SOD和POD是植物体内重要的保护酶,逆境条件下,SOD和POD活性增强可以提高其抗氧化能力,降低胁迫对膜系统造成的损伤。相关研究发现,在不同程度的干旱胁迫下,杨树苗叶片的SOD和POD活性呈先升高后降低的趋势[23]。在本试验中,干旱胁迫前期SOD、POD活性较对照明显上升,说明一定程度的干旱胁迫会加快植物体内抗氧化酶的积累以适应干旱环境;随着干旱胁迫时间增加和干旱胁迫程度加重,这2种保护酶的活性均出现下降,说明黑杨派无性系对干旱胁迫的忍耐能力有一定的限度,当干旱程度超出自身的承受范围时,抗氧化酶活性降低,对活性氧和自由基的清除能力减弱,从而使膜系统受到破坏,对植物造成伤害。这与对蔷薇(Rosa multiflora)[24]、柽柳(Tamarix amarisk)[25]及小青杨(P. pseudo-simonii)[26]等的研究结论相似。在重度干旱时,无性系1733和1627的SOD和POD活性相对较高,均排在前2位,可以更好地抵抗干旱胁迫,减少活性氧的积累,增强抗旱能力。
干旱还会引起植物体内渗透调节物质的含量变化,植物在缺水状态下能够通过积累大量有机物质和无机离子,以调节渗透压[27],提高抗旱能力,避免其遭受干旱胁迫引起的损伤[28−29]。在本试验中,10个黑杨派无性系叶片中游离游离脯氨酸含量均随干旱胁迫程度的加重而不断增加,并且高于对照,说明游离脯氨酸的积累与黑杨派无性系抵抗干旱胁迫的能力密切相关,这与李敏等[30]对3种杨树的研究结果一致。游离脯氨酸作为一种重要的渗透调节物质,可以在一定程度上保持细胞渗透压平衡,10个无性系的游离脯氨酸含量升高幅度各不一致,表明其在干旱环境下维持渗透压稳定的能力不同。在重度干旱时,游离脯氨酸含量增幅最大的无性系是1627和1733,说明这2个无性系在干旱条件下细胞维持渗透压能力较强,对干旱环境的适应性强。
植物的抗旱能力受多种因素的影响,且不同植物面对干旱胁迫的响应不同,为应对干旱胁迫的伤害,黑杨派无性系启动自身的调节机制,体内抗氧化酶活性和渗透调节物质含量产生变化。本试验结果表明:在重度干旱胁迫下,10个无性系的各项指标与抗旱性存在不同相关性,其中细胞膜透性和MDA含量与抗旱性呈负相关,其余指标与抗旱性呈正相关。运用主成分分析法对各无性系进行综合评价,可以较为全面地评价干旱胁迫对无性系的影响,本研究初步认为无性系1733和1627具有较强的抗旱性,这2个无性系均属于欧美杨,另外3个欧美杨无性系I-107、1641和1640均排在前5位,5个美洲黑杨无性系1725、1723、2025、1716和1722均排在后5位,由此推测欧美杨的抗旱能力强于美洲黑杨。本试验采用盆栽模拟干旱试验,对10个黑杨派无性系的抗旱性常用指标进行测试和分析,并对其抗旱能力强弱进行综合评价,筛选出2个抗旱能力较强的欧美杨无性系,该试验结果为干旱立地杨树新品种选育和推广提供了重要参考依据,对林业生产具有重要指导意义。后期将对这些无性系进行田间抗旱能力测定,进一步验证其抗旱能力。
-
![]()
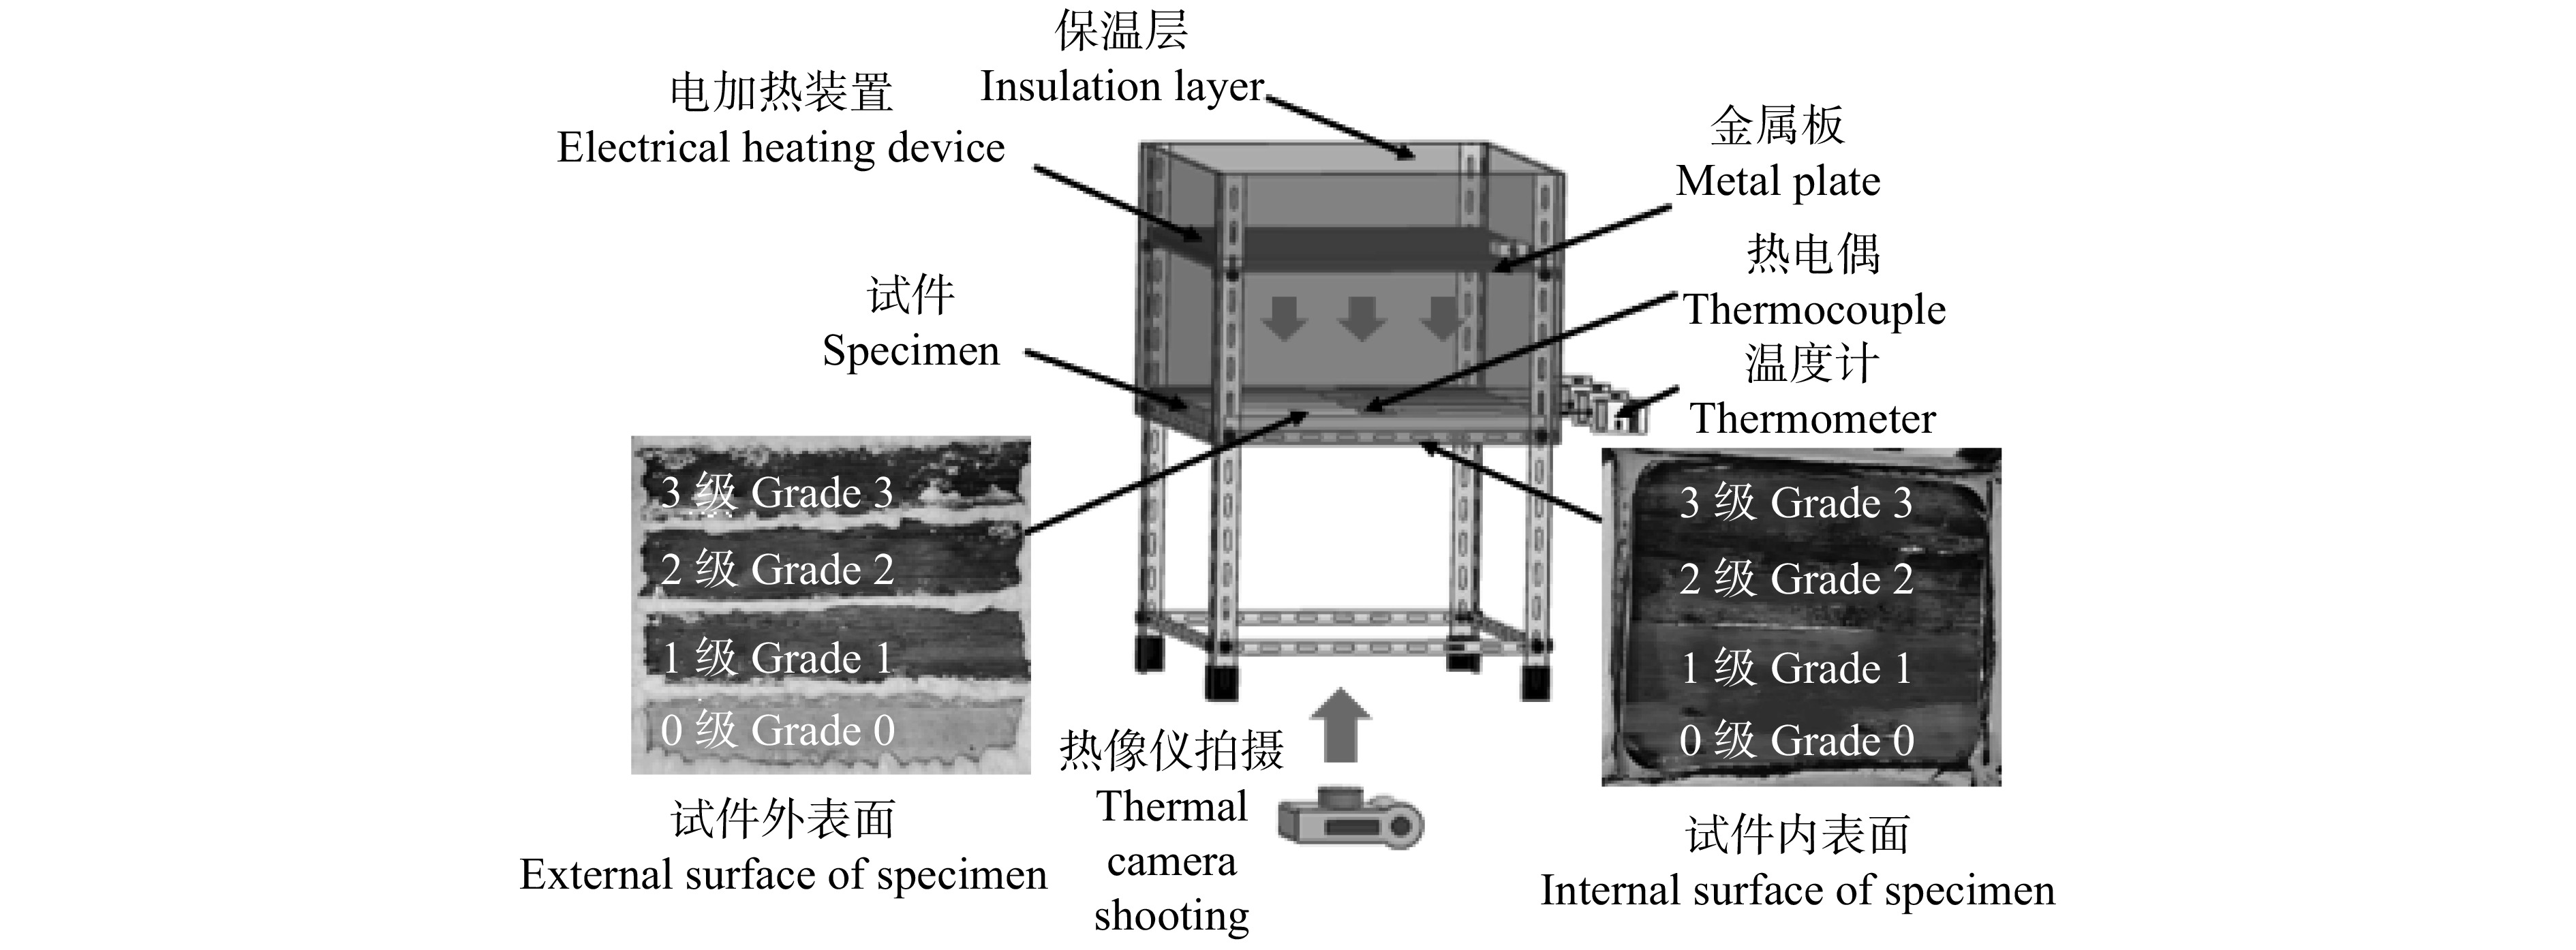
图 4 望板腐朽状况红外检测装置
Figure 4. Infrared detection device for testing roof boarding decay condition
![]()
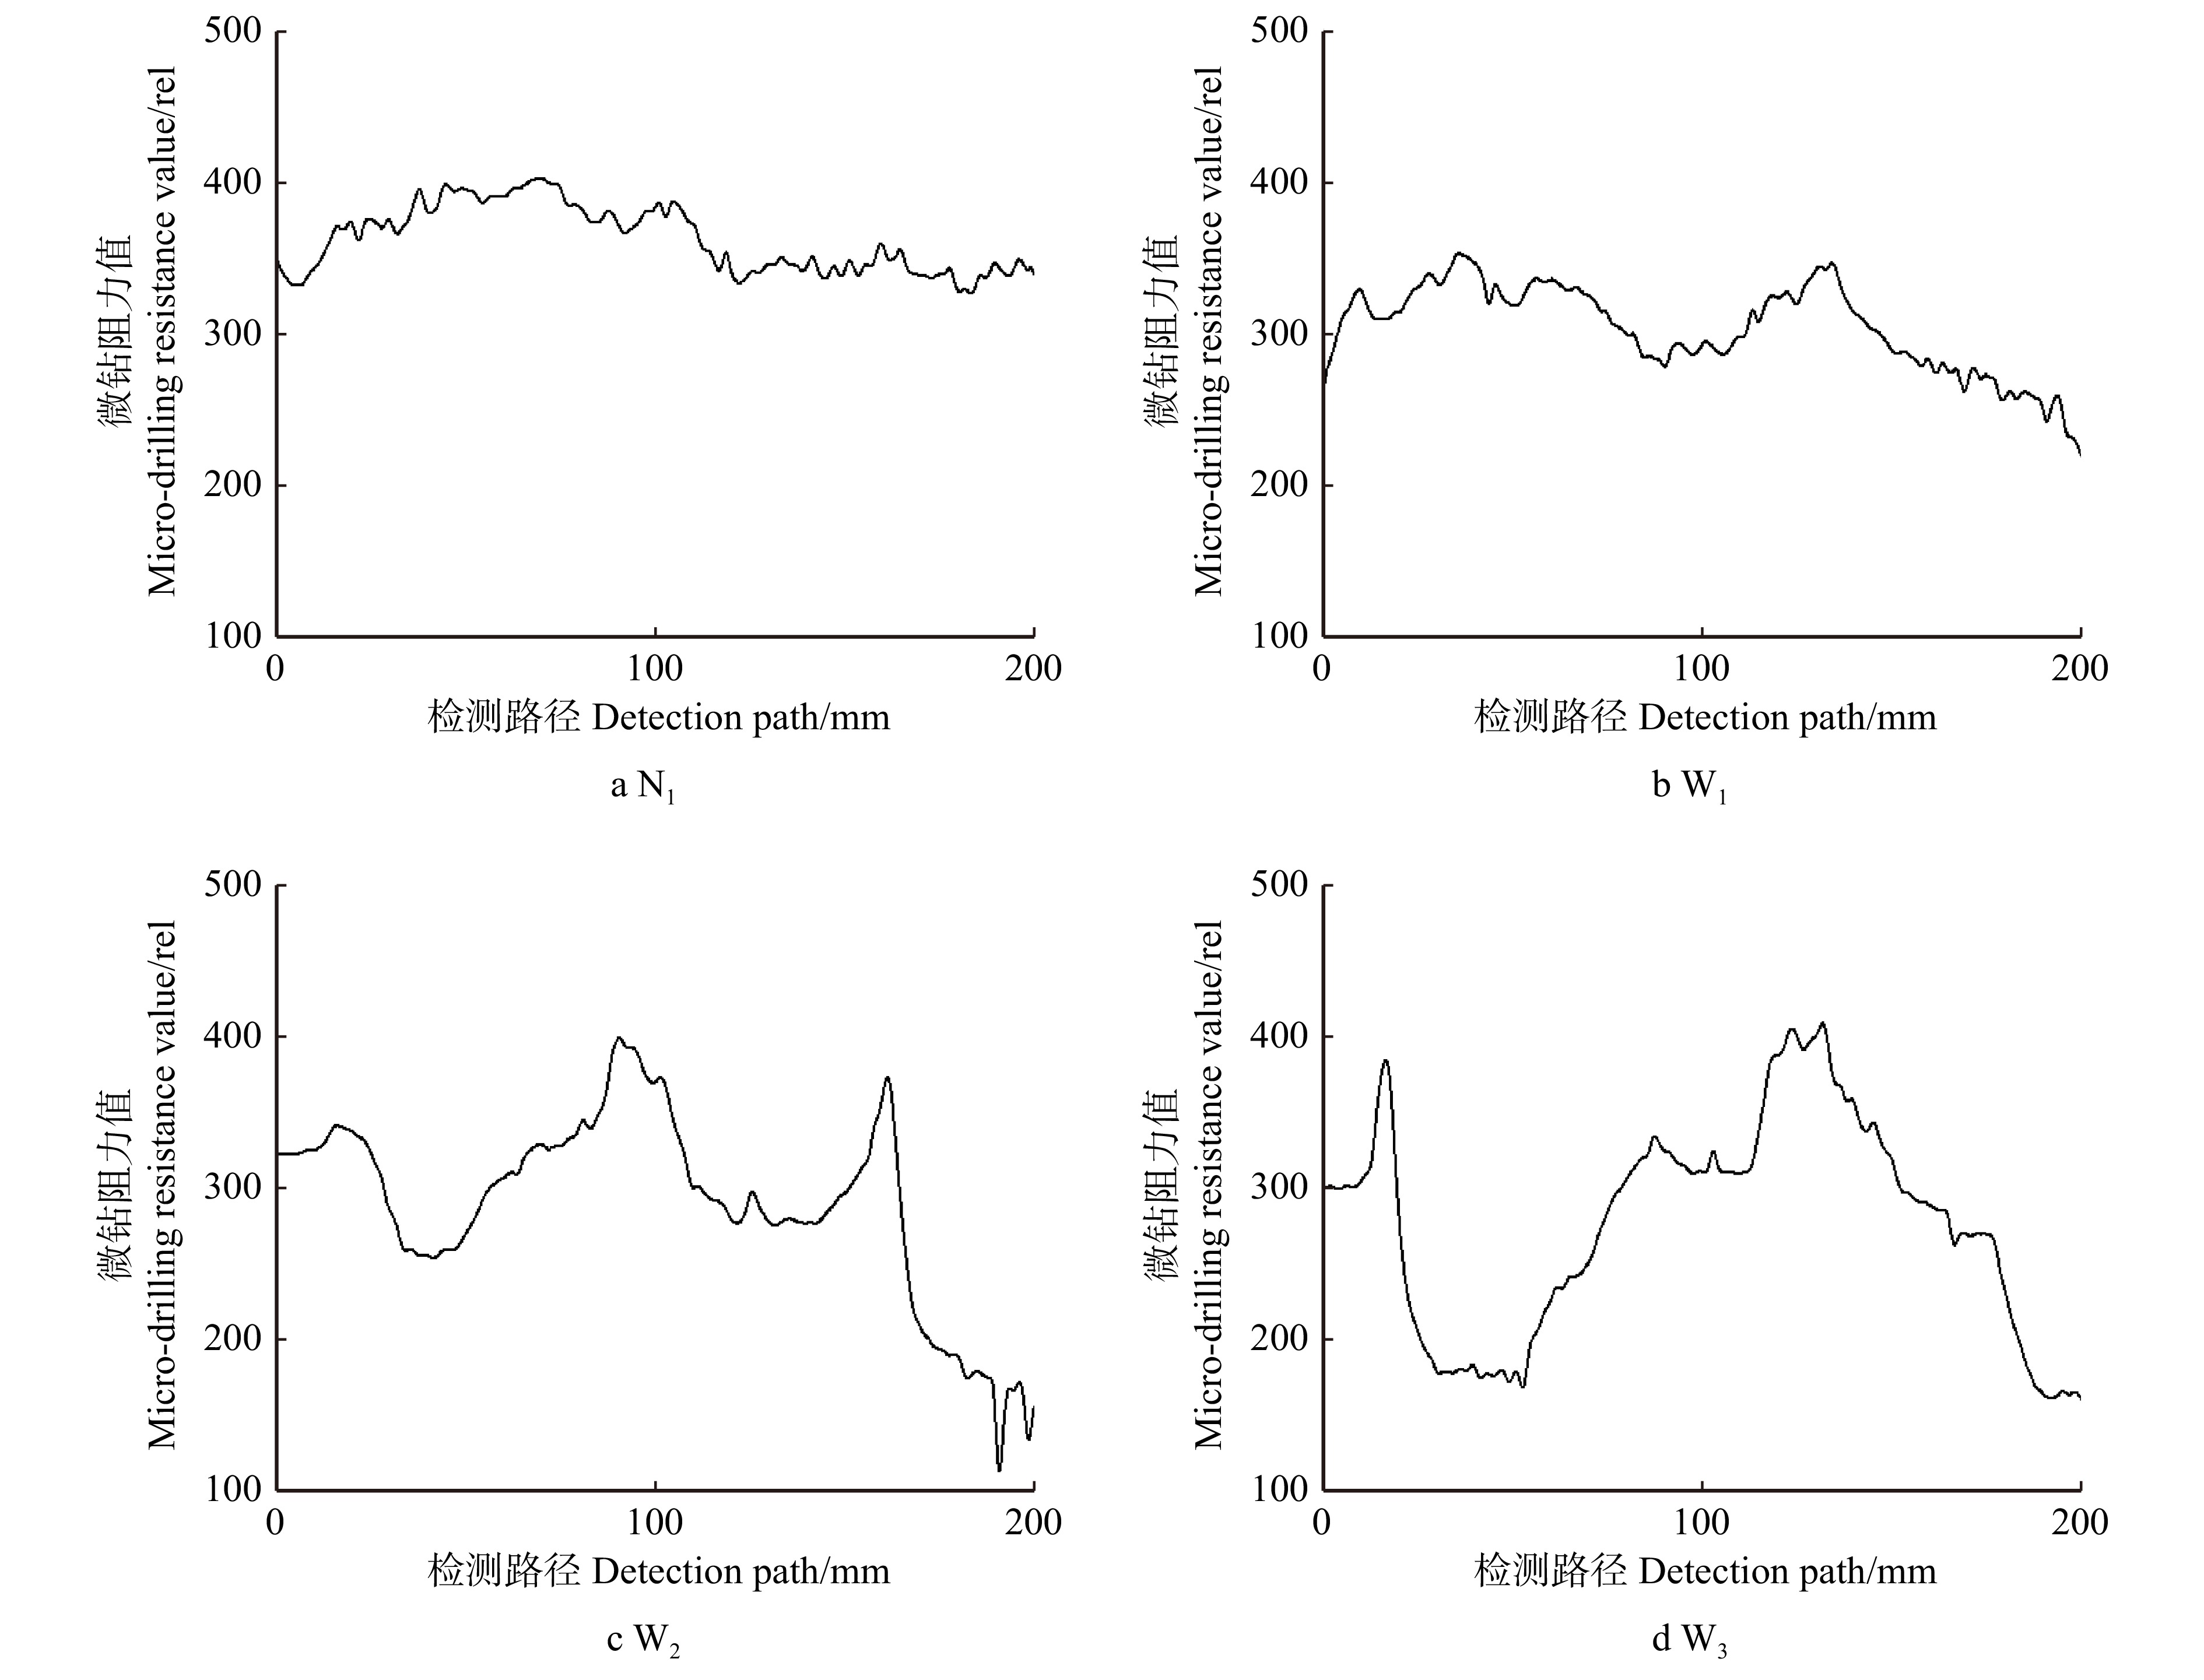
图 5 4种腐朽等级望板微钻阻力值分布图
Figure 5. Distribution of micro-drilling resistance value of roof boarding with 4 decay grades
![]()
图 6 平均微钻阻力值和腐朽厚度相关性图
Figure 6. Correlations between micro-drilling resistance value and decay thickness
![]()
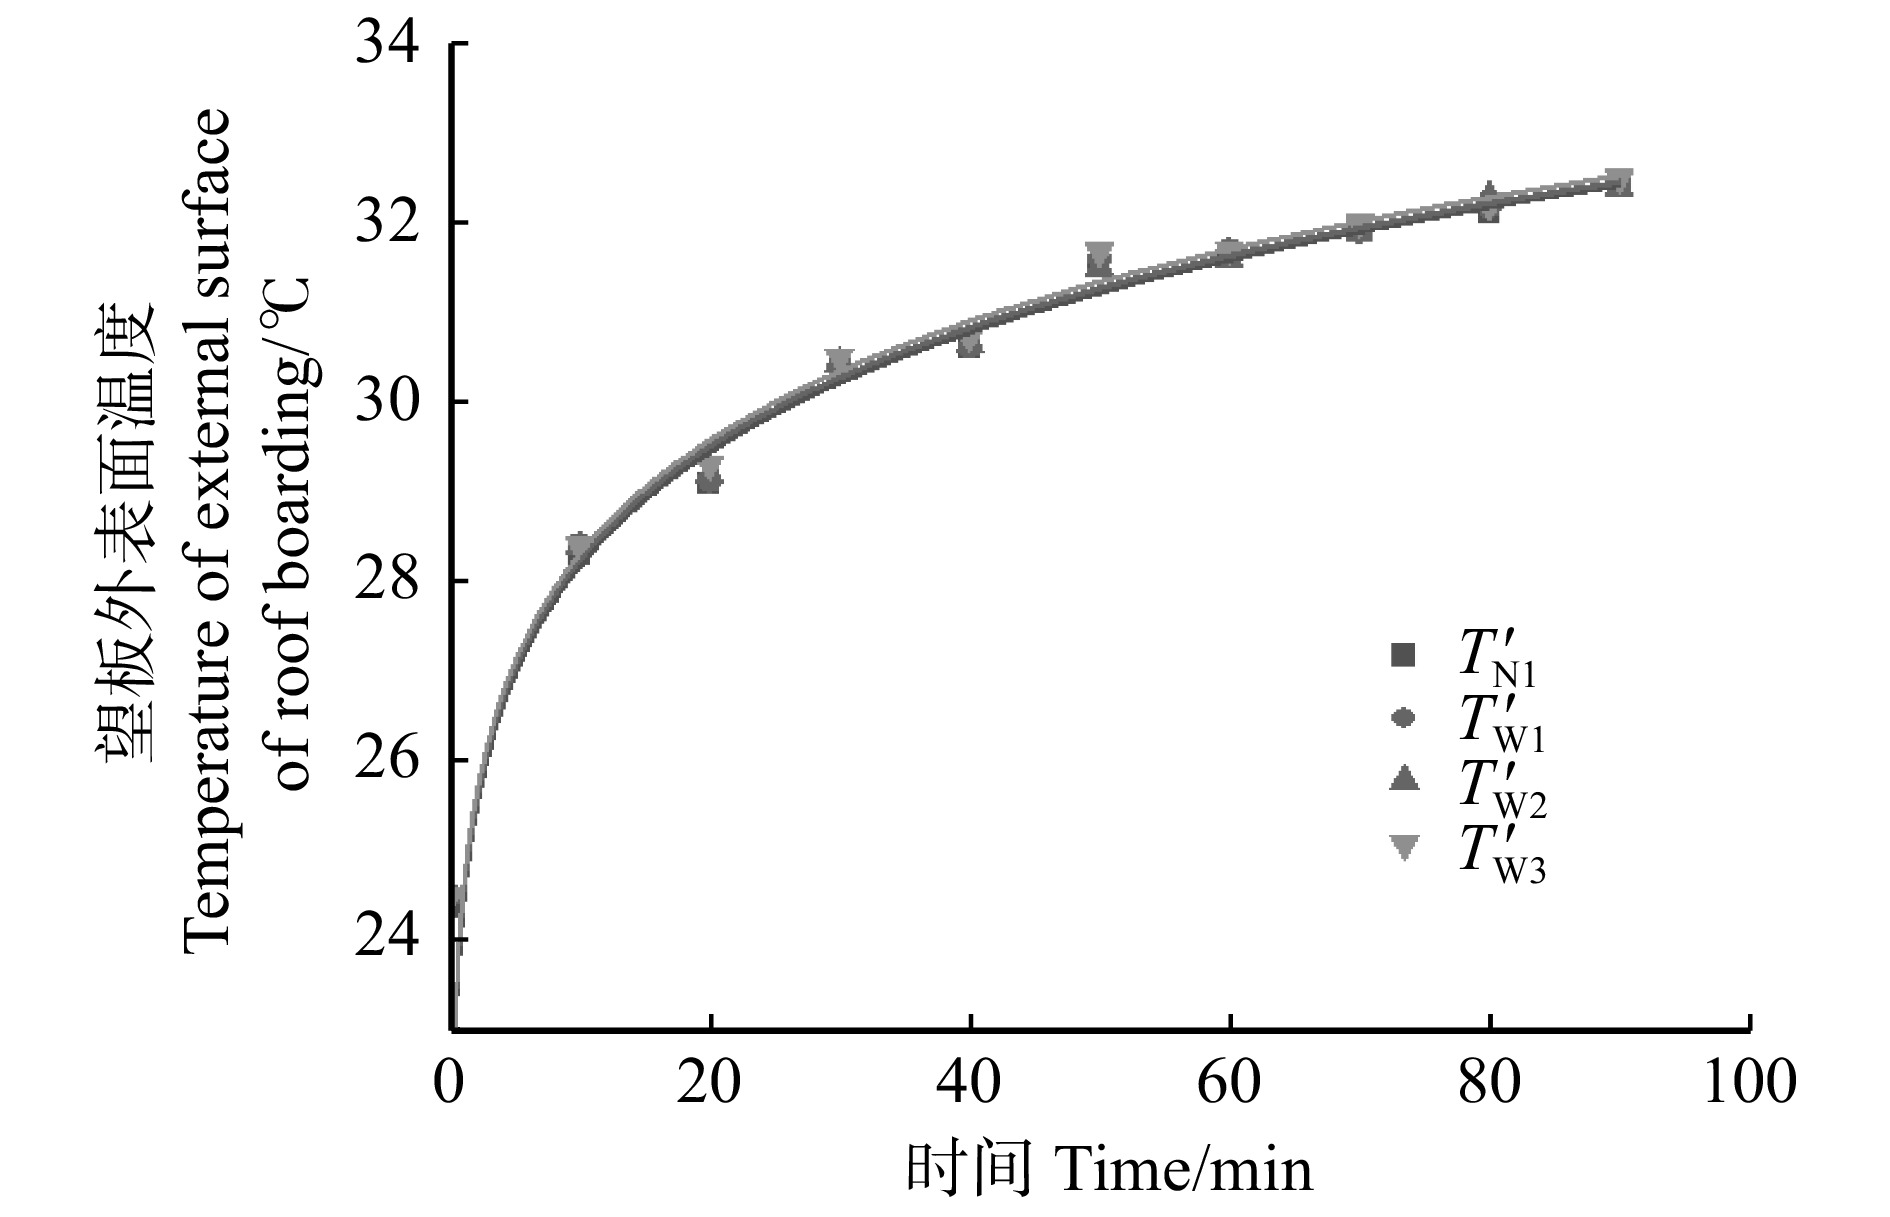
图 7 4种腐朽等级望板外表面温度变化图
T′N1、T′W1、T′W2和T′W3分别代表试件N1、W1、W2和W3的外表面温度。T′N1, T′W1, T′W2 and T′W3 represent the outer surface temperatures of specimens N1, W1, W2 and W3, respectively.
Figure 7. Temperature changes of external surface of roof boarding with 4 decay grades
![]()
图 8 4种腐朽等级望板内表面平均温度变化图
TN1、TW1、TW2和TW3分别代表试件N1、W1、W2和W3的内表面平均温度。TN1, TW1, TW2, and TW3 represent the average internal surface temperatures of specimens N1, W1, W2 and W3, respectively.
Figure 8. Average temperature changes of internal surface of roof boarding with 4 decay grades
![]()
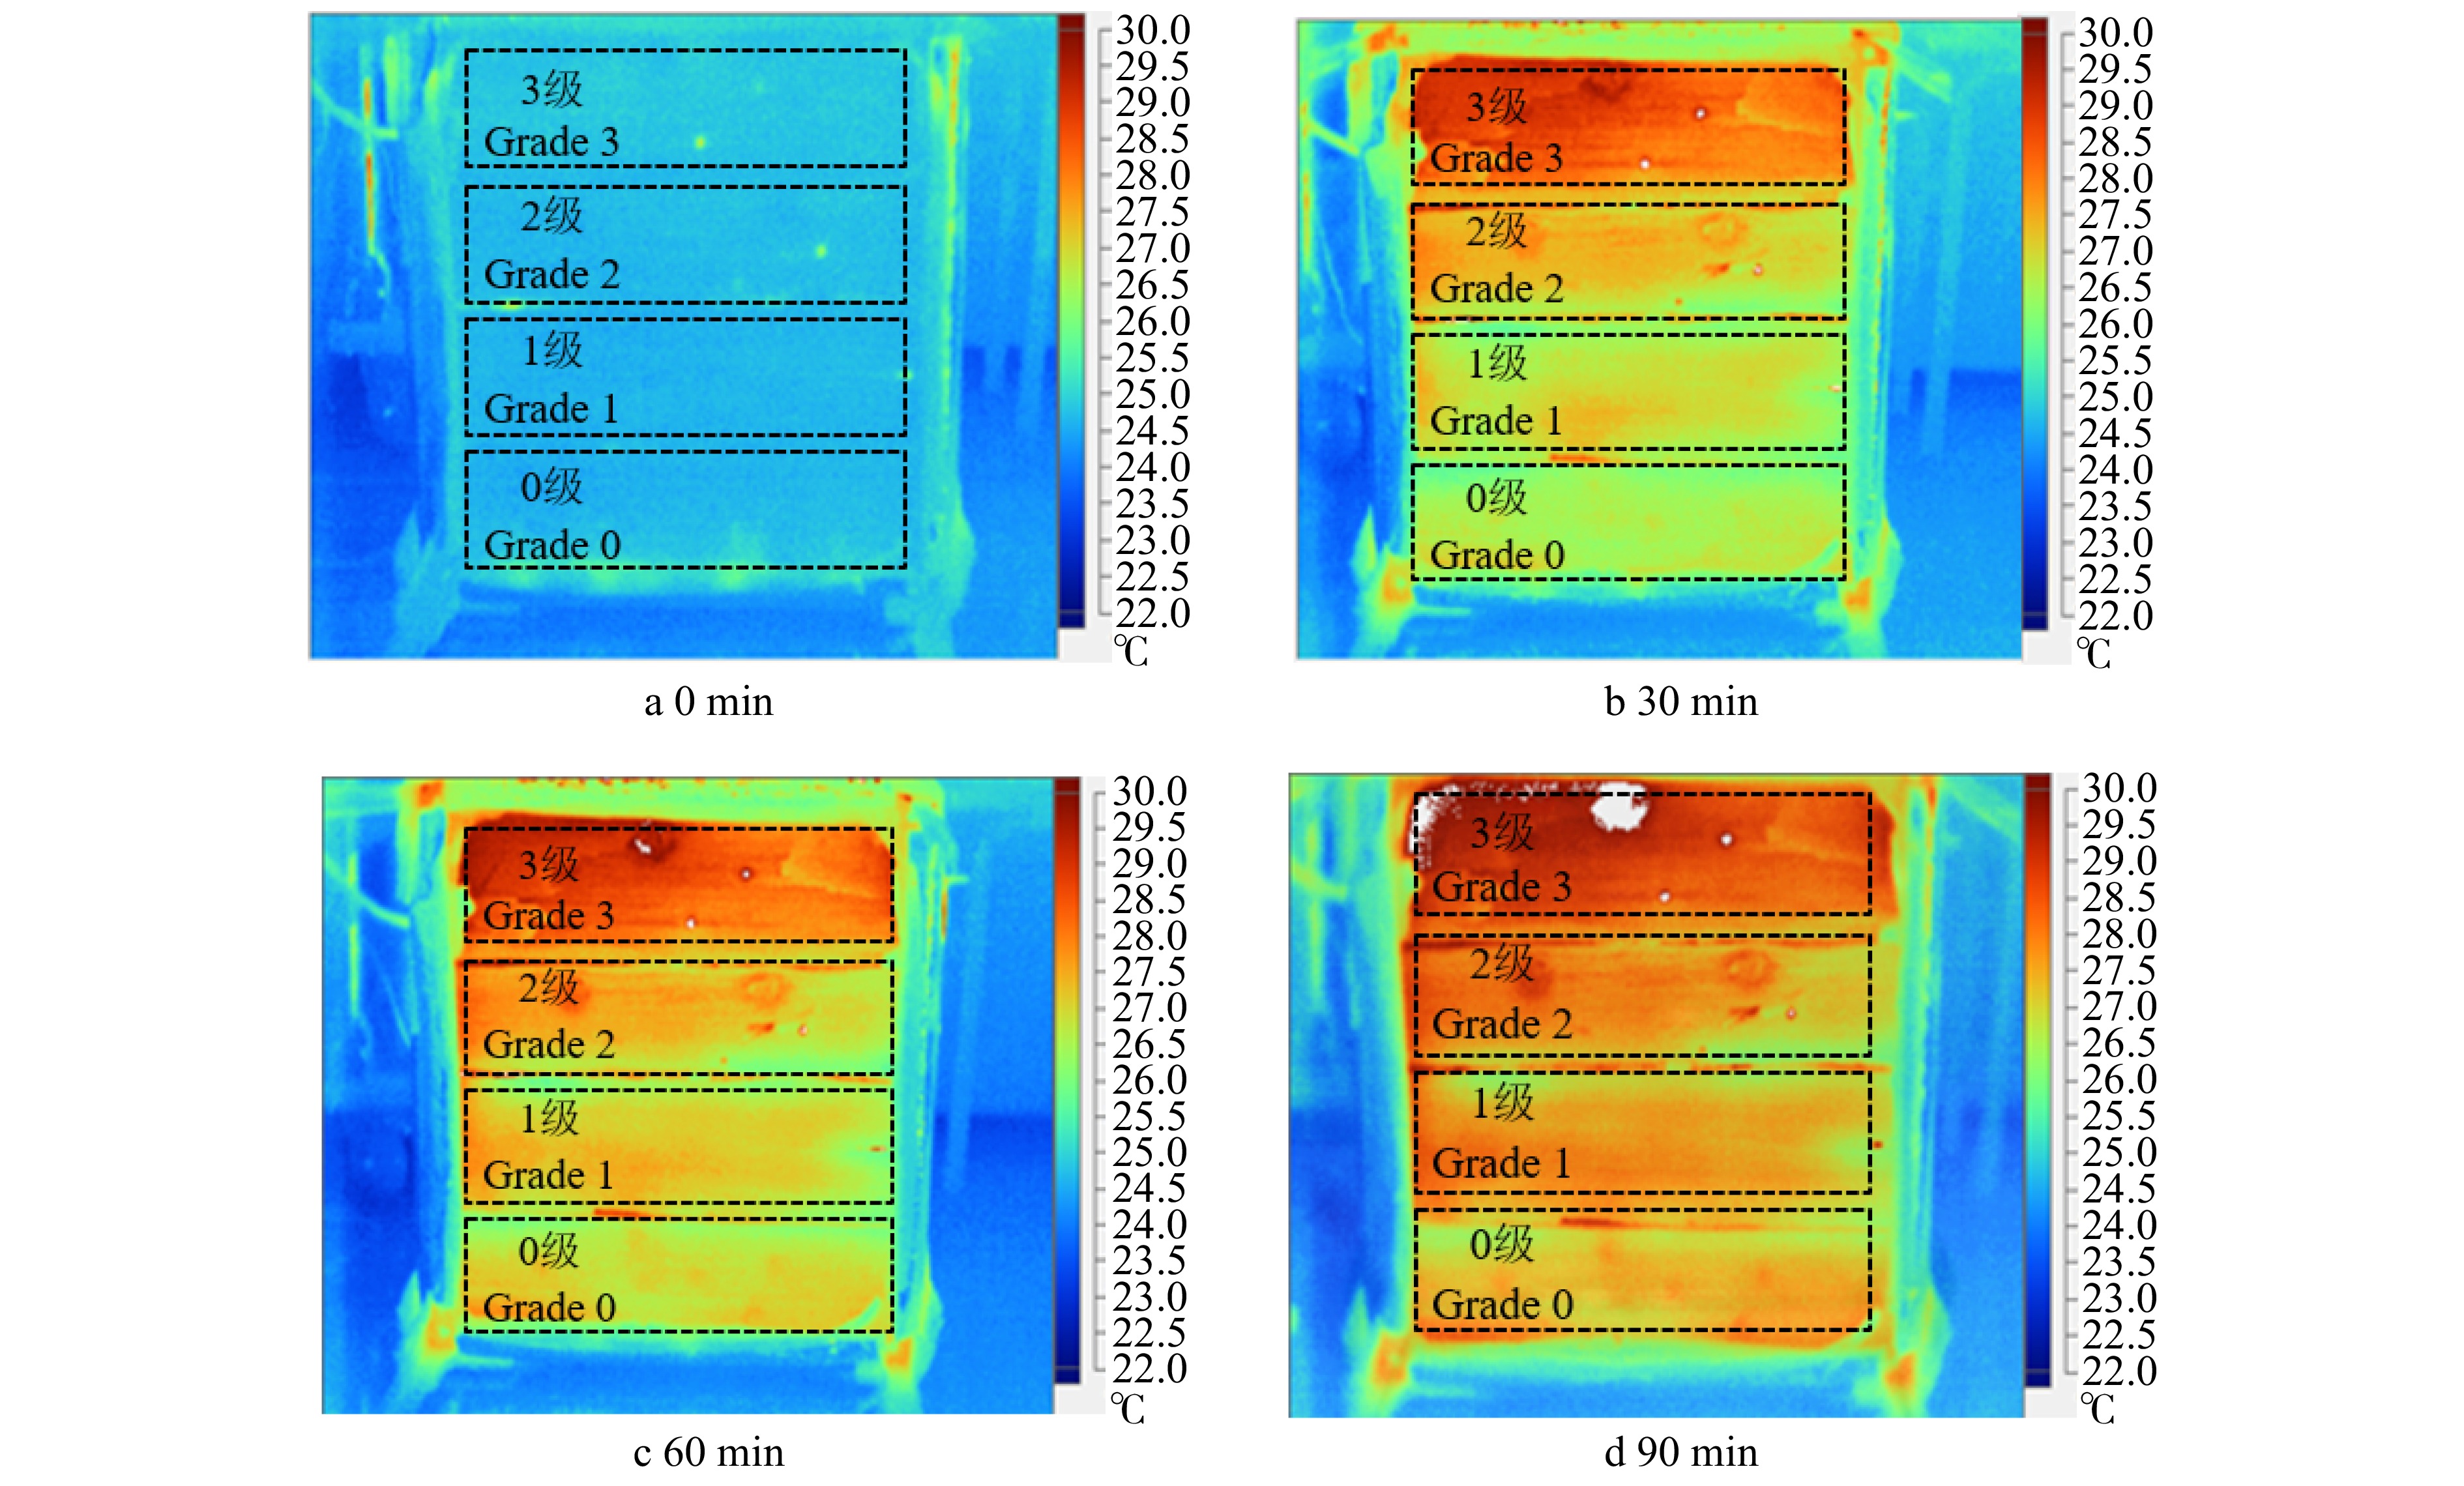
图 9 望板试件加热到0、30、60、90 min时刻的内表面红外热成像图
Figure 9. Infrared thermogram of the internal surfaces of roof boarding specimens when heated to 0, 30, 60 and 90 min
![]()
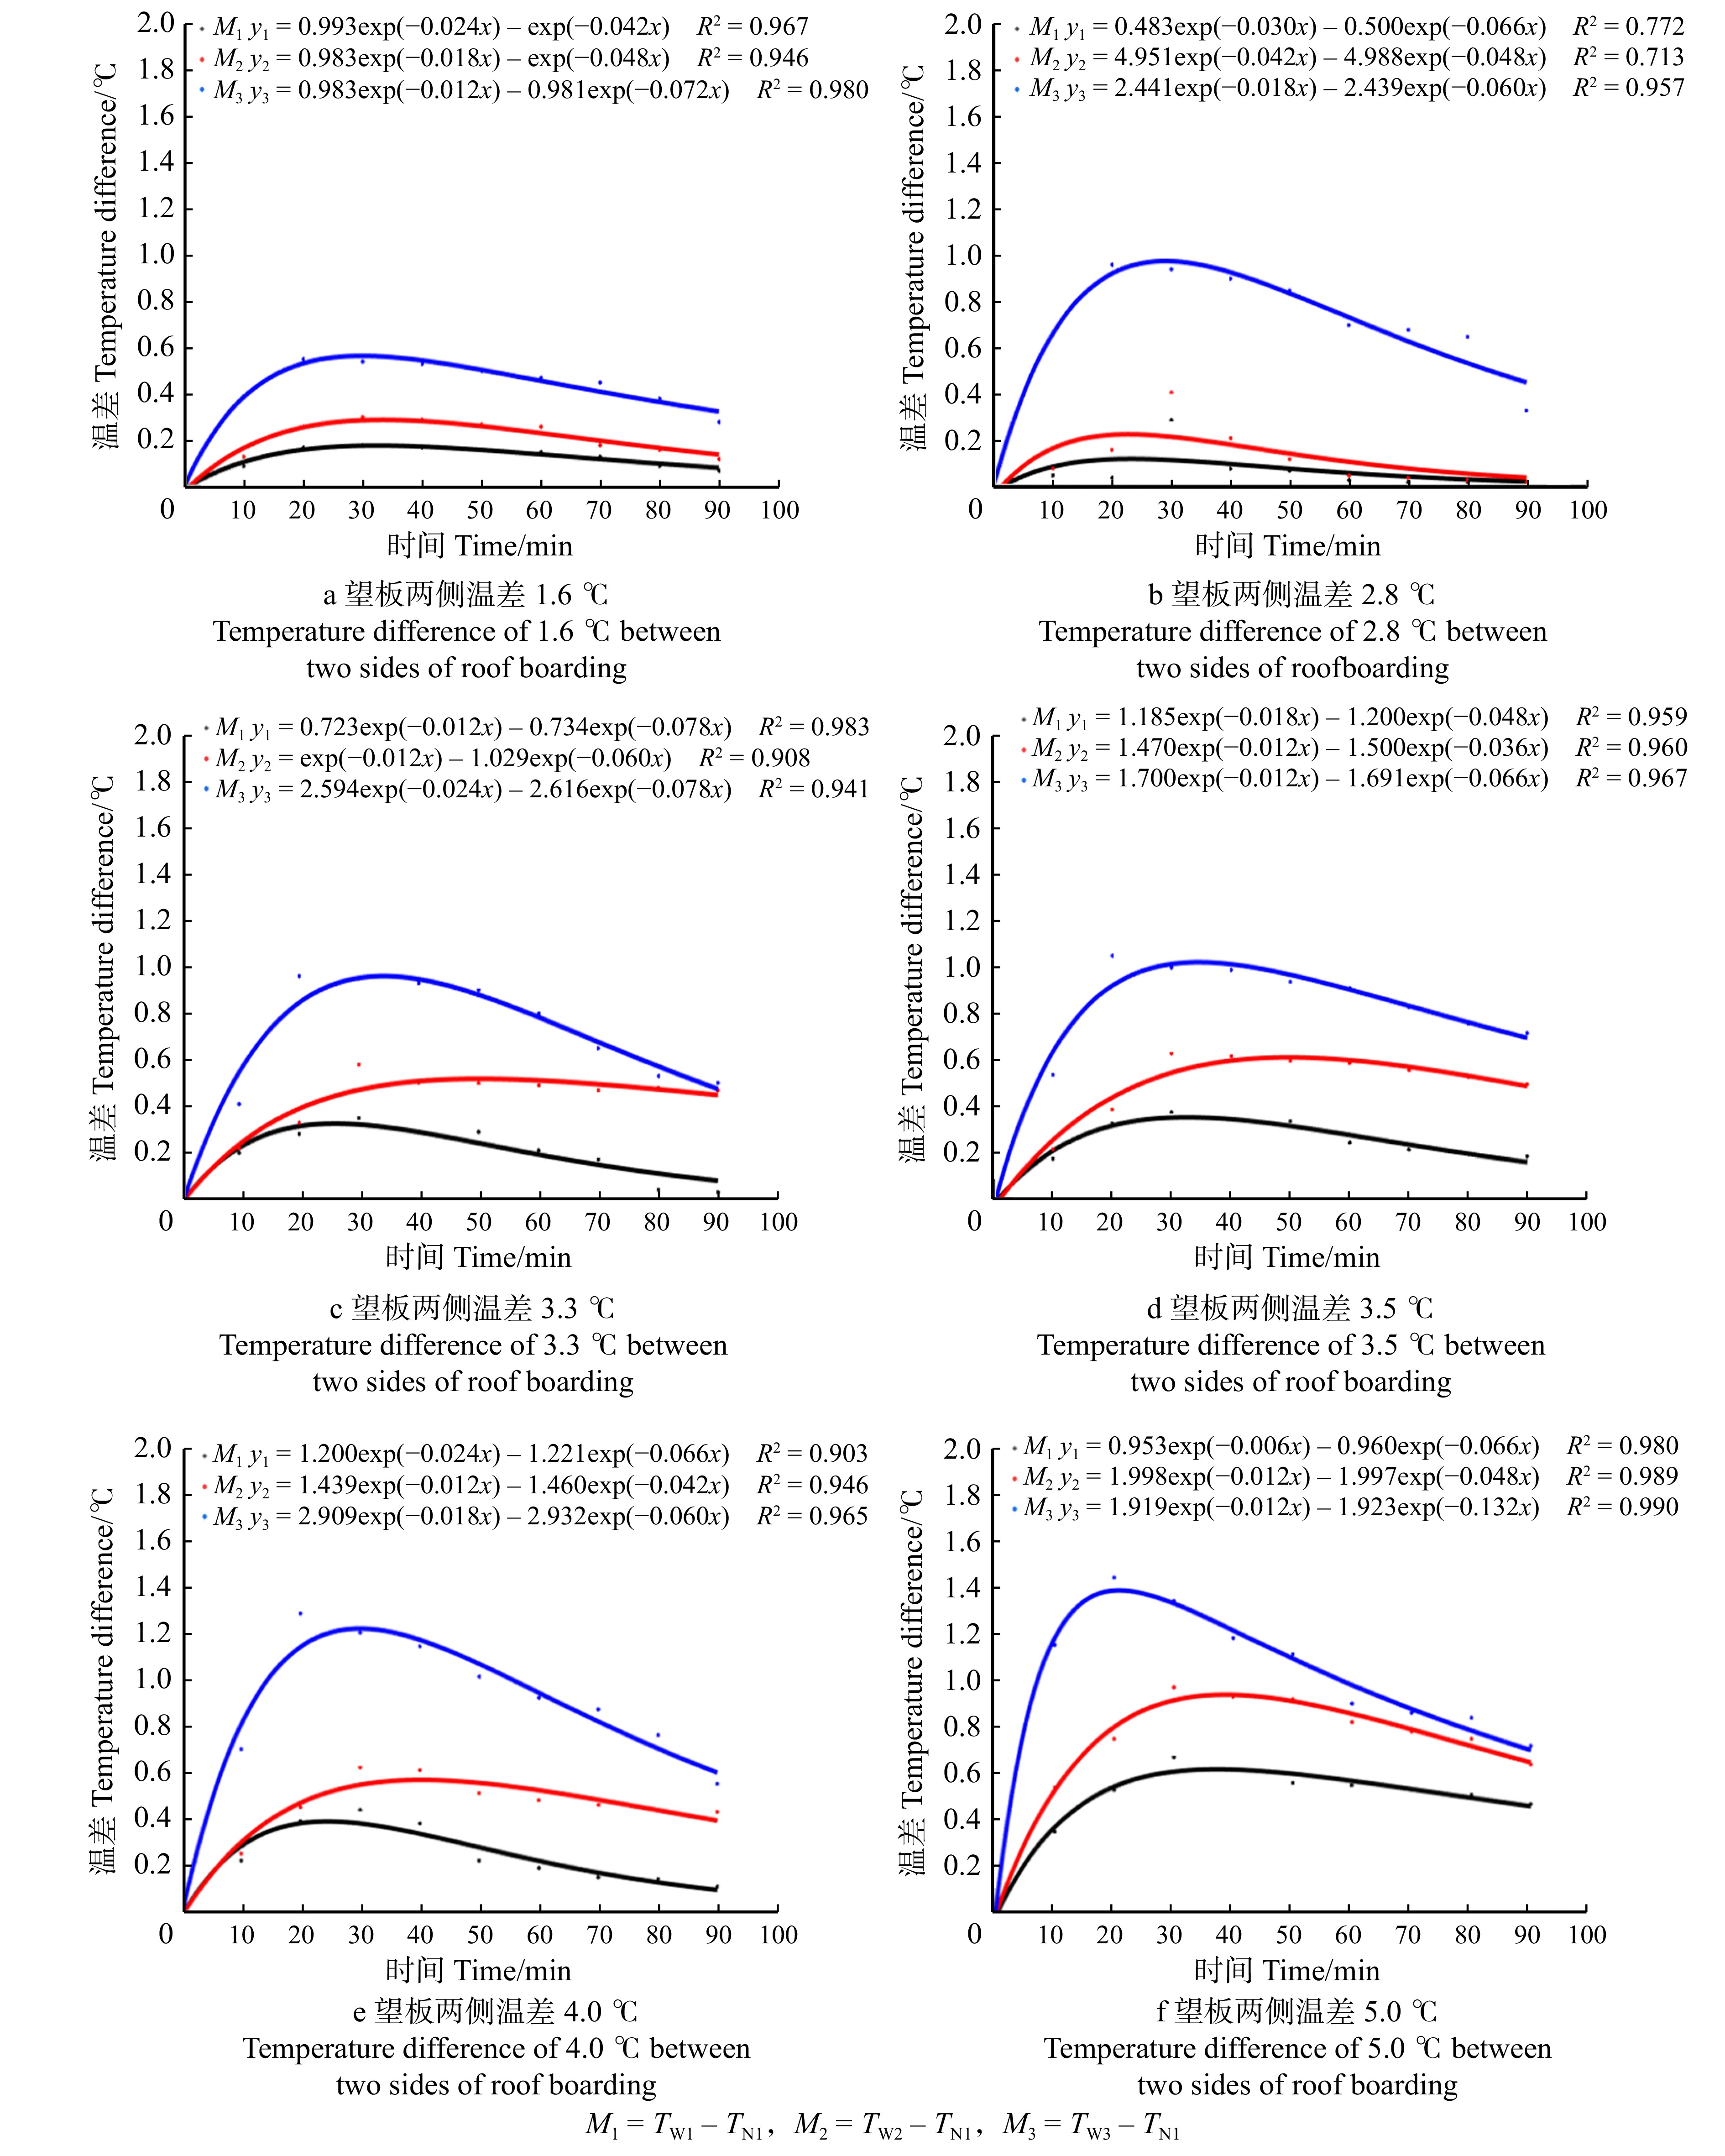
图 10 1级、2级、3级望板分别与0级望板内表面平均温差图
Figure 10. Average temperature differences between the internal surfaces of grade 1, grade 2 and grade 3 roof boarding and grade 0 roof boarding
![]()
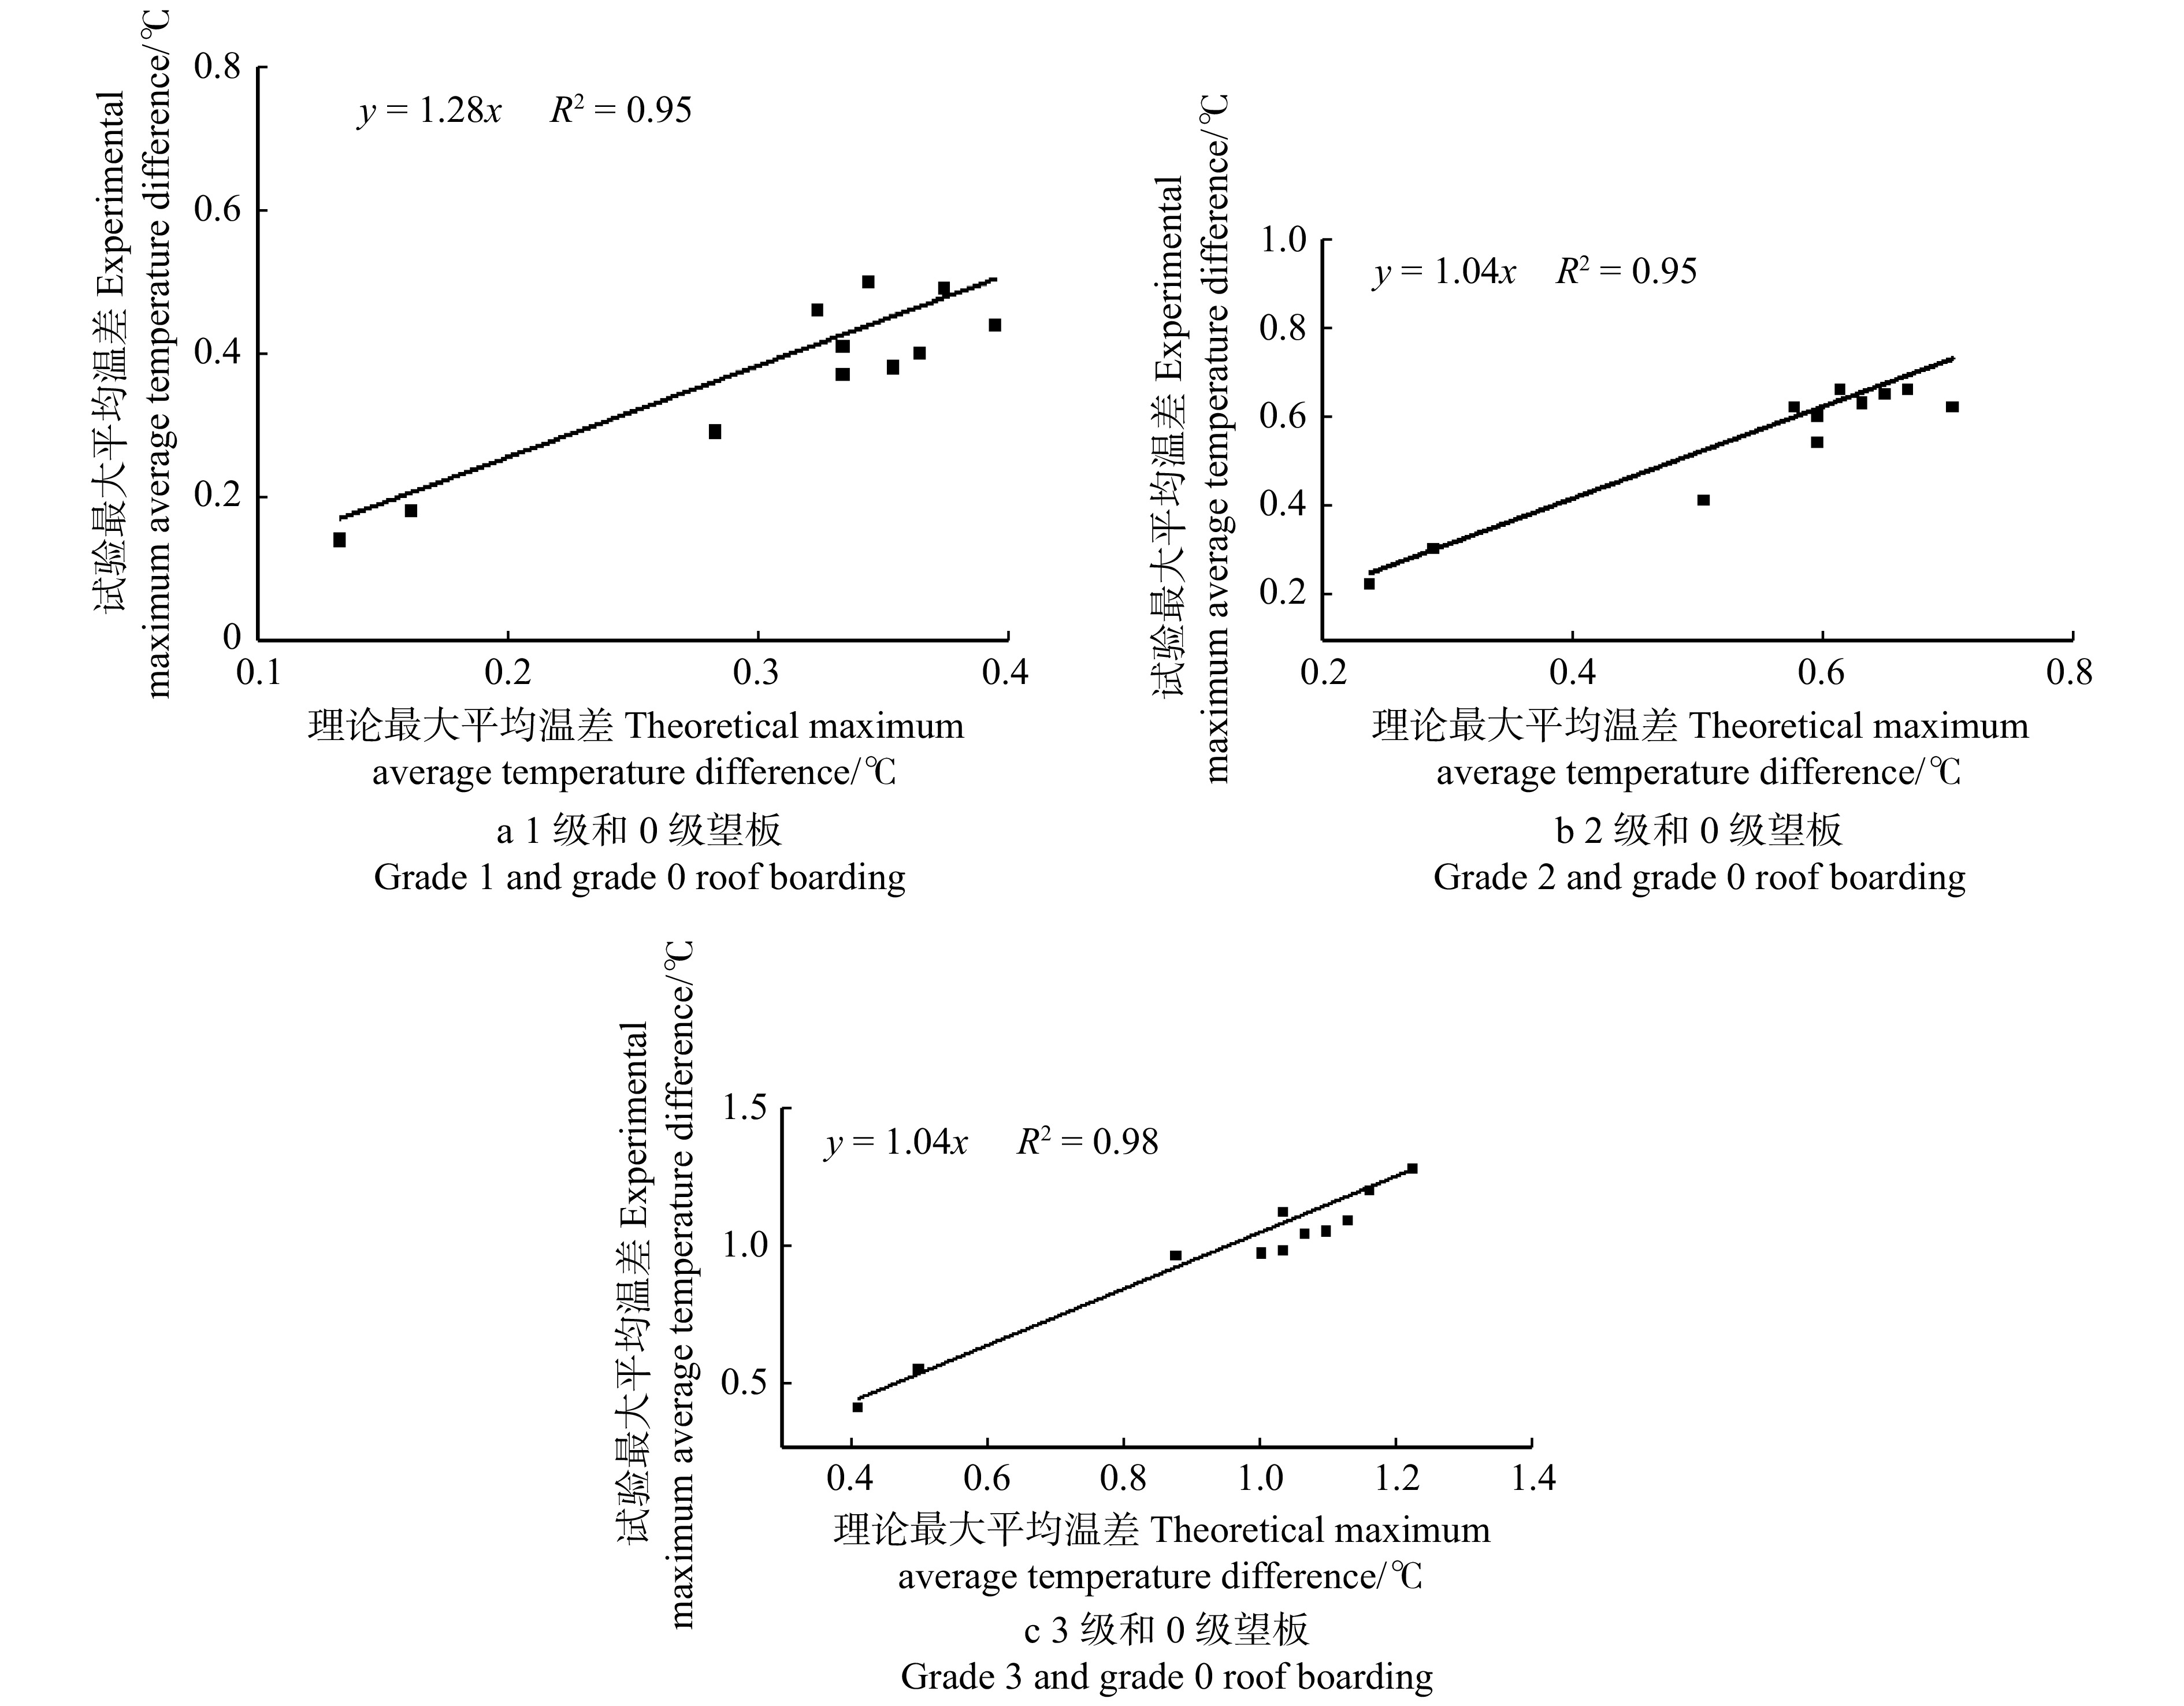
图 11 1级、2级、3级与0级望板内表面试验和理论最大平均温差
Figure 11. Experimental and theoretical maximum average temperature differences of internal surfaces of grade 1, grade 2, grade 3 and grade 0 roof boarding
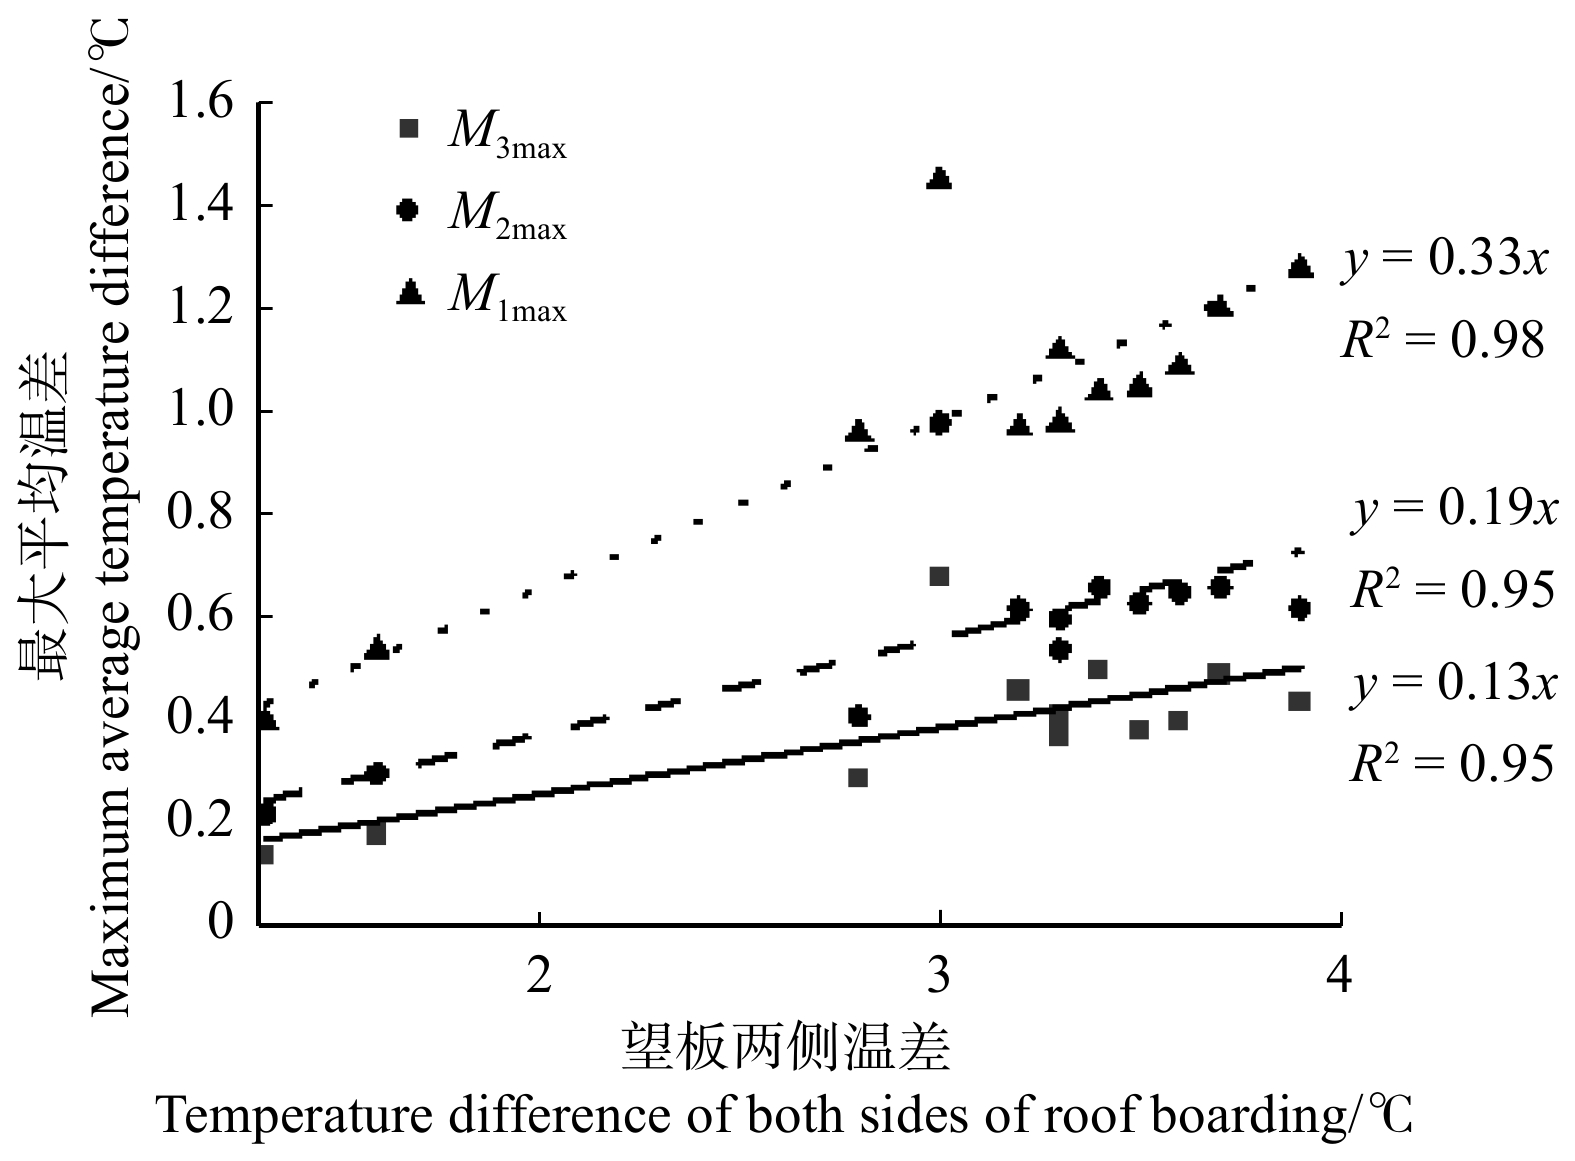
![]()
图 12 1级、2级、3级与0级望板内表面最大平均温差和望板两侧温差相关性图
M1max、M2max、M3max分别表示1级、2级、3级腐朽望板最大温差。M1max, M2max and M3max respectively represent the maximum temperature difference of the 1st, 2nd, and 3rd level decay roof boardings.
Figure 12. Correlation diagram of maximum average temperature differences of the internal surfaces of grade 1, grade 2, grade 3 and grade 0 roof boarding and temperature difference of both sides of the roof boarding
表 1 望板红外检测试件气干密度表
Table 1 Air-dry density of roof boarding specimens for infrared detection
kg/m3 编号
No.气干密度
Air-dry density编号
No.气干密度
Air-dry densityN1 654.5 W11 546.9 N2 642.3 W12 474.1 N3 642.3 W13 538.7 N4 648.2 W14 527.3 W1 552.7 W15 537.2 W2 501.5 W16 590.2 W3 463.4 W17 587.2 W4 549.4 W18 583.5 W5 523.8 W19 534.2 W6 485.6 W20 530.5 W7 573.3 W21 512.4 W8 495.4 W22 490.8 W9 425.1 W23 473.1 W10 571.5 W24 545.5 注:N1 ~ N4为新材木板试件编号,W1 ~ W24为腐朽望板试件编号。Notes: N1− N4 are the No.s of new roof boarding specimens, and W1 − W24 are the No.s of decay roof boarding specimens.  下载: 导出CSV
表 2 望板腐朽分级标准
Table 2 Grade standard for decay condition of roof boarding
阻力值降低率
Reduction rate of resistance value腐朽厚度
Decay depth腐朽等级
Decay grade0 0 0 1% ~ 18% 腐朽厚度1 ~ 2 mm Decay depth 1 − 2 mm 1 18% ~ 24% 外侧腐朽厚度2 ~ 5 mm,内侧厚度1 ~ 4 mm,横截面腐朽面积1/3 The external decay depth is
2−5 mm, internal depth 1−4 mm, cross section decay area accounts for 1/32 ≥ 24% 两侧厚度均5 mm以上,横截面腐朽面积2/3及以上 The depth of both sides is more than 5 mm, cross section decay area accounts for 2/3 or more 3
下载: 导出CSV
表 3 望板试件平均微钻阻力值和腐朽厚度测量结果
Table 3 Measurement results of average micro-drilling resistance value and decay thickness of roof boarding specimens
编号
No.平均微钻阻力值
Average micro-drill resistance value/rel阻力值降低率
Reduction rate of resistance value/%腐朽厚度
Decay depth/mm腐朽等级
Decay grade编号
No.平均微钻阻力值
Average micro-drill resistance value/rel阻力值降低率
Reduction rate of resistance value/%腐朽厚度
Decay depth/mm腐朽等级
Decay gradeN1 351.9 0 0 0 W11 273.4 19.8 6.0 2 N2 345.2 0 0 0 W12 247.5 27.4 16.5 3 N3 340.5 0 0 0 W13 268.8 21.1 7.0 2 N4 325.7 0 0 0 W14 267.2 21.6 7.1 2 W1 295.0 13.4 1.0 1 W15 260.9 23.5 8.3 2 W2 278.4 18.3 5.1 2 W16 290.8 14.7 1.0 1 W3 259.5 24.0 11.0 3 W17 284.2 16.6 1.5 1 W4 286.7 15.9 1.2 1 W18 281.8 17.3 1.8 1 W5 275.2 19.3 5.3 2 W19 258.6 24.1 11.6 3 W6 258.7 24.1 11.5 3 W20 256.8 24.7 11.8 3 W7 281.0 17.6 2.0 1 W21 255.5 25.0 12.0 3 W8 273.8 19.7 6.0 2 W22 251.5 26.2 12.7 3 W9 258.6 24.1 11.5 3 W23 247.2 27.5 15.3 3 W10 290.9 14.6 1.0 1 W24 270.4 20.7 6.5 2
下载: 导出CSV
表 4 比热容测量结果
Table 4 Specific heat capacity measurement results
编号
No.平均比热容
Average specific heat capacity/(J∙kg−1∙℃−1)标准偏差
Standard deviation变异系数
Coefficient of variation/%编号
No.平均比热容
Average specific heat capacity/(J∙kg−1∙℃−1)标准偏差
Standard deviation变异系数
Coefficient of variation/%N1 2 860.72 2.09 0.73 N3 2 714.75 2.96 1.09 W1 2 570.13 4.93 1.92 W7 2 640.92 4.44 1.68 W2 2 274.68 4.73 2.08 W8 2 030.68 5.36 2.64 W3 1 670.82 5.70 3.41 W9 1 478.25 5.63 3.81 N2 2 714.43 4.83 1.78 N4 2 723.31 4.55 1.67 W4 2 440.35 1.29 0.53 W10 2 637.27 1.27 4.81 W5 2 304.50 7.72 3.35 W11 2 405.74 10.71 4.45 W6 1 680.79 5.01 2.98 W12 1 658.50 3.35 2.02
下载: 导出CSV
表 5 不同腐朽程度望板理论最佳检测时间对比表
Table 5 Comparison of the optimal theory detection time of roof boarding with different decay degrees
腐朽等级
Decay grade编号
No.理论时间
Theoretical time/min腐朽等级
Decay grade编号
No.理论时间
Theoretical time/min腐朽等级
Decay grade编号
No.理论时间
Theoretical time/min1 W1 27 2 W2 25 3 W3 20 W4 25 W5 24 W6 19 W7 27 W8 22 W9 17 W10 27 W11 25 W12 18
下载: 导出CSV
表 6 不同腐朽程度望板和正常望板内表面理论和试验最大平均温差对比表
Table 6 Comparison of theoretical and experimental maximum average temperature differences of internal surfaces of normal roof boarding and roof boarding with different decay degrees
组号
Group No.编号
No.理论最大平均温差 Theoretical maximum average temperature difference/℃ 试验最大平均温差 Experiment maximum average temperature difference/℃ 相对偏差
Relative deviation/%1 W1 0.30 0.29 3.33 W2 0.54 0.51 5.56 W3 0.94 0.96 2.13 2 W4 0.38 0.39 2.63 W5 0.54 0.52 3.70 W6 1.09 0.98 10.09 3 W7 0.26 0.23 11.54 W8 1.00 0.89 11.00 W9 1.80 1.76 2.22 4 W10 0.47 0.44 6.38 W11 0.85 0.90 5.88 W12 1.92 2.09 8.85
下载: 导出CSV
-
[1] Costa A, Pitarma R. Performance evaluation of colour codes on thermal image analysis–application in the wood damage detection[J]. Lecture Notes in Networks and Systems, 2022, 468: 553−563.
[2] 高珊, 谢婉欣, 王立海, 等. 应用红外热像技术检测木材孔洞缺陷[J]. 林业科技开发, 2013, 27(5): 98−101. Gao S, Xie W X, Wang L H, et al. Detection of wood hole defects by infrared thermography[J]. Forestry Science and Technology Development, 2013, 27(5): 98−101.
[3] López G, Basterra L A, Ramón-Cueto G, et al. Detection of singularities and subsurface defects in wood by infrared thermography[J]. International Journal of Architectural Heritage, 2014, 8(4): 517−536. doi: 10.1080/15583058.2012.702369
[4] López G, Basterra L A, Acuña L. Infrared thermography for wood density estimation[J]. Infrared Physics & Technology, 2018, 89: 242−246.
[5] 王斐, 吴德军, 翟国锋, 等. 侧柏衰弱木和蛀干害虫受害木的热红外成像检测[J]. 光谱学与光谱分析, 2015, 35(12): 3410−3415. Wang F, Wu D J, Zhai G F, et al. Thermal infrared imaging detection of decayed wood of Platyclades orientalist and wood damaged by dry borers[J]. Spectroscopy and Spectral Analysis, 2015, 35(12): 3410−3415.
[6] Xin Z, Guan C, Zhang H, et al. Assessing the density and mechanical properties of ancient timber members based on the active infrared thermography[J]. Construction and Building Materials, 2021, 304(6): 124614.
[7] Martínez I, Martínez E. Qualitative timber structure assessment with passive IR thermography: case study of sources of common errors[J]. Case Studies in Construction Materials, 2022, 16: e00789. doi: 10.1016/j.cscm.2021.e00789
[8] 徐芝纶. 弹性力学[M]. 北京: 高等教育出版社, 1984: 1−2. Xu Z L. Elasticity[M]. Beijing: Higher Education Press, 1984: 1−2.
[9] 杨世铭, 陶文铨. 传热学[M]. 北京: 高等教育出版社, 2006: 117−118. Yang S M, Tao W Q. Heat transfer [M]. Beijing: Higher Education Press, 2006: 117−118.
[10] 全国木材标准化技术委员会. 古建筑木构件的非破坏性检测方法及腐朽分级: LY/T 2146—2013[S]. 北京: 中国标准出版社, 2013. National Technical Committee for Wood Standardization. Nondestructive testing method and decay classification of ancient building wood components: LY/T 2146−2013 [S]. Beijing: Standards Press of China, 2013.
[11] 成俊卿. 木材学[M]. 北京: 中国林业出版社, 1985: 489−490. Cheng J Q. Wood science[M]. Beijing: China Forestry Publishing House, 1985: 489−490.
[12] 中国国家标准化管理委员会. 木材密度测定方法: GB/T 1933—2009[S]. 北京: 中国标准出版社, 2009. China National Standardization Administration. Determination method of wood density: GB/T 1933−2009[S]. Beijing: Standards Press of China, 2009.
[13] 中国国家标准化管理委员会. 绝热稳态传热性质的测定标定和防护热箱法: GB/T 13475—2008[S]. 北京: 中国标准出版社, 2008: 3−12. China National Standardization Administration. Determination, calibration and protective hot box method of adiabatic steady-state heat Transfer properties: GB/T 13475−2008[S]. Beijing: Standards Press of China, 2008: 3−12.
[14] 阎金铎. 中国中学教学百科全书: 物理卷[M]. 沈阳: 沈阳出版社, 1990: 188−189. Yan J D. Encyclopedia of Chinese middle school teaching: physics volume[M]. Shenyang: Shenyang Publishing House, 1990: 188−189.
[15] 白敬晨, 于庆波, 胡贤忠, 等. 基于红外热像仪的物体表面发射率测量方法[J]. 东北大学学报(自然科学版), 2013, 34(12): 1747−1750. Bai J C, Yu Q B, Hu X Z, et al. Measurement method of object surface emissivity based on infrared thermal imager[J]. Journal of Northeast University (Natural Science Edition), 2013, 34(12): 1747−1750.
[16] Madding R P. Emissivity measurement and temperature correction accuracy considerations[J]. Proceedings of SPIE-The International Society for Optical Engineering, 1999, 3700: 393−401.
[17] López G, Basterra L A, Acuña L, et al. Determination of the emissivity of wood for inspection by infrared thermography[J]. Journal of Nondestructive Evaluation, 2013, 32(2): 172−176. doi: 10.1007/s10921-013-0170-3
[18] 黄荣凤, 王晓欢, 李华, 等. 古建筑木材内部腐朽状况阻力仪检测结果的定量分析[J]. 北京林业大学学报, 2007, 29(6): 167−171. Huang R F, Wang X H, Li H, et al. Quantitative analysis of resistance meter test results of internal decay of ancient building wood[J]. Journal of Beijing Forestry University, 2007, 29(6): 167−171.
[19] 彭林, 周浩宇, 张厚江, 等. 金中都水关遗址木结构无损检测与评估[J]. 北京林业大学学报, 2022, 44(11): 140−151. Peng L, Zhou H Y, Zhang H J, et al. Nondestructive testing and evaluation of wooden structures at the Shuiguan Site in Jinzhong City[J]. Journal of Beijing Forestry University, 2022, 44(11): 140−151.
[20] 于永柱, 管成, 张厚江, 等. 古建筑墙体木柱缺陷对其安全性影响数值模拟研究[J]. 北京林业大学学报, 2022, 44(1): 132−145. Yu Y Z, Guan C, Zhang H J, et al. Numerical simulation study on the safety impact of wooden column defects on ancient building walls[J]. Journal of Beijing Forestry University, 2022, 44(1): 132−145.
[21] 时小龙, 王立海, 徐华东, 等. 基于阻抗仪和ERT技术的红松内部腐朽定量检测[J]. 北京林业大学学报, 2017, 39(9): 102−111. Shi X L, Wang L H, Xu H D, et al. Quantitative detection of Korean pine internal decay based on impedance meter and ERT technology[J]. Journal of Beijing Forestry University, 2017, 39(9): 102−111.
[22] 李华, 石志敏, 张晓芳, 等. 无损检测技术在故宫古建筑木结构材质勘查中的应用[C]//郑欣淼, 晋宏逵. 中国紫禁城学会论文集(第六辑下). 北京: 紫禁城出版社, 2007: 200−209. Li H, Shi Z M, Zhang X F, et al. Application of non-destructive testing technology in the investigation of wood structure materials of ancient buildings in the Forbidden City[C]//Zheng X M, Jin H K. Collected Papers of the Chinese Forbidden City Society (Part 6: Part 2). Beijing: Forbidden City Publishing House, 2007: 200−209.
[23] 施冬梅, 游毓聪, 鲁彦玲. 红外隐身涂料发射率影响因素研究[J]. 涂料工业, 2008, 38(11): 22−24. Shi D M, You Y C, Lu Y L. Study on the factors influencing the emissivity of infrared stealth coatings[J]. Paint Industry, 2008, 38(11): 22−24.
[24] 中国国家标准化管理委员会. 民用建筑热工设计规范: GB/T 50176—2016[S]. 北京: 中国标准出版社, 2016. China National Standardization Administration. Code for thermal design of civil buildings: GB/T 50176−2016[S]. Beijing: Standards Press of China, 2016.
-
期刊类型引用(9)
1. 刘婧岩. 林龄对秃杉人工林土壤碳氮储量的影响. 林业科技情报. 2025(01): 13-15 .  百度学术
百度学术
2. 张莉,郭龙欣,张铭洋,李小娟,赵亮,杨永胜. 青海湖高寒草原植被群落结构和水源涵养功能对禁牧封育的响应. 西北植物学报. 2024(09): 1488-1498 . 百度学术
3. 宁婷,张定海,赵有益,江晶. 腾格里沙漠土壤水分含量与地形、植被的关系. 中国沙漠. 2024(05): 133-142 . 百度学术
4. 党毅,王维,张永娥,王渝淞,丁兵兵,樊登星,贾国栋,余新晓,董俊杰. 坝上高原不同植被类型覆盖下土壤水分含量对降雨的动态响应. 北京林业大学学报. 2023(05): 106-118 . 本站查看
5. 徐爽,阚雨晨. 不同肥力水平的土壤紧实度与含水量的相关度分析. 中国农学通报. 2022(36): 94-100 . 百度学术
6. 宋强,夏可,杨斌,方兵,周鹏飞,庄红娟,陈弘扬,张世文. 旱作区典型土类穿透阻力分布特征及耕层厚度确定. 水土保持学报. 2021(03): 369-377 . 百度学术
7. 杜田甜,孙向阳,李素艳,周伟,郑燚,范志辉. 园林绿化废弃物覆盖对城市绿地土壤肥力影响. 北京林业大学学报. 2021(10): 110-117 . 本站查看
8. 王醒,方荣杰,张帅普,黄卉,黄朗,吴忠军. 广西龙脊梯田区森林类型对土壤水力特性的影响. 水土保持通报. 2021(05): 92-98+106 . 百度学术
9. 杨洪炳,肖以华,李明,许涵,史欣,郭晓敏. 典型城市森林旱季土壤团聚体稳定性与微生物胞外酶活性耦合关系. 生态环境学报. 2021(10): 1976-1989 . 百度学术
其他类型引用(13)


计量
- 文章访问数: 374
- HTML全文浏览量: 255
- PDF下载量: 85
- 被引次数: 22
