
Geographical variations of functional traits of typical tree species in northeastern China
-
摘要:目的以东北林区典型喜光树种和耐阴树种为对象,探讨功能性状沿地理梯度的变化格局及其成因,为科学预测典型树种对未来环境变化的响应和适应策略提供依据。方法利用标准化主轴回归法检验树高、比叶面积、木质密度3个性状的种内关联性;采取偏相关分析法计算功能性状与气候因子之间的关系。结果树高、比叶面积和木质密度3个性状在种内没有显著的关联性。植物性状的地理分布格局随树种而变化,白桦、水曲柳、色木槭的树高随经度增加而减小;山杨、水曲柳和色木槭的树高随纬度增加而减小;白桦和水曲柳的树高随海拔增加而增大。白桦和山杨的比叶面积随经度增加而减小,水曲柳和色木槭的比叶面积随经度增加而增大;白桦、山杨、水曲柳的比叶面积随纬度增加而增大。色木槭的木质密度随经度增加而增大;蒙古栎的木质密度随纬度增加而减小。植物性状与气候因子关系分析显示,白桦的树高与年均温度显著负相关,白桦、山杨、蒙古栎、水曲柳、红松的树高与年降水量显著正相关;白桦的比叶面积与年降水量显著负相关,蒙古栎、山杨和水曲柳的比叶面积与年均温度显著负相关;蒙古栎的木质密度与年均温度显著正相关,色木槭的木质密度则与年均温度显著负相关。结论功能性状地理格局及其环境驱动机制随着树种变化而变化。总体上,树高和比叶面积分别受降水和温度的影响;木质密度相对稳定,受气候因子影响不显著。Abstract:ObjectiveBy taking typical shade-intolerant and shade-tolerant tree species in northeastern China as objects, this study discusses the changing pattern of functional traits along geographic gradient and the underlying causes, which could provide scientific support for predicting the response and adaptation strategies of typical tree species to future environmental changes.MethodMethod of standardized major axis regression was applied to examine the intraspecific correlation among tree height, specific leaf area and wood density; and method of partial correlation analysis was applied to analyze the relationship between functional traits and climatic factors.ResultThere was no significant intraspecific correlation among tree height, specific leaf area and wood density. The geographical distribution pattern of plant traits changed with tree species, the height of Betula platyphylla, Fraxinus mandshurica and Acer pictum decreased with the increase of longitude; the height of Populus davidiana, Fraxinus mandshurica and Acer pictum decreased with the increase of latitude; the height of Betula platyphylla and Fraxinus mandshurica increased with elevation. The specific leaf area of Betula platyphylla and Populus davidiana decreased with increasing longitude, while that of Fraxinus mandshurica and Acer pictum increased with increasing longitude; the specific leaf area of Betula platyphylla, Populus davidiana and Fraxinus mandshurica increased with latitude. The wood density of Acer pictum increased with longitude, while that of Quercus mongolica decreased with latitude. The relationship between plant traits and climatic factors showed that the tree height of Betula platyphylla was negatively correlated with annual mean temperature, and the tree height of Betula platyphylla, Populus davidiana, Quercus mongolica, Fraxinus mandshurica and Pinus koraiensis was positively correlated with annual precipitation; the specific leaf area of Betula platyphylla was negatively correlated with annual precipitation, while that of Quercus mongolica, Populus davidiana and Fraxinus mandshurica was negatively correlated with annual mean temperature; The wood density of Quercus mongolica had significant positive correlation with annual mean temperature, while the wood density of Acer pictum was negatively correlated with the annual mean temperature.ConclusionGeographical patterns of functional traits and their underlying environmental driving mechanisms vary with tree species. In summary, tree height and specific leaf area are separately affected by precipitation and temperature; wood density is relatively stable, which is not significantly affected by climatic factors.
-
植物群落对全球变化响应与适应是植物功能性状领域的重要发展方向[1]。“植物功能性状”是指对植物体定植、存活、生长和死亡存在潜在影响的一系列植物属性,这些属性能够单独或联合指示生态系统对环境变化的响应,并且能够对生态系统过程产生强烈影响[2-3]。自20世纪末“功能性状”一词出现以来[4],大量生态学关键问题从功能性状研究中得到解答。树高和比叶面积是体现物种生存策略的两个重要性状[5]。树高是物种生态策略的重要组分和物种碳获取能力的关键,不仅表征了物种对光的竞争能力,而且与比叶面积等其他性状密切关联[6]。比叶面积反映了植物从外界获取资源的能力,比叶面积低的植物能更好地适应资源贫瘠和干旱环境,比叶面积高的植物保持体内营养的能力相对较强[7];比叶面积通常与相对生长速率或最大光合速率显著正相关[2]。在同一个体或群落内,一般受光越弱比叶面积则越大,因此比叶面积可作为叶遮荫度指标来使用[8]。木质密度综合反映了树木的生活史和生理策略,与直径增长率、死亡率、繁殖时间、茎干含水量、相对机械强度等紧密相关[9]。
植物功能性状在不同植被类型之间存在明显差异[10]。在全球尺度或大尺度范围内,植物功能性状随经纬度和海拔梯度的地理变异,主要源自温度、降水等气候因子的梯度变化[11]。例如,随着降水量减少植物叶片会变厚和革质化[12]、单位叶面积磷含量增加[13]。此外植物功能性状的地理变异也受研究范围和研究对象影响[14-15]。本文以东北林区中生态策略具有显著差异的具有代表性的喜光树种和耐阴树种为对象,研究树高、比叶面积和木质密度的种内变异幅度,结合气候因子探讨植物功能性状的地理梯度格局及其成因,旨在为预测物种应对环境变化的适应潜力提供科学依据。
1. 研究地点及研究方法
1.1 研究地点
研究区位于大小兴安岭、张广才岭、老爷岭、长白山、哈达岭、龙岗山脉,横跨寒温带、温带、暖温带3个气候区。气候四季分明,冬季寒冷漫长,夏季温暖短促。研究区域内年均温度和年降水量具有显著的地理变异性,随经度增加而增大,随纬度增加而减小;年均温度和年降水量显著正相关,属于典型的雨热同期气候特征(表1)。植被类型以寒温带兴安落叶松(Larix gmelinii)林、温带针阔混交林、暖温带落叶阔叶林为主。研究对象为本次野外调查的优势种,包括喜光树种:白桦(Betula platyphylla) 、山杨(Populus davidiana)、蒙古栎(Quercus mongolica);耐阴树种:紫椴(Tilia amurensis)、水曲柳(Fraxinus mandschurica)、色木槭(Acer pictum)、红松(Pinus koraiensis)。基本信息见表2。
表 1 环境因子间关系Table 1. Relationship among environmental factors项目 Item 经度 Latitude 纬度 Longitude 海拔 Altitude MAT MAR MAT 0.237*** − 0.812*** − 0.386*** 0.580*** MAR 0.394*** − 0.822*** 0.121* 0.580*** 注:MAT为年均温度,MAR为年降水量;*代表P < 0.05水平上相关性显著,**代表P < 0.01水平上相关性显著,***代表P < 0.001水平上相关性显著。下同。Notes: MAT, average annual temperature; MAR, annual precipitation; * represents significant correlation at P < 0.05 level, ** represents significant correlation at P < 0.01 level, *** represents significant correlation at P < 0.001 level. The same below. 表 2 中国东北部7个典型树种的树高、比叶面积及木质密度Table 2. Tree height, specific leaf area and wood density of 7 typical tree species in northeastern China树种
Tree species样本数
Sample number树高
Height (H)/m比叶面积
Specific leaf area (SLA)/
(cm2·g− 1)木质密度
Wood density (D)/
(g·cm− 3)均值 Mean SD 均值 Mean SD 均值 Mean SD 白桦 Betula platyphylla 130 13.7a 5.1 50.3c 19.6 0.497 4d 0.057 4 山杨 Populus davidiana 58 12.7a 5.2 35.7e 15.7 0.403 5e 0.044 4 蒙古栎 Quercus mongolica 157 13.7a 5.3 44.5d 22.7 0.666 0b 0.172 0 紫椴 Tilia amurensis 142 13.9a 5.4 64.2b 19.0 0.379 3e 0.077 7 水曲柳 Fraxinus mandschurica 61 13.7a 6.6 95.7a 36.1 0.594 3c 0.090 3 色木槭 Acer pictum 78 13.4a 5.4 58.5b 13.1 0.675 5a 0.269 9 红松 Pinus koraiensis 61 12.1a 4.9 0.418 6e 0.086 1 注:SD为标准差;不同树种各性状的均值采用 t 检验方法进行比较,同列中不同字母代表差异显著(P < 0.05)。Notes: SD is standard deviation, means with the same letter are not significantly different at P < 0.05 level using t-test among different tree species. 1.2 研究方法
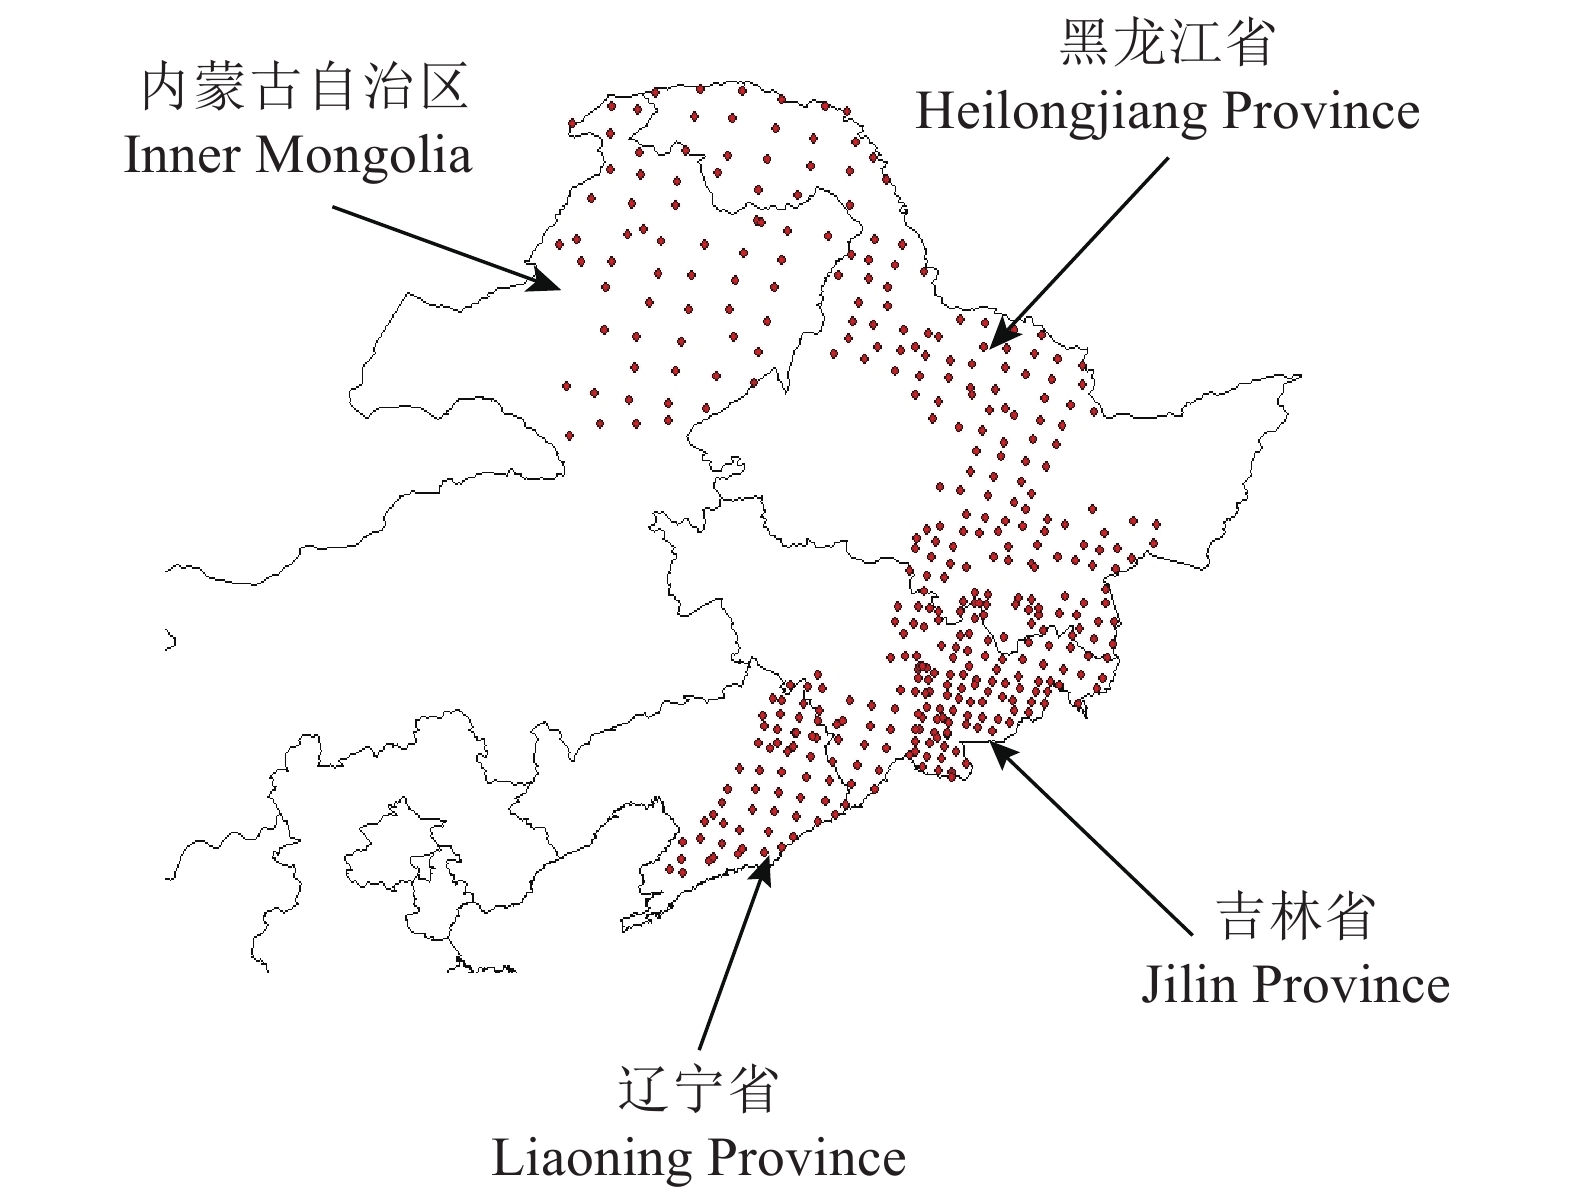
2017—2018年采取分区布点法在研究区内布设了445个取样点(图1),地理坐标为39°33ʹ ~ 53°33ʹN,118°19ʹ ~ 131°26ʹE,海拔79 ~ 1 255 m。在每个取样点上设立一个面积1 000 m2(半径r = 17.85 m)的圆形样地,测量样地中胸径 ≥ 5 cm树木的胸径和树高。在控制点架设罗盘仪,调平、定正北向,顺时针依次测定胸径 ≥ 5 cm个体,用勃鲁莱测高仪对目标树种进行树高测量并记录。将样地中每个树种最高5株树的平均高作为该树种的优势高。每个树种选取3 ~ 5株胸径在10 ~ 30 cm的树木钻取树芯,进钻位置处于树干北侧1.3 m处,避开疤结或其他异常树皮,入钻深度达到髓心或超过髓心2 ~ 3 cm即可。利用游标卡尺现场测定树芯长度(精度0.1 cm)和直径(精度0.01 mm)。将树芯带回实验室烘干称质量,计算树芯的木质密度(即干质量/体积)。每个阔叶树种选择一株具有代表性的个体进行取样,摘取叶片数为50 ~ 100片,带回实验室扫描叶面积,之后烘干称质量,计算比叶面积(即平均叶面积与平均干物质质量的比值)。鉴于针叶树种叶片的特殊性,本研究未测定和分析红松的叶性状属性。不同树种各性状间的相关关系利用标准化主轴回归[16]法进行分析;性状在地理梯度上的变异规律采用线性回归拟合;性状与气候因子间的关系采用偏相关分析法进行计算。
![]() 图 1 取样点地理空间分布地理坐标:39°33ʹ ~ 53°33ʹN,118°19ʹ ~ 131°26ʹE Geographical coordinates: 39°33ʹ−53°33ʹN, 118°19ʹ−131°26ʹEFigure 1. Location of the research sites
图 1 取样点地理空间分布地理坐标:39°33ʹ ~ 53°33ʹN,118°19ʹ ~ 131°26ʹE Geographical coordinates: 39°33ʹ−53°33ʹN, 118°19ʹ−131°26ʹEFigure 1. Location of the research sites2. 结果与分析
2.1 不同功能性状间的关系
利用标准化主轴回归检验7个典型树种的比叶面积(SLA)、木质密度(D)以及树高(H)之间的关系。研究结果显示,比叶面积与树高、比叶面积与木质密度、树高与木质密度之间不存在显著相关性(P > 0.05),并且所有标准化主轴回归分析的决定系数R2值均低于0.04(表3)。因此,比叶面积、木质密度以及树高之间不存在权衡关系。
表 3 典型树种不同性状间标准化主轴回归分析Table 3. Standardized major axis regression between different tree traits树种
Tree species样本数
Sample numberSLA−H SLA−D H−D 斜率 Slope R2 斜率 Slope R2 斜率 Slope R2 白桦 Betula platyphylla 130 0.9 0.018 3.5 0.020 − 4.0 0.000 山杨 Populus davidiana 58 0.7 0.005 2.9 0.020 4.2 0.026 蒙古栎 Quercus mongolica 157 0.8 0.001 2.0 0.002 − 2.4 0.010 紫椴 Tilia amurensis 142 − 0.7 0.000 1.7 0.008 2.4 0.002 水曲柳 Fraxinus mandschurica 61 − 0.9 0.000 3.5 0.038 3.8 0.017 色木槭 Acer pictum 78 0.5 0.001 − 1.0 0.003 − 1.7 0.008 红松 Pinus koraiensis 61 0.2 0.003 注:SLA、H、D分别为比叶面积、树高、木质密度。Notes: SLA, H and D are specific leaf area, tree height and wood density, respectively. 2.2 植物功能性状与地理因子间关系
不同树种的树高随着经纬度和海拔梯度的变化规律不同(图2)。白桦、水曲柳和色木槭的树高与经度呈显著线性负相关,树高值随经度的增加而减小。山杨、水曲柳和色木槭的树高与纬度呈显著线性负相关,树高值随纬度的增加而减小。白桦和水曲柳的树高与海拔呈显著线性正相关,树高值随海拔的增加而增大。
![]() 图 2 典型树种树高在地理环境上的变化规律H:树高Height;E:海拔ElevationFigure 2. Variations of dominant tree height in geographical environment
图 2 典型树种树高在地理环境上的变化规律H:树高Height;E:海拔ElevationFigure 2. Variations of dominant tree height in geographical environment比叶面积与经纬度和海拔梯度之间的关系随树种而变化(图3)。白桦、山杨、水曲柳和色木槭的比叶面积与经度之间存在显著线性相关;白桦和山杨的比叶面积值随经度增加而减小,水曲柳和色木槭的比叶面积值随经度增加而增大。白桦、山杨、水曲柳的比叶面积与纬度呈显著线性正相关,比叶面积值随纬度增加而增大。7个典型树种的比叶面积在海拔梯度上不存在明显的变化趋势。
![]() 图 3 典型树种比叶面积(SLA)的地理变异趋势Figure 3. Variations of specific leaf area (SLA) in dominant species in geographical environment
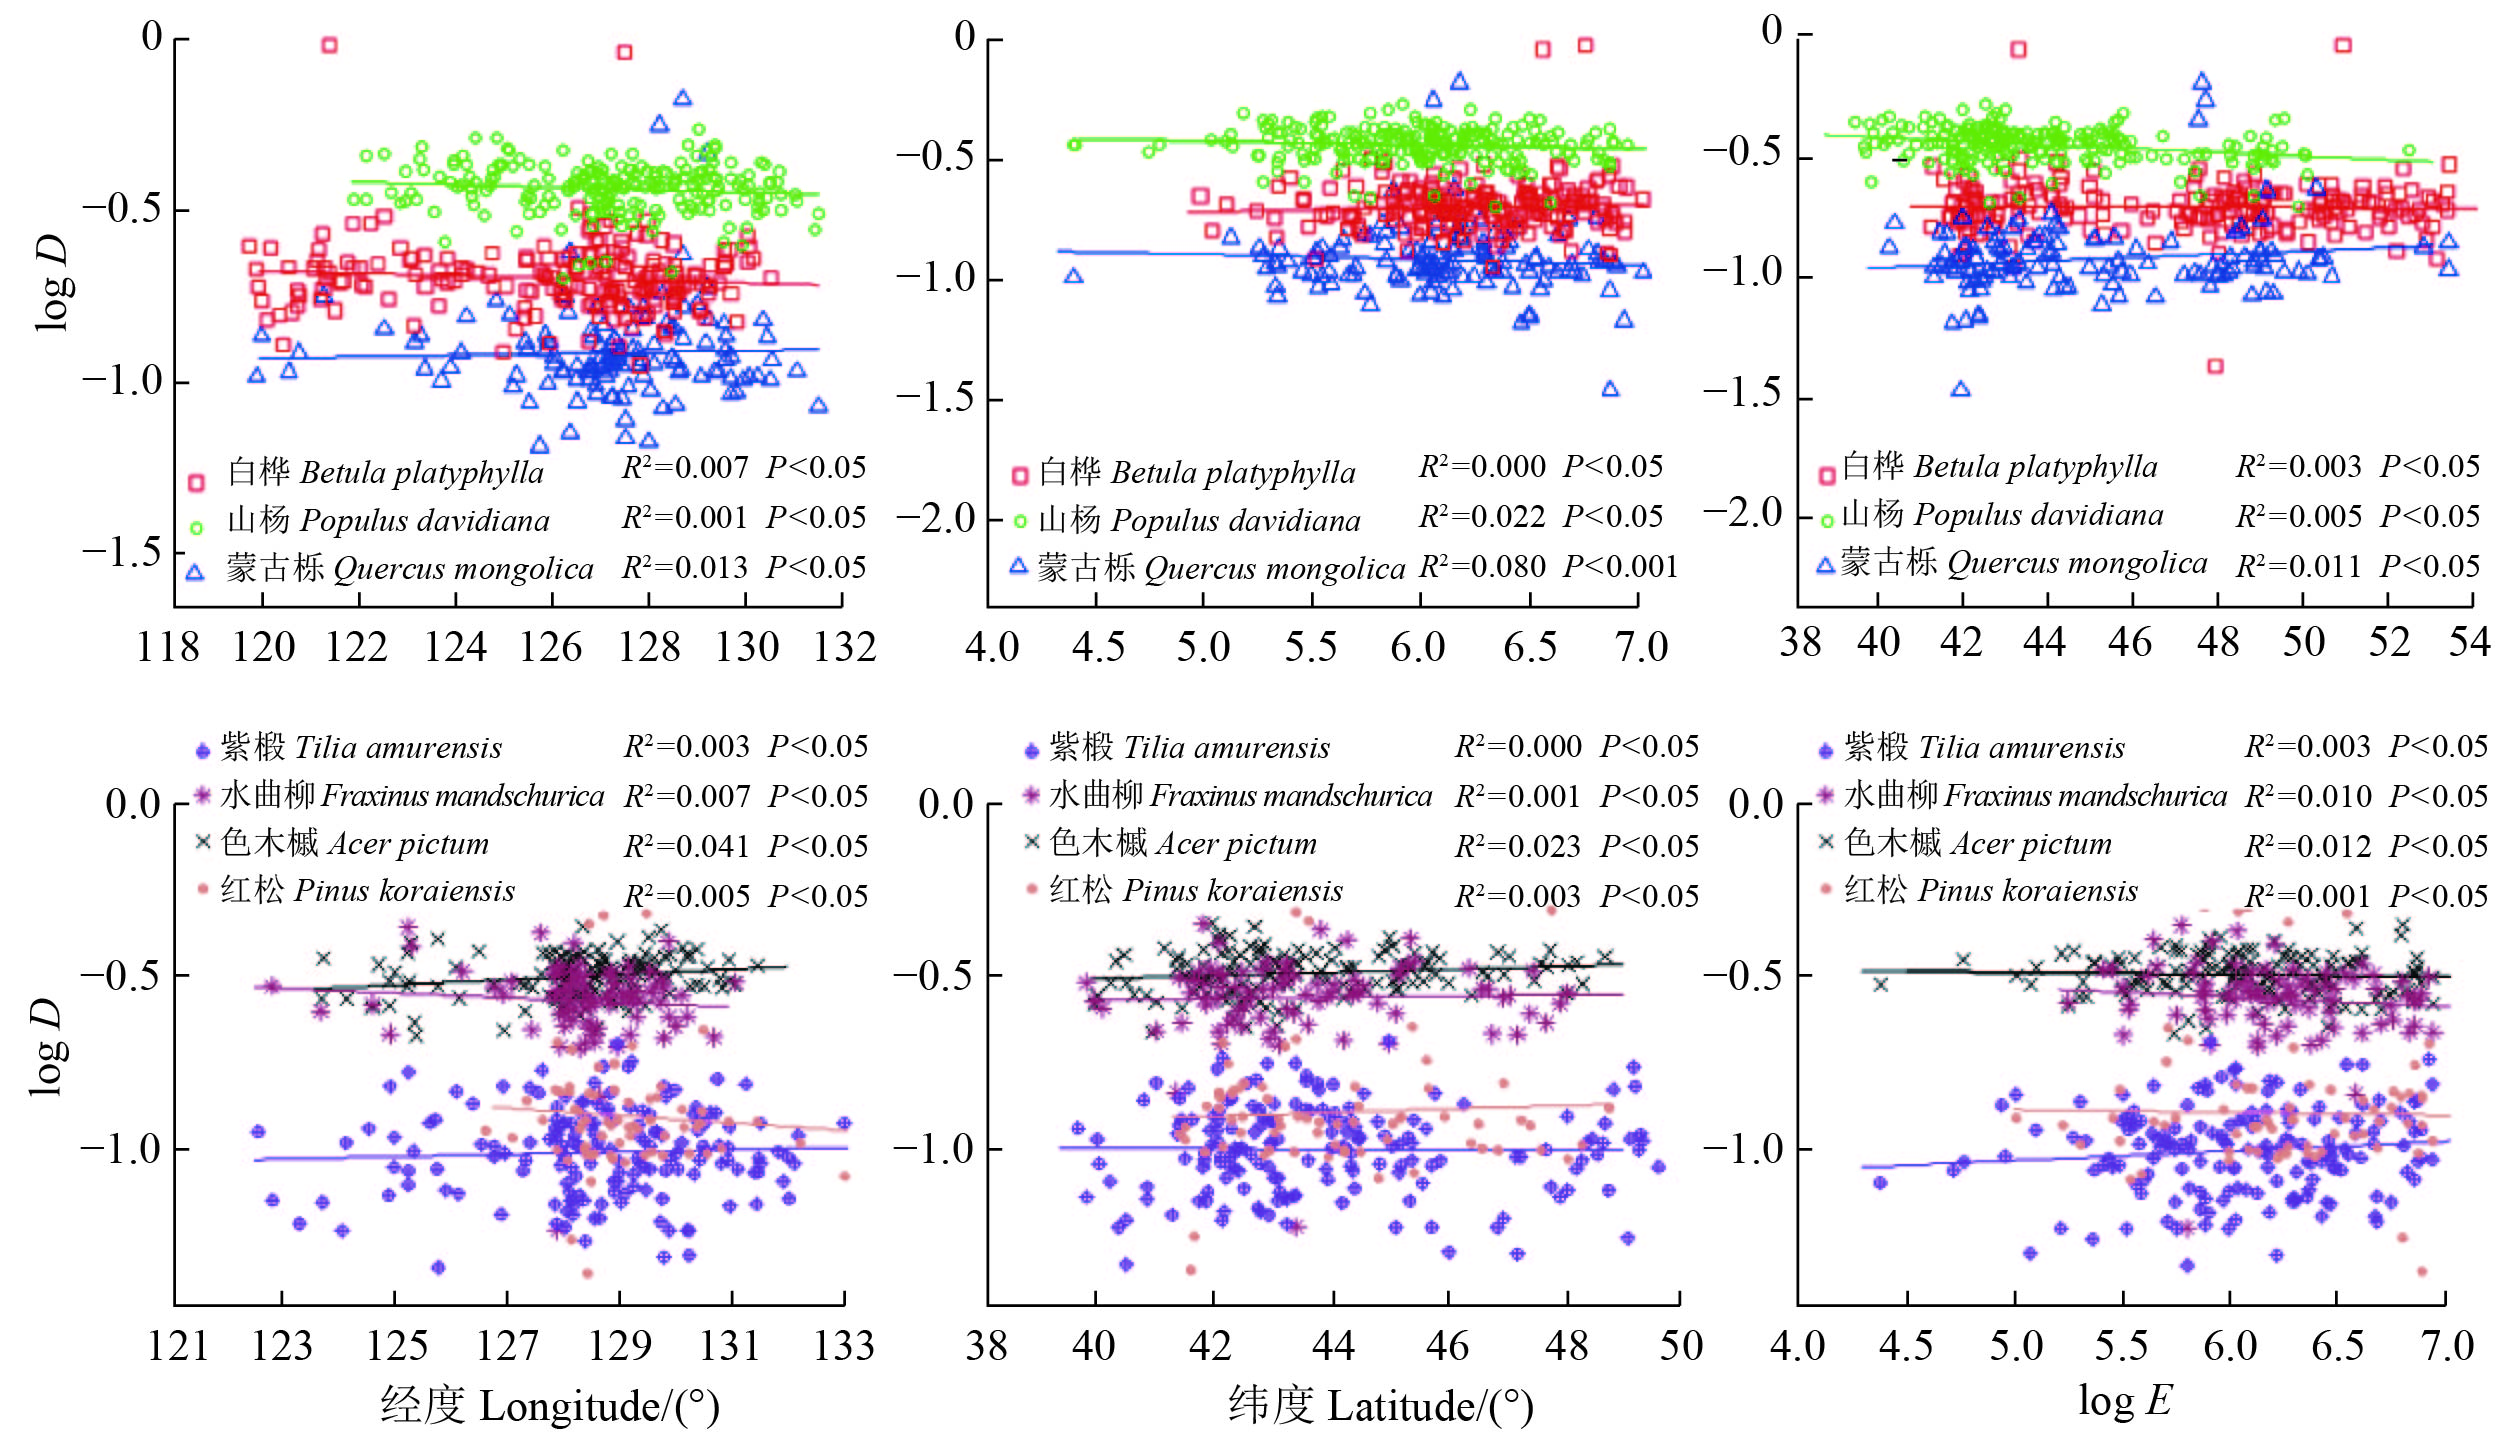
图 3 典型树种比叶面积(SLA)的地理变异趋势Figure 3. Variations of specific leaf area (SLA) in dominant species in geographical environment木质密度随经纬度和海拔梯度变化规律研究显示,色木槭的木质密度与经度呈显著线性正相关,木质密度值随经度的增加而增大;蒙古栎的木质密度与纬度呈显著线性负相关,木质密度值随纬度的增加而减小。所有树种的木质密度在海拔梯度上均未表现出明显的变化趋势(图4)。
![]() 图 4 典型树种木质密度(D)在地理环境上变化规律Figure 4. Variations of wood density (D) in dominant species in geographical environment
图 4 典型树种木质密度(D)在地理环境上变化规律Figure 4. Variations of wood density (D) in dominant species in geographical environment2.3 植物功能性状与气候因子间关系
白桦的比叶面积与年降水量显著负相关,蒙古栎、山杨和水曲柳的比叶面积与年均温度显著负相关。白桦的树高与年均温度显著负相关,白桦、山杨、蒙古栎、水曲柳、红松的树高与年降水量显著正相关。蒙古栎的木质密度与年均温度显著正相关,色木槭的木质密度则与年均温度显著负相关(表4)。
表 4 典型树种功能性状与气候因子偏相关分析Table 4. Partial correlation analysis between functional traits and climatic factors of dominant tree species树种 Tree species log(SLA) logH logD MAT MAR MAT MAR MAT MAR 白桦 Betula platyphylla − 0.009 − 0.16* − 0.178* 0.161* − 0.005 − 0.007 山杨 Populus davidiana − 0.312** − 0.151 0.019 0.292*** − 0.025 0.043 蒙古栎 Quercus mongolica − 0.164* 0.062 − 0.035 0.260*** 0.176** − 0.008 紫椴 Tilia amurensis − 0.019 0.060 − 0.037 0.132 0.117 0.009 水曲柳 Fraxinus mandschurica − 0.384*** − 0.052 0.168 0.344*** − 0.026 − 0.117 色木槭 Acer pictum − 0.085 − 0.021 0.149 0.122 − 0.26** 0.096 红松 Pinus koraiensis 0.052 0.263* − 0.078 − 0.100 3. 结论与讨论
在植物与环境的长期协同进化过程中,不同植物区系的多种功能性状之间相互关联,从而产生相似的性状格局,比如木质密度、比叶面积等植物性状的构建成本与叶寿命、木材或叶片的组织强度之间存在权衡关系[17-18]。Wright等[19]检验了新热带森林中2 134种木本植物的7种功能性状关联性,发现叶片大小与木质密度呈负相关关系,树高和木质密度之间不存在显著相关性。本文中全部7个树种的功能性状间都没有检验到显著的相关性,潜在原因可能是本研究尺度较大,样方分布范围较广,小生境差异大,导致较大尺度上性状间不存在权衡。大量研究表明在小尺度或局地环境中,地形因子和土壤因子对性状的分布起决定性作用[11]。
Moles等[20]对比全球7 084种植物在不同分布区的最大树高数据,发现赤道15°范围内的平均最大树高是北纬60° ~ 75°平均最大树高的29倍、南纬45° ~ 60°的31倍。本文中喜光树种山杨和耐阴树种水曲柳、色木槭的树高随着纬度的增加而减小,这与上述研究结果基本一致。偏相关分析显示大多数树种的树高与年降水量显著正相关,因此年降水量是影响中国东北部典型树种树高的主导因子。
全球2 500多种维管束植物研究显示,在气温越高、太阳辐射越强的地区,植物单位面积的叶片质量越高,即比叶面积越低[14]。中国东部森林植物比叶面积纬度格局分析显示,比叶面积随着纬度升高而逐渐增大[21],且已有研究表明植物叶性状随气候的变化主要由温度驱动,降水所起的作用相对较弱[22]。本文中喜光树种白桦和山杨以及耐阴树种水曲柳的比叶面积均随纬度增加而增大,且山杨和水曲柳的比叶面积与年均温度显著负相关,这在一定程度上验证了上述研究结果。在全球温度持续上升的背景下,未来阔叶树种可能趋向于以更小的比叶面积来应对高温引起的水分蒸发问题,进而引发一系列的生理策略改变。
Swenson等[9]发现木质密度具有显著的纬度格局,均值和方差随着纬度梯度逐渐减小。本文中只有喜光树种蒙古栎的木质密度表现出随纬度增加而下降的趋势。在全球“宏观生态尺度”上,木材密度与温度之间存在正相关关系[9]。蒙古栎的木质密度与年均温度显著正相关,而色木槭的木质密度与年均温度显著负相关,体现了不同树种的木质密度在生态策略上的差异。以往研究也报道过类似现象,不耐干旱的树种通常以较低的木质密度在茎中储存水分[23],耐干旱的植物通常具有较低的比叶面积和较高的木质密度[12,24]。植物性状沿环境梯度的变异来源主要产生于种间变异,而种内变异影响相对较小[25]。本研究中绝大多数树种的木质密度在经纬度和海拔梯度上没有显著变化,这表明本研究所选树种木质密度相对稳定、种内变异较小。
-
![]()
图 1 取样点地理空间分布
地理坐标:39°33ʹ ~ 53°33ʹN,118°19ʹ ~ 131°26ʹE Geographical coordinates: 39°33ʹ−53°33ʹN, 118°19ʹ−131°26ʹE
Figure 1. Location of the research sites
![]()
图 2 典型树种树高在地理环境上的变化规律
H:树高Height;E:海拔Elevation
Figure 2. Variations of dominant tree height in geographical environment
![]()
图 3 典型树种比叶面积(SLA)的地理变异趋势
Figure 3. Variations of specific leaf area (SLA) in dominant species in geographical environment
![]()
图 4 典型树种木质密度(D)在地理环境上变化规律
Figure 4. Variations of wood density (D) in dominant species in geographical environment
表 1 环境因子间关系
Table 1 Relationship among environmental factors
项目 Item 经度 Latitude 纬度 Longitude 海拔 Altitude MAT MAR MAT 0.237*** − 0.812*** − 0.386*** 0.580*** MAR 0.394*** − 0.822*** 0.121* 0.580*** 注:MAT为年均温度,MAR为年降水量;*代表P < 0.05水平上相关性显著,**代表P < 0.01水平上相关性显著,***代表P < 0.001水平上相关性显著。下同。Notes: MAT, average annual temperature; MAR, annual precipitation; * represents significant correlation at P < 0.05 level, ** represents significant correlation at P < 0.01 level, *** represents significant correlation at P < 0.001 level. The same below.  下载: 导出CSV
表 2 中国东北部7个典型树种的树高、比叶面积及木质密度
Table 2 Tree height, specific leaf area and wood density of 7 typical tree species in northeastern China
树种
Tree species样本数
Sample number树高
Height (H)/m比叶面积
Specific leaf area (SLA)/
(cm2·g− 1)木质密度
Wood density (D)/
(g·cm− 3)均值 Mean SD 均值 Mean SD 均值 Mean SD 白桦 Betula platyphylla 130 13.7a 5.1 50.3c 19.6 0.497 4d 0.057 4 山杨 Populus davidiana 58 12.7a 5.2 35.7e 15.7 0.403 5e 0.044 4 蒙古栎 Quercus mongolica 157 13.7a 5.3 44.5d 22.7 0.666 0b 0.172 0 紫椴 Tilia amurensis 142 13.9a 5.4 64.2b 19.0 0.379 3e 0.077 7 水曲柳 Fraxinus mandschurica 61 13.7a 6.6 95.7a 36.1 0.594 3c 0.090 3 色木槭 Acer pictum 78 13.4a 5.4 58.5b 13.1 0.675 5a 0.269 9 红松 Pinus koraiensis 61 12.1a 4.9 0.418 6e 0.086 1 注:SD为标准差;不同树种各性状的均值采用 t 检验方法进行比较,同列中不同字母代表差异显著(P < 0.05)。Notes: SD is standard deviation, means with the same letter are not significantly different at P < 0.05 level using t-test among different tree species.
下载: 导出CSV
表 3 典型树种不同性状间标准化主轴回归分析
Table 3 Standardized major axis regression between different tree traits
树种
Tree species样本数
Sample numberSLA−H SLA−D H−D 斜率 Slope R2 斜率 Slope R2 斜率 Slope R2 白桦 Betula platyphylla 130 0.9 0.018 3.5 0.020 − 4.0 0.000 山杨 Populus davidiana 58 0.7 0.005 2.9 0.020 4.2 0.026 蒙古栎 Quercus mongolica 157 0.8 0.001 2.0 0.002 − 2.4 0.010 紫椴 Tilia amurensis 142 − 0.7 0.000 1.7 0.008 2.4 0.002 水曲柳 Fraxinus mandschurica 61 − 0.9 0.000 3.5 0.038 3.8 0.017 色木槭 Acer pictum 78 0.5 0.001 − 1.0 0.003 − 1.7 0.008 红松 Pinus koraiensis 61 0.2 0.003 注:SLA、H、D分别为比叶面积、树高、木质密度。Notes: SLA, H and D are specific leaf area, tree height and wood density, respectively.
下载: 导出CSV
表 4 典型树种功能性状与气候因子偏相关分析
Table 4 Partial correlation analysis between functional traits and climatic factors of dominant tree species
树种 Tree species log(SLA) logH logD MAT MAR MAT MAR MAT MAR 白桦 Betula platyphylla − 0.009 − 0.16* − 0.178* 0.161* − 0.005 − 0.007 山杨 Populus davidiana − 0.312** − 0.151 0.019 0.292*** − 0.025 0.043 蒙古栎 Quercus mongolica − 0.164* 0.062 − 0.035 0.260*** 0.176** − 0.008 紫椴 Tilia amurensis − 0.019 0.060 − 0.037 0.132 0.117 0.009 水曲柳 Fraxinus mandschurica − 0.384*** − 0.052 0.168 0.344*** − 0.026 − 0.117 色木槭 Acer pictum − 0.085 − 0.021 0.149 0.122 − 0.26** 0.096 红松 Pinus koraiensis 0.052 0.263* − 0.078 − 0.100
下载: 导出CSV
-
[1] 何念鹏, 刘聪聪, 张佳慧, 等. 植物性状研究的机遇与挑战: 从器官到群落[J]. 生态学报, 2018, 38(19):6787−6796. He N P, Liu C C, Zhang J H, et al. Perspectives and challenges in pant traits: from organs to communities[J]. Acta Ecologica Sinica, 2018, 38(19): 6787−6796.
[2] Jhc C, Lavorel S, Garnier E, et al. A handbook of protocols for standardised and easy measurement of plant functional traits worldwide[J]. Australian Journal of Botany, 2003, 51(4): 335−380. doi: 10.1071/BT02124
[3] Reich P B. The evolution of plant functional variation: traits, spectra, and strategies[J]. International Journal of Plant Sciences, 2003, 164(S3): S143−S164. doi: 10.1086/374368
[4] Diaz S, Cabido M, Casanoves F. Plant functional traits and environmental filters at a regional scale[J]. Journal of Vegetation Science, 1998, 9(1): 113−122. doi: 10.2307/3237229
[5] Westoby M. A leaf-height-seed (LHS) plant ecology strategy scheme[J]. Plant & Soil, 1998, 199(2): 213−227.
[6] Guittar J, Goldberg D, Klanderud K, et al. Can trait patterns along gradients predict plant community responses to climate change[J]. Ecology, 2016, 97(10): 2791. doi: 10.1002/ecy.1500
[7] Falster D S, Westoby M. Plant height and evolutionary games[J]. Trends in Ecology & Evolution, 2003, 18(7): 337−343.
[8] 刘金环, 曾德慧, Don Koo LEE. 科尔沁沙地东南部地区主要植物叶片性状及其相互关系[J]. 生态学杂志, 2006, 25(8):921−925. doi: 10.3321/j.issn:1000-4890.2006.08.010 Liu J H, Zeng D H, Lee D K. Leaf traits and their interrelationships of main plant species in southeast Horqin sandy land[J]. Chinese Journal of Ecology, 2006, 25(8): 921−925. doi: 10.3321/j.issn:1000-4890.2006.08.010
[9] Swenson N G, Enquist B J. Ecological and evolutionary determinants of a key plant functional trait: wood density and its community-wide variation across latitude and elevation[J]. American Journal of Botany, 2007, 94(3): 451−459. doi: 10.3732/ajb.94.3.451
[10] Villar R, Merino J. Comparison of leaf construction costs in woody species with differing leaf life-spans in contrasting ecosystems[J]. New Phytologist, 2001, 151(1): 213−226. doi: 10.1046/j.1469-8137.2001.00147.x
[11] 刘晓娟, 马克平. 植物功能性状研究进展[J]. 中国科学: 生命科学, 2015, 45(4):325−339. Liu X J, Ma K P. Advances in plant functional traits[J]. Scientia Sinica Vitae, 2015, 45(4): 325−339.
[12] Niinemets Ü. Global-scale climatic controls of leaf dry mass per area, density, and thickness in trees and shrubs[J]. Ecology, 2001, 82(2): 453−469. doi: 10.1890/0012-9658(2001)082[0453:GSCCOL]2.0.CO;2
[13] Wright I J, Reich P B, Westoby M. Strategy shifts in leaf physiology, structure and nutrient content between species of high- and low-rainfall and high- and low-nutrient habitats[J]. Functional Ecology, 2001, 15(4): 423−434. doi: 10.1046/j.0269-8463.2001.00542.x
[14] Wright I J, Reich P B, Cornelissen J H C, et al. Assessing the generality of global leaf trait relationships[J]. New Phytologist, 2010, 166(2): 485−496.
[15] Santiago L S, Wright S J. Leaf functional traits of tropical forest plants in relation to growth form[J]. Functional Ecology, 2010, 21(1): 19−27.
[16] Falster D S, Warton D I, Wright I J. User’s guide to SMATR: standardised major axis tests and routines: Version 2.0[M/OL]. 2006 [2018−06−06]. http://www.bio.mq.edu.au/ecology/SMATR/.
[17] Westoby M. The worldwide leaf economics spectrum[J]. Nature, 2004, 428: 821. doi: 10.1038/nature02403
[18] Chave J, Coomes D, Jansen S, et al. Towards a worldwide wood economics spectrum[J]. Ecology Letters, 2010, 12(4): 351−366.
[19] Wright I J, Ackerly D D, Bongers F, et al. Relationships among ecologically important dimensions of plant trait variation in seven neotropical forests[J]. Annals of Botany, 2007, 99: 1003−1015.
[20] Moles A T, Warton D I, Warman L, et al. Global patterns in plant height[J]. Journal of Ecology, 2009, 97(5): 923−932. doi: 10.1111/jec.2009.97.issue-5
[21] Wang R L, Yu G R, He N P, et al. Latitudinal variation of leaf morphological traits from species to communities along a forest transect in eastern China[J]. Journal of Geographical Sciences, 2016, 26(1): 15−26. doi: 10.1007/s11442-016-1251-x
[22] 方精云. 也论我国东部植被带的划分[J]. 植物学报, 2001, 43(5):522−533. doi: 10.3321/j.issn:1672-9072.2001.05.013 Fang J Y. Re-discussion about the forest vegetation zonation in Eastern China[J]. Acta Botanica Sinica, 2001, 43(5): 522−533. doi: 10.3321/j.issn:1672-9072.2001.05.013
[23] Markesteijn L, Poorter L. Seedling root morphology and biomass allocation of 62 tropical tree species in relation to drought- and shade-tolerance[J]. Journal of Ecology, 2009, 97(2): 311−325. doi: 10.1111/jec.2009.97.issue-2
[24] Poorter L, Markesteijn L. Seedling traits determine drought tolerance of tropical tree species[J]. Biotropica, 2008, 40(3): 321−331. doi: 10.1111/(ISSN)1744-7429
[25] Cornwell W K, Ackerly D D. Community assembly and shifts in plant trait distributions across an environmental gradient in coastal California[J]. Ecological Monographs, 2009, 79(1): 109−126. doi: 10.1890/07-1134.1
-
期刊类型引用(2)
1. 杨雨薇,何宝辉,韩学娇,时海香,张贵民,路兴慧. 林龄对毛白杨功能性状和林下土壤理化性质的影响及其耦合关系. 植物研究. 2023(06): 857-867 .  百度学术
百度学术
2. 高林浩,孙晗,白雪卡,代爽,樊艳文,刘超,王襄平,尹伟伦. 气候、系统发育对长白山乔灌木比叶面积与叶元素含量关系的影响. 北京林业大学学报. 2020(02): 19-30 . 本站查看
其他类型引用(11)


计量
- 文章访问数: 4041
- HTML全文浏览量: 777
- PDF下载量: 109
- 被引次数: 13
