
Snow hydrological characteristics of Larix gmelinii forest in northern Daxing'an Mountains of northeastern China
-
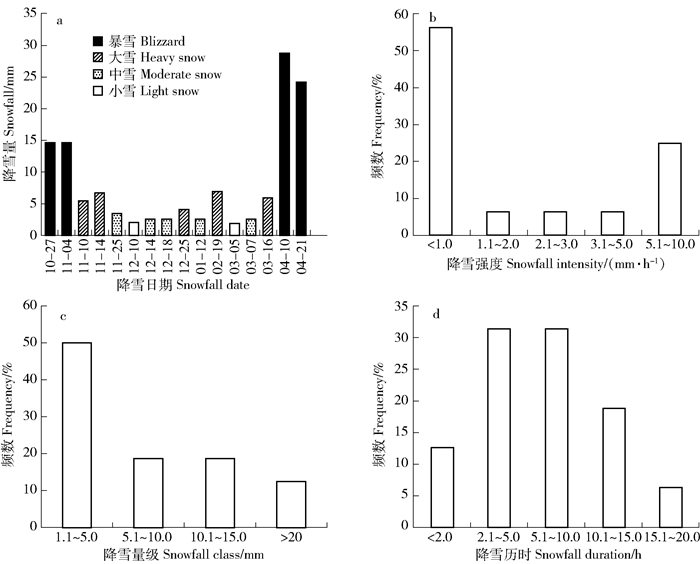
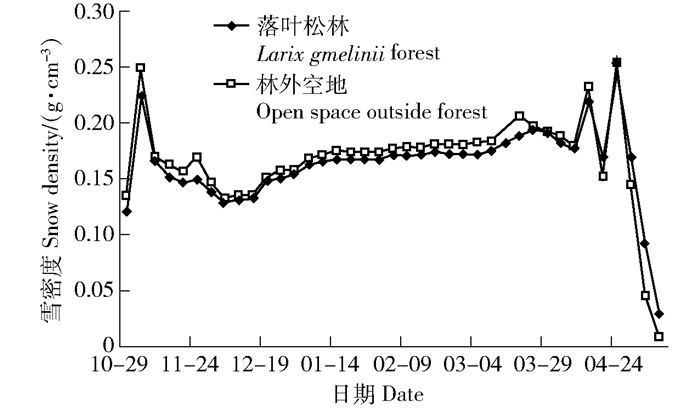
摘要:目的研究大兴安岭北部地区兴安落叶松林雪水文特征,为今后积雪蒸发测定和区域水资源调控提供更为科学的数据支撑和理论基础。方法对观测期内16场降雪的大气降雪量以及对林内积雪深度、积雪密度以及雪水当量进行了周期性观测与统计分析。结果(1) 随着降雪级别的减少,兴安落叶松林的截留率呈现逐渐增加的趋势,分别为6.50%(暴雪)、9.04%(大雪)、9.8%(中雪)、15.7%(小雪)。可见,兴安落叶松林降雪截留最大截留率出现在小雪,暴雪时截留率则最小。(2)兴安落叶松林内积雪深度和林外相比差异不大,其中落叶松林林内积雪深度最深为68.6cm,林外空地积雪深度最深为74.8cm。(3)林内和林外的积雪密度在观测初期会随降雪的输入而降低,无降雪期有相应升高。融雪期随着气温的升高,雪密度减少速度会加快。在4月24—29日达到最大值,减少量分别为0.07和0.11g/cm3。(4)雪水当量速率减少量在4月24—29日达到最大值,分别为30.2和46.4mm。结论和林外空地相比,兴安落叶松林对积雪深度、积雪密度及雪水当量影响不大,说明兴安落叶松林在雪水文过程中对积雪特征影响尽管存在,但并不明显。该区雪蒸发日变化呈单峰曲线变化规律,积雪期的日蒸发量和蒸发速率均值分别为0.04mm和0.2×10-3mm/h,日蒸发量波动幅度在0.02~0.14mm之间,在融雪期间,日蒸发量和蒸发速率的均值分别为0.38mm和1.51×10-3mm/h,采用灰色关联度对各因子进行分析,得出净辐射是影响兴安落叶松林内积雪蒸发的主要因素。Abstract:ObjectiveTo provide more scientific data support and theoretical basis for the future snow cover evaporation measurement and regional water resurces requlation, the snow hydrological characteristics in the natural forest of Larix gmelinii was studied in northern Daxing'an Mountains of northeastern China. The snowfall interception and snow cover characteristics were systematically studied from the end of October 2015 to the beginning of May 2016.MethodDuring the observation period, the snowfall of 16 snowfalls, as well as the snow depth, snow density and snow water equivalent in the forest were periodically observed and statistically analyzed.Result(1) With the decreasing of snowfall level, the interception rate of Larix gmelinii forest showed a gradual increasing trend, which was 6.50% (blizzard), 9.04% (heavy snow), 9.8% (moderate snow), 15.7% (light snow). It can be seen that the maximum interception rate of snowfall in Larix gmelinii forest occurred in light snow, and the smallest occurred in blizzard. (2) The difference between the depth of snow inside Larix gmelinii forest and that outside the forest was not significant. Among them, the deepest snow depth in larch forest was 68.6cm, and that in outer space was 74.8cm. (3) The density of snow inside and outside the forest decreased with the input of snowfall in the early stage of observation, and did not increase in the absence of snowfall. Snowmelt as the temperature rises, the snow density will decrease faster. (4) Reaching the maximum between April 24 and April 29, with a decrease of 0.07 and 0.11g/cm3, respectively; the reduction of snow equivalent rate reached the maximum between April 24 and April 29, 30.2 and 46.4mm, respectively.ConclusionCompared with the open space outside the forest, the Larix gmelinii forest has little effect on the snow depth, snow cover density and snow water equivalent, indicating that the effect of Larix gmelinii forest on the hydrological characteristics of snow cover is not obvious. The daily change of snow evapotranspiration in this area showed a single-peak curve variation. The daily evaporation and evaporation rates in the snow-covered period were 0.04mm and 0.2×10⁻³mm/h, respectively. Daily evaporation fluctuated between 0.02-0.14mm. During the snowmelt period, the average daily evaporation and evaporation rates were 0.38mm and 1.51×10⁻³mm/h, respectively, and the factors were analyzed using the grey correlation degree. It is concluded that net radiation is the main factor influencing snowcover evaporation in Larix gmelinii forest.
-
Keywords:
- Larix gmelinii forest /
- snowcover evaporation /
- snowfall interception /
- snowmelting
-
中国是世界上土壤侵蚀比较严重的国家之一,土壤侵蚀不仅会降低土地生产力、抑制植被生长、恶化生态环境,还会引发一系列污染和气候问题。土壤抗蚀性指土壤抵抗侵蚀营力对其分散、破坏的能力[1-2],它是影响土壤侵蚀的根本因素,也是反映土壤抵抗侵蚀营力的重要指标[3]。研究土壤抗蚀性对防治水土流失、控制土壤侵蚀有重要意义。
土壤抗蚀性的强弱与土壤内在理化性质和植被类型等外在因素密切相关[1,4],其评价指标可归纳为水稳性团聚体类、微团聚体类、无机黏粒类、有机胶体类和土壤力学相关类5大类[5]。但不同研究区的主要评价指标不同,如在南方红壤区[6]结构性颗粒指数、土壤团聚度和结构体破坏率等是表征土壤抗蚀性强弱的关键指标,而在三峡库区消落带[7]则为黏粒、 > 0.25 mm水稳性团粒和有机质含量。同样,不同土地利用类型因其植被和土壤的不同也会导致土壤抗蚀性出现差异。刘宽梅等[8]发现喀斯特地区表层土壤中阔叶林的土壤抗蚀性强于灌木林和针叶林;刘旦旦等[9]在黄土坡面上的研究表明,林地对土壤的改良作用强于荒草地和农耕地,使土壤质地变好,抗蚀性增强。此外,薛箑等[10]对不同退耕年限人工灌木林土壤抗蚀性的研究发现,土壤水稳性团聚体和有机质含量随退耕年限的增大呈增加趋势,土壤团聚状况逐渐变好,抗蚀性显著增强。可见不同研究区甚至同一研究区不同研究对象的土壤抗蚀性及其评价指标存在差异,但以上研究主要集中在比较不同植被覆盖、土地利用类型和退耕年限的土壤抗蚀性,缺乏对同一植被类型不同林分密度下的研究。林分密度是指单位面积上林木的株数,它决定了林分的空间结构[11],是人工林营造及抚育中的可控因子,对森林生态系统的稳定性和水土保持功能的发挥有重要影响。林分密度通过改变光、水、肥、热等环境因子的分配改变林下生境,对林下灌草植物的种类、数量、分布和枯落物的数量、质量产生影响,造成土壤结构和理化性质的差异[12-13],进而影响土壤抗蚀性。
为减轻水土流失、保护和改善生态环境,晋西黄土区自1992年开始实施退耕还林工程。刺槐是该区植被恢复重建的主要树种,在防治水土流失方面发挥了重要作用。但在退耕还林过程中未充分考虑林分密度的动态变化,出现了林分密度不合理、植被生长缓慢、水土保持功能低下等问题。故研究不同密度刺槐林土壤抗蚀性及其关键评价指标可以更好地了解当前林分密度的合理性,并尝试从土壤抗蚀性角度,提出该区刺槐林经营的适宜密度,为改善林分结构、实现水土保持功能导向型林分结构定向调控提供理论依据。
1. 研究区概况
研究区位于山西吉县蔡家川流域(110°39′45″ ~ 110°47′45″E,36°14′27″ ~ 36°18′23″N)。该流域地势西高东低,海拔分布在800 ~ 1 600 m,面积为39 km2,属于黄土残塬沟壑区。气候为暖温带大陆性季风气候,年均气温10 ℃,年均降水量575.9 mm,年均蒸发量1 729 mm,无霜期172 d。土壤类型为碳酸盐褐土,呈微碱性,黄土母质,土层深厚且质地均匀。蔡家川流域内林分结构简单,以纯林为主,刺槐(Robinia pseudoacacia)作为主要造林树种,在此广泛分布,其成林密度在500 ~ 3 500株/hm2之间。刺槐林下植被种类丰富,长势良好,灌木植物主要有黄刺玫(Rosa xanthina)、杠柳(Periploca sepium)、茅莓(Rubus parvifolius)等;草本植物以虉草(Phalaris arundinacea)、苔草(Carex tristachya)、黑麦草(Lolium perenne)等为主。
2. 试验方法
2.1 样地设置
以代表性和典型性为原则,在蔡家川流域选取林龄相同(16年生)、地理位置相对集中、立地条件相似但密度不同的刺槐林布设标准样地,面积为20 m × 20 m,林分密度分别为1 025、1 300、1 575、1 800、2 150株/hm2,在样地内进行林分调查,并记录海拔、坡度、坡向等立地条件指标。样地基本特征见表1。
表 1 样地基本特征Table 1. Basic characteristics of sample plots林分密度/(株·hm−2)
Stand density/(tree·ha−1)地理位置
Geographical position海拔
Altitude/m坡度
Slope/(°)坡向
Slope aspect1 025 110°45′45″E 36°12′21″N 1 130 17 阳坡
Sunny slope1 300 110°45′46″E 36°15′59″N 1 100 23 半阴坡
Semi-shady slope1 575 110°46′13″E 36°16′13″N 1 135 20 半阳坡
Semi-sunny slope1 800 110°46′08″E 36°16′31″N 1 070 22 半阳坡
Semi-sunny slope2 150 110°46′12″E 36°16′33″N 1 145 25 半阳坡
Semi-sunny slope2.2 样地调查
在样地内对刺槐乔木进行每木检尺,记录其胸径、树高和冠幅,并采取样点法对林分郁闭度进行估测。在每个样地中心和4角共设置5个灌木样方,面积为5 m × 5 m,在每个灌木样方内设置1个草本样方,面积为1 m × 1 m,调查所有灌木和草本样方内的植物种类、株(丛)数和盖度,同时采用物种丰富度指数、多样性指数和均匀度指数来表征不同密度刺槐林下植被的生长状况,计算方法如下:
物种丰富度Patrick指数=样方内物种数目 (1) Simpson多样性指数:D=1−∑Ni=1p2i (2) Shannon-Wiener多样性指数:H=−∑Ni=1pilnpi (3) Pielou均匀度指数:J=HlnN (4) 式中:N为样方内物种数量;pi为物种相对重要值(相对多度、相对频度与相对盖度的平均值)。
在每个样地坡上、坡中和坡下3个位置分别布设1个30 cm × 30 cm的枯落物样方,在保持枯落物原有结构的情况下,将其带回室内连续烘干12 h后称其质量作为干质量,用单位面积枯落物的干质量表示蓄积量:
M=GS×100 (5) 式中:M为枯落物蓄积量(t/hm2);G为枯落物干质量(g);S为单个样方面积(cm2)。
样地调查结果见表2。
表 2 样地调查结果Table 2. Sample plot survey results林分密度/(株·hm−2) Stand
density/(tree·ha−1)平均胸径 Mean DBH/
cm平均树高 Average tree height/
m平均冠幅
Average crown width/m2郁闭度
Canopy density物种丰富度Patrick指数
Species richness Patrick indexSimpson多样性指数
Simpson diversity indexShannon-Wiener 多样性指数
Shannon-Wiener diversity indexPielou均匀度指数
Pielou evenness index枯落物蓄积量/(t·hm−2)
Volume of litter/(t·ha−1)灌木
Shrub草本 Herb 灌木
Shrub草本 Herb 灌木
Shrub草本 Herb 灌木
Shrub草本 Herb 1 025 11.90 9.48 7.64 0.47 6 8 0.738 0.759 1.501 1.656 0.837 0.796 3.02 1 300 10.69 9.25 6.80 0.55 10 9 0.813 0.811 1.907 1.872 0.828 0.852 4.40 1 575 12.26 10.24 6.25 0.60 10 14 0.872 0.839 2.150 2.169 0.934 0.822 7.65 1 800 11.05 9.73 6.15 0.63 8 12 0.852 0.827 1.990 2.026 0.957 0.815 6.23 2 150 9.31 8.22 5.75 0.70 9 14 0.805 0.819 1.794 2.088 0.816 0.791 6.42 2.3 样品采集及测定
每个样地内沿对角线布设3个土壤采样点,按0 ~ 10 cm、10 ~ 20 cm、20 ~ 30 cm分3层挖土壤剖面采集样品。用环刀取原状土,采用环刀浸水法测定土壤密度;用木制工具采集原状土装入自封袋,将各采样点原状土充分混合后,用四分法取出足量样品,除去砾石和植物根系,带回实验室自然风干,用于测定土壤有机质、团聚体、机械组成和微团聚体指标。采用重铬酸钾外加热氧化法测定土壤有机质含量;采用干筛、湿筛方法利用8411型电动振筛机和XY-100型土壤团聚体分析仪测定土壤团聚体;利用Malvern 3000激光粒度分析仪测定土壤机械组成;采用吸管法测定土壤微团聚体。
2.4 土壤抗蚀性指标的选取及计算方法
本文根据土壤抗蚀性的研究现状,参考前人研究结果[5,14-15],选取5大类、12个土壤抗蚀性指标(表3)进行研究,计算方法如下[15]。
表 3 土壤抗蚀性指标Table 3. Soil anti-erodibility indexes土壤力学相关类Related categories of
soil mechanics有机胶体类
Organic colloids水稳性团聚体类
Water-stable aggregate无机黏粒类
Inorganic clay微团聚体类
Micro aggregates土壤密度
Soil bulk density有机质含量
Organic matter content> 0.25 mm水稳性团聚体质量分数Mass fraction of > 0.25 mm water-stable aggregates < 0.05 mm粉黏粒质量分数
Mass fraction of < 0.05 mm silt clay团聚度
Soil aggregation degree> 0.25 mm团聚体破坏率Destruction rate of > 0.25 mm aggregates < 0.01 mm物理性黏粒质量分数
Mass fraction of < 0.01 mm physical clay分散系数
Soil dispersion coefficient平均质量直径
Mean mass diameter< 0.002 mm黏粒质量分数
Mass fraction of < 0.002 mm clay几何平均直径
Geometric mean diameter土壤分形维数
Soil fractal dimension (D)WSA=∑ni=1mim×100% (6) 式中:WSA表示 > 0.25 mm水稳性团聚体质量分数;i为土壤团聚体的级数,i = 1,2,···,n;mi为第i级土壤团聚体质量(g);m为土壤团聚体总质量(g)。
PAD=Md−MwMd×100% (7) 式中:PAD表示 > 25 mm团聚体破坏率;Md为 > 0.25 mm干筛团聚体质量比例(%);Mw为 > 0.25 mm湿筛团聚体质量比例(%)。
MMD=∑niwidi (8) GMD=exp(∑niwilndi∑niw) (9) 式中:MMD表示平均质量直径;GMD表示几何平均直径;wi为第i级土壤团聚体质量分数(%);di为相邻两粒级土壤团聚体的平均直径(mm)。
土壤分形维数D运用分形理论通过建立土壤团粒结构的分形模型从而计算得出[16]。
(didmax (10) 式中:di为相邻两粒级土壤团聚体的平均直径(mm);dmax为团聚体的最大直径(mm);mi为粒径小于di的累积土壤团聚体质量(g);mmax为各粒级土壤团聚体质量的总和(g);D为分形维数,由回归分析得到。
{\text{SAD}} = \dfrac{{{W_{0.05}} - {X_{0.05}}}}{{{W_{0.05}}}} \times 100\% (11) 式中:SAD为团聚度;W0.05为 > 0.05 mm微团聚体质量分数(%);X0.05为土壤机械组成中 > 0.05 mm颗粒质量分数(%)。
{\text{SDC}} = \frac{{{W_{0.01}}}}{{{X_{0.01}}}} \times 100\% (12) 式中:SDC为分散系数;W0.01为 < 0.01 mm微团聚体质量分数(%);X0.01为土壤机械组成中 < 0.01 mm颗粒质量分数(%)。
3. 结果与分析
3.1 土壤抗蚀性指标单独分析
3.1.1 土壤密度与有机质
土壤密度代表土壤的紧实程度,土壤密度越小,土质越疏松,孔性越好,通气透水性越强[17-18],对增强土壤抗蚀性有积极的影响。各刺槐林样地中,土壤密度随土层的加深呈递增趋势,0 ~ 10 cm土层内密度较小,平均值为1.10 g/cm3。不同密度条件下刺槐林的土壤密度差异显著(P < 0.05),随林分密度的增大密度表现为先减后增,在密度为1 575株/hm2时达到最低(0 ~ 10 cm:1.03 g/cm3;10 ~ 20 cm:1.10 g/cm3;20 ~ 30 cm:1.16 g/cm3)(图1)。土壤有机质作为胶结源可促进土壤团粒结构的形成,增强土壤结构的稳定性,从而提高土壤抗蚀性[18]。各样地中,土壤有机质含量在垂直分布上存在显著差异(P < 0.05),随土层的加深呈递减趋势,0 ~ 10 cm土层内有机质含量较高,平均值为14.12 g/kg。0 ~ 30 cm土层内不同密度刺槐林土壤有机质含量表现为1 575株/hm2(10.64 g/kg) > 2 150株/hm2(10.12 g/kg) > 1 800株/hm2(9.98 g/kg) > 1 300株/hm2(9.39 g/kg) > 1 025株/hm2(8.28 g/kg),表明有机质含量在不同林分密度条件下也存在显著差异(P < 0.05)。当刺槐林分密度为1 575株/hm2时,土壤密度较小,有机质含量较高,说明在该密度条件下刺槐林对土壤的改良作用较强,且表层土壤的质地要优于深层土壤。
![]() 图 1 不同密度刺槐林土壤密度与有机质含量不同大写字母表示同一林分密度不同土层间变量差异显著(P < 0.05);不同小写字母表示同一土层不同林分密度下变量差异显著(P < 0.05)。下同。Different uppercase letters indicate significant differences in variables between varied soil layers of the same stand density (P < 0.05); different lowercase letters indicate significant differences in variables under varied stand densities of the same soil layer (P < 0.05). The same below.Figure 1. Soil density and organic matter content of Robinia pseudoacacia forest with different densities
图 1 不同密度刺槐林土壤密度与有机质含量不同大写字母表示同一林分密度不同土层间变量差异显著(P < 0.05);不同小写字母表示同一土层不同林分密度下变量差异显著(P < 0.05)。下同。Different uppercase letters indicate significant differences in variables between varied soil layers of the same stand density (P < 0.05); different lowercase letters indicate significant differences in variables under varied stand densities of the same soil layer (P < 0.05). The same below.Figure 1. Soil density and organic matter content of Robinia pseudoacacia forest with different densities3.1.2 土壤团聚体
(1)土壤团聚体分布特征
如图2所示,干筛时,各刺槐林样地土壤团聚体集中分布在2 ~ 5 mm粒径范围内,质量分数几乎达到30%以上;在0.25 ~ 0.5 mm内最少,质量分数平均值为9.84%;在 < 0.25 mm、0.5 ~ 1 mm、1 ~ 2 mm和 > 5 mm粒径范围内土壤团聚体分布类似,质量分数基本介于10% ~ 16%。湿筛后,各刺槐林样地土壤团聚体粒径分布均发生变化,主要分布在 < 0.25 mm粒径范围内,质量分数为33.72% ~ 41.54%。相比干筛时,大部分粒径质量分数明显减少, > 5 mm土壤团聚体平均损失为67.70%,2 ~ 5 mm为37.72%,1 ~ 2 mm为29.55%,只有 < 0.25 mm土壤团聚体显著增加,可见非水稳性团聚体遇水后多分散成 < 0.25 mm土壤颗粒,这种颗粒极易堵塞土壤孔隙,导致水分难以下渗,从而增加地表径流,造成水土流失。
![]() 图 2 干筛和湿筛条件下各密度刺槐林土壤团聚体分布特征Figure 2. Distribution characteristics of soil aggregates under dry and wet sieving
图 2 干筛和湿筛条件下各密度刺槐林土壤团聚体分布特征Figure 2. Distribution characteristics of soil aggregates under dry and wet sieving(2)土壤团聚体稳定性特征
湿筛后得到的是土壤水稳性团聚体,它是一种有机−无机物质的土壤复合体,由有机质胶结而成[18]。水稳性团聚体浸水后不易分散,稳定性较高,因此其质量分数和稳定性是评价土壤抗蚀性的重要指标。
由表4可知,各刺槐林样地中,> 0.25 mm水稳性团聚体质量分数随土层的加深逐渐降低,同一土层内,随林分密度的增大,> 0.25 mm水稳性团聚体质量分数表现为先增后减,且存在显著差异(P < 0.05),0 ~ 30 cm土层内其值在林分密度为1 575 株/hm2时最大(63.89%)。团聚体破坏率可反映土壤团聚体遇水后的破坏程度,其值越小越好[15]。各样地中,> 0.25 mm团聚体破坏率在土壤的垂直梯度上无明显变化规律,但随林分密度的增大呈先降低后升高的变化规律,0 ~ 30 cm土层内密度为1 575 株/hm2的刺槐林 > 0.25 mm团聚体破坏率最低(25.62%)。平均质量直径和几何平均直径能较好地反映土壤团聚体的稳定性特征,其值越大,团聚体的团聚度越高,稳定性越强[19]。各刺槐林样地中,平均质量直径和几何平均直径在土壤的垂直分布上具有一致性,均随土层的加深呈递减趋势,0 ~ 10 cm土层稳定性最好。0 ~ 30 cm土层内平均重量直径和几何平均直径均表现为密度为1 800 株/hm2的刺槐林最大(1.45 mm、1.60 mm),其次为密度为1 575株/hm2的刺槐林(1.41 mm、1.45 mm)。在一定程度上,土壤分形维数能反映土壤质量的好坏,其值越小,土壤的结构和稳定性越好[20]。各样地中土壤分形维数的变化范围较小(2.64 ~ 2.71),0 ~ 10 cm土层的分形维数最小,之后随土层的加深呈递增趋势。不同密度条件下刺槐林的土壤分形维数存在显著差异(P < 0.05),且随林分密度的增大表现为先减后增,0 ~ 30 cm土层内其值在密度为1 575株/hm2时达到最小(2.66)。
表 4 不同密度刺槐林土壤水稳性团聚体指标Table 4. Indicators of soil water-stabilized aggregates in different densities of Robinia pseudoacacia林分密度/(株·hm−2)
Stand density/(tree·ha−1)土层深度Soil
depth/cm> 0.25 mm水稳性团聚体质量分数 Mass fraction of > 0.25 mm water-stable aggregates/% > 0.25 mm团聚体破坏率 Destruction rate of > 0.25 mm aggregates/% 平均质量直径 Mean mass diameter/mm 几何平均直径
Geometric mean diameter/mm土壤分形维数
Soil fractal dimension (D)1 025 0 ~ 10 61.42Ab 30.38Aa 1.55Aa 1.70Aa 2.68Ba 10 ~ 20 60.41Ab 30.50Aa 1.40Aa 1.52ABa 2.69ABa 20 ~ 30 58.46Aa 31.06Aa 1.17ABb 1.31Bab 2.71Aa 0 ~ 30 60.10Ab 30.64Aa 1.37Aa 1.51Aa 2.69ABa 1 300 0 ~ 10 66.28Aa 26.34Ab 1.50Aa 1.48Aab 2.64Bb 10 ~ 20 63.04ABab 27.99Aab 1.37Aa 1.41Aa 2.67ABab 20 ~ 30 60.26Ba 28.29Aab 1.31Aa 1.39Aa 2.69Aa 0 ~ 30 63.19ABa 27.54Ab 1.40Aa 1.43Aa 2.67ABab 1 575 0 ~ 10 66.13Aa 25.65Ab 1.50Aa 1.50Aa 2.64Bb 10 ~ 20 64.67Aa 24.60Ab 1.42Aa 1.45Aa 2.65Bb 20 ~ 30 60.86Ba 26.61Ab 1.30Aa 1.40Aa 2.69Aa 0 ~ 30 63.89Aa 25.62Ab 1.41Aa 1.45Aa 2.66Bb 1 800 0 ~ 10 63.62Aab 29.15Aa 1.53Aa 1.63Aa 2.66Bab 10 ~ 20 60.94ABb 29.78Aa 1.43Aa 1.59Aa 2.69ABa 20 ~ 30 59.68Ba 28.22Aab 1.39Aa 1.59Aa 2.70Aa 0 ~ 30 61.41Aab 29.05Aab 1.45Aa 1.60Aa 2.68ABab 2 150 0 ~ 10 61.99Ab 30.79Aa 1.43Aa 1.52Aa 2.68Aa 10 ~ 20 60.74Ab 30.38Aa 1.35Aa 1.45Aa 2.69Aa 20 ~ 30 59.27Aa 30.05Aa 1.26Aa 1.37Aa 2.70Aa 0 ~ 30 60.66Ab 30.41Aa 1.35Aa 1.45Aa 2.69Aa 3.1.3 土壤机械组成与微团聚体
如图3所示,各刺槐林样地中,土壤机械组成和微团聚体组成大致相同,且粒径分布相似,均以0.01 ~ 0.05 mm粗粉粒为主,质量分数平均值分别为63.46%、42.71%;在 < 0.002 mm颗粒范围内占比最少,仅占2.37%、1.20%。
![]() 图 3 不同密度刺槐林土壤机械组成和微团聚体组成Figure 3. Soil mechanical composition and microaggregates of Robinia pseudoacacia with different densities
图 3 不同密度刺槐林土壤机械组成和微团聚体组成Figure 3. Soil mechanical composition and microaggregates of Robinia pseudoacacia with different densities团聚度表示土壤颗粒的团聚程度,分散系数表示土壤的分散性,二者与土壤抗蚀性密切相关[21]。通常团聚度越大,分散系数越小,土壤抗蚀性越强。由表5可知,各刺槐林样地中,随土层的加深土壤团聚度基本呈递减趋势,而分散系数则逐层递增,表层(0 ~ 10 cm)土壤团聚度较大,分散系数较小,抗蚀性较强。不同密度刺槐林土壤团聚度和分散系数差异显著(P < 0.05),在0 ~ 30 cm土层内团聚度表现为1 575株/hm2 > 2 150株/hm2 > 1 025株/hm2 > 1 800株/hm2 > 1 300株/hm2,分散系数表现为1 300株/hm2 < 1 575株/hm2 < 1 800株/hm2 < 2 150株/hm2 < 1 025株/hm2。
表 5 不同密度刺槐林土壤团聚度和分散系数Table 5. Soil aggregation degree and dispersion coefficient of Robinia pseudoacacia with different densities林分密度/(株·hm−2)
Stand density/(tree·ha−1)土层深度
Soil depth/cm团聚度
Soil aggregation degree/%分散系数
Soil dispersion coefficient/%1 025 0 ~ 10 38.12Ab 50.21Ba 10 ~ 20 38.06Aab 54.07Ba 20 ~ 30 37.76Ab 59.33Aa 0 ~ 30 37.98Aab 54.54Ba 1 300 0 ~ 10 37.88Ab 43.71Bb 10 ~ 20 36.38ABb 46.77Bb 20 ~ 30 35.75Bc 53.16Ab 0 ~ 30 36.67ABb 47.88Bb 1 575 0 ~ 10 41.74Aa 43.86Bb 10 ~ 20 39.93Aa 47.27ABb 20 ~ 30 36.98Bbc 52.69Ab 0 ~ 30 39.55Aa 47.94ABb 1 800 0 ~ 10 37.79Ab 46.25Bab 10 ~ 20 37.02Ab 49.62Bab 20 ~ 30 36.96Abc 54.94Ab 0 ~ 30 37.13Aab 50.27ABab 2 150 0 ~ 10 37.72Bb 48.71Ba 10 ~ 20 37.00Bb 52.79Ba 20 ~ 30 39.44Aa 57.84Aab 0 ~ 30 38.05ABa 53.11ABa 3.2 不同密度刺槐林土壤抗蚀性综合评价
3.2.1 土壤抗蚀性指标的选定
对以上5大类、12个土壤抗蚀性指标进行主成分分析,结果见表6。12个指标可概括为3个独立的主成分(Y1、Y2、Y3),特征值均大于1,累计贡献率达84.382%,基本可以反映晋西黄土区刺槐林(16年生)土壤抗蚀性的变异信息。其中Y1的贡献率最大(40.596%),对土壤抗蚀性的影响较强,Y1主要综合了土壤密度、有机质含量、 > 0.25 mm水稳性团聚体质量分数、平均质量直径、几何平均直径、土壤分形维数和分散系数的变异信息,因子载荷量绝对值均大于0.5,其中土壤密度、分形维数和分散系数对Y1有逆向效应,其值越大,Y1越小,土壤抗蚀性越弱。Y2主要由土壤机械组成和 > 0.25 mm团聚体破坏率决定,贡献率为32.123%。Y3的贡献率为11.662%,主要由团聚度决定,载荷量为0.947。根据各指标对主成分的贡献,可以确定评价晋西黄土区刺槐林(16年生)土壤抗蚀性的关键指标为土壤密度、有机质含量、> 0.25 mm水稳性团聚体质量分数、平均质量直径、几何平均直径、土壤分形维数和分散系数。
表 6 土壤抗蚀性指标PCA分析Table 6. Principal component analysis for soil anti-erodibility indexes土壤抗蚀性指标
Soil anti-erodibility index主成分
Principal componentY1 Y2 Y3 土壤密度 Soil bulk density −0.776 −0.369 −0.136 有机质含量 Organic matter content 0.864 0.068 0.259 > 0.25 mm水稳性团聚体质量分数 Mass fraction of > 0.25 mm water-stable aggregates 0.747 0.514 0.344 > 0.25 mm团聚体破坏率Destruction rate of > 0.25 mm aggregates −0.285 −0.754 −0.267 平均质量直径 Mean mass diameter 0.960 −0.003 0.036 几何平均直径
Geometric mean diameter0.779 −0.416 −0.176 土壤分形维数
Soil fractal dimension (D)−0.736 −0.518 −0.358 < 0.05 mm粉黏粒质量分数
Mass fraction of < 0.05 mm silt clay0.062 0.888 0.000 < 0.01 mm物理性黏粒质量分数
Mass fraction of < 0.01 mm physical clay0.093 0.786 0.219 < 0.002 mm黏粒质量分数
Mass fraction of < 0.002 mm clay0.079 0.932 −0.083 团聚度 Soil aggregation degree 0.178 0.101 0.947 分散系数 Soil dispersion coefficient −0.873 −0.396 −0.114 特征值 Characteristic value 4.872 3.855 1.399 贡献率 Contribution rate/% 40.596 32.123 11.662 累计贡献率
Cumulative contribution rate/%40.596 72.720 84.382 注:Y1、Y2、Y3表示12个土壤抗蚀性指标经主成分分析后得到的3个主成分。Notes: Y1, Y2, Y3 represent the three principal components of 12 soil erosion resistance indexes obtained through principal component analysis. 3.2.2 土壤抗蚀性综合评价
根据主成分Y1、Y2、Y3的特征值及因子载荷矩阵进行相关运算,得到研究区刺槐林(16年生)土壤抗蚀性的综合表达式如下,以此计算出不同密度刺槐林土壤抗蚀性综合指数并进行排序(表7)。
表 7 不同密度刺槐林土壤抗蚀性综合评价Table 7. Comprehensive evaluation of soil anti-erodibility with different densities of Robinia pseudoacacia林分密度/(株·hm−2)
Stand density/(tree·ha−1)土层深度
Soil depth/cm得分 Score 排序
OrderY1 Y2 Y3 Y 0 ~ 30 cm Y平均值Y average value in 0 − 30 cm 1 025 0 ~ 10 1.070 −1.224 −0.195 0.022 −0.553 5 10 ~ 20 −0.532 −0.482 −0.018 −0.442 20 ~ 30 −1.934 −1.121 0.851 −1.240 1 300 0 ~ 10 1.075 1.497 −0.170 1.064 0.343 2 10 ~ 20 0.118 0.421 −0.785 0.109 20 ~ 30 −0.792 1.159 −1.464 −0.142 1 575 0 ~ 10 0.968 0.807 2.301 1.091 0.590 1 10 ~ 20 0.259 0.675 1.434 0.580 20 ~ 30 −0.846 1.615 −0.787 0.099 1 800 0 ~ 10 1.250 0.0371 −0.542 0.541 −0.060 3 10 ~ 20 0.503 −0.820 −0.846 −0.187 20 ~ 30 −0.003 −1.166 −0.650 −0.535 2 150 0 ~ 10 0.916 −1.170 0.178 0.020 −0.320 4 10 ~ 20 −0.500 −0.346 −0.278 −0.411 20 ~ 30 −1.552 0.118 0.970 −0.568 Y=0.481\;1Y_{1} + 0.380\;7Y_{2} + 0.138\;2Y_{3} (13) 各刺槐林样地中,土壤抗蚀性随土层的加深逐渐减弱,0 ~ 10 cm土层土壤抗蚀性最强,具体表现为1 575株/hm2 > 1 300株/hm2 > 1 800株/hm2 > 1 025株/hm2 > 2 150株/hm2;10 ~ 20 cm和20 ~ 30 cm土层内土壤抗蚀性表现为1 575株/hm2 > 1 300株/hm2 > 1 800株/hm2 > 2 150株/hm2 > 1 025株/hm2。综合3个土层的土壤抗蚀性情况,可认为随刺槐林分密度增大(1 025 ~ 1 575株/hm2),土壤抗蚀性逐渐增强,在密度大于1 575株/hm2后有减弱的趋势。
以刺槐林分密度为x轴,以土壤抗蚀性综合指数为y轴建立函数关系,方便从土壤抗蚀性角度预测研究区刺槐林(16年生)的最佳林分密度。如图4所示,二者具有开口向下的抛物线函数关系。
![]() 图 4 刺槐林分密度与土壤抗蚀性综合指数的函数关系Figure 4. Functional relationships between stand density and soil erosion resistance index of Robinia pseudoacacia
图 4 刺槐林分密度与土壤抗蚀性综合指数的函数关系Figure 4. Functional relationships between stand density and soil erosion resistance index of Robinia pseudoacaciay = - 2.683 \times {10^{ - 6}}{x^2} + 0.009x - 6.375({R^2} = 0.77) (14) 对该函数求解发现:当刺槐林分密度为1 590株/hm2时,土壤抗蚀性最强,综合指数为0.403。因此从土壤抗蚀性角度,建议今后研究区林龄为16年生刺槐林的经营密度以1 590株/hm2为宜。
4. 讨 论
土壤抗蚀性作为评估土壤抵抗侵蚀营力的重要参数,其强弱主要取决于土壤对水的亲和力及土粒间的胶合力[22],但同时又受理化性质、植被覆盖、人为活动等多种因素的影响[4],截至目前尚未确定普遍适用的评价指标。本研究结果表明:土壤密度、有机质含量、 > 0.25 mm水稳性团聚体质量分数、平均质量直径、几何平均直径、土壤分形维数和分散系数7个指标对土壤抗蚀性的影响最明显,是表征晋西黄土区刺槐林(16年生)土壤抗蚀性的关键指标。但马西军[23]同在晋西黄土区的研究发现,评价该区不同类型坡面土壤抗蚀性强弱的最佳指标是团聚度、有机质含量、土壤分形维数、< 0.001 mm黏粒质量分数和抗蚀指数。这与本研究结果相似,但不完全一致,主要因为研究对象存在明显差异,本文研究对象为刺槐纯林(16年生)。
由于气候、枯落物、植物根系等综合作用,土壤理化性质在垂直分布上存在差异,进而对不同深度土壤抗蚀性产生影响。本研究发现:刺槐林土壤抗蚀性随土层加深逐渐减弱,表层土壤抗蚀性优于深层。表层土壤首先受到枯落物的保护和改良作用,枯落物直接覆盖于土壤表面,有效保护土壤抵抗以水力为主的机械破坏;同时经微生物分解腐化作用,枯落物可在地表形成高度松散的腐殖质层[24],增加了土壤有机质含量,从而增强土壤抗蚀性。其次,草本植物在表层土壤形成了密集的根系网络,根系及根系分泌物不仅向土壤中输送了大量的有机质,还通过缠绕固结作用促进了土壤团粒结构的形成,提高了土壤稳定性[25]。还有研究表明,表层土壤的黏粒在水土流失过程中更易散失,促使黏粒向下淋溶,增加了深层土壤中黏粒质量分数,而过量的黏粒会堵塞土壤孔隙,导致水分难以下渗,形成地表径流,从而加剧土壤侵蚀[26]。综上所述,深层土壤无法得到和表层土壤相同的保护、改良作用,所以土壤抗蚀性较弱,更易被侵蚀,如果表层土壤被破坏,将会造成更严重的水土流失,因此在生产活动中要注意保护表层土壤。
同一植被类型不同密度条件下土壤抗蚀性有显著差异。吕刚等[14]对荆条的研究和李萍[27]对松嫩草地的研究均表明,植被密度越大,土壤抗蚀性越强。本研究中,随刺槐林分密度的增大(1 025 ~ 1 575株/hm2),土壤抗蚀性逐渐增强,在密度大于1 575株/hm2后减弱,这与上述研究结论类似,但不完全相同,可能与研究区气候、土壤、植被条件有关。林分密度是影响林木生长发育的重要限制因子,它通过调节光、水、肥、热等环境资源的配置改变林内微环境,影响着下层植物群落的结构和组成,关系到枯落物的数量与质量,从而对土壤结构和养分输入产生影响[28],导致土壤抗蚀性出现差异。调查显示(表2),随刺槐林分密度增大,其林下灌草群落的物种丰富度指数、多样性指数、均匀度指数和枯落物蓄积量基本呈先增后减的变化趋势,并几乎都在密度为1 575株/hm2时达到峰值,这种趋势与土壤抗蚀性的表现一致,故可以以此解释不同密度刺槐林土壤抗蚀性存在的差异。当林分密度较低时,刺槐稀疏分布,郁闭度较低,林内光照充足有利于阳生植物的萌发,促进其繁衍生息,但此时物种结构较为单一,多样性水平较低,限制了枯落物的积累,植物根系网络也不够发达,导致土壤养分匮乏,结构不稳定,削弱了土壤抗蚀性。随林分密度增大,刺槐林内郁闭增强、光照减少、温度下降,为许多中生、阴生植物创造了有利生态位,使其迁入栖息,丰富了林下灌草植物组成,有利于地上枯落物的积累和地下根系网络的发展,可有效改善土壤质地,促进团粒结构的形成,增强其抗蚀性。但当林分密度持续增大,林内光照条件变差,制约了植物幼树和幼苗的生长发育,同时种间和种内竞争加剧,刺槐枝条出现“自疏”现象,一些灌草植物逐渐被淘汰,降低了物种多样性,使枯落物蓄积量减少[29],土壤养分含量下降,抗蚀性减弱。而适宜的中密度林分能维持较多植物种类平衡共存[30],林下灌草种类丰富、多样性较高且分布更加均匀,植被更新和演替能力较强,整体功能较为稳定,有利于土壤抵抗外力侵蚀。此外,林龄和海拔、坡度、坡向等立地因子对土壤抗蚀性也有一定影响,需进一步综合考虑。
5. 结 论
(1)通过主成分分析可知,土壤密度、有机质含量、> 0.25 mm水稳性团聚体质量分数、平均质量直径、几何平均直径、土壤分形维数和分散系数7个指标对土壤抗蚀性的影响最明显,是评价晋西黄土区刺槐林(16年生)土壤抗蚀性强弱的关键指标。
(2)研究区刺槐林表层土壤抗蚀性优于深层土壤。0 ~ 30 cm土层内,随刺槐林分密度的增大(1 025 ~ 1 575株/hm2),土壤抗蚀性逐渐增强,在密度大于1 575株/hm2后逐渐减弱,适宜的中密度刺槐林分土壤抗蚀性较强。
(3)刺槐林分密度(x)与土壤抗蚀性综合指数(y)具有开口向下的抛物线函数关系:y = −2.683 × 10−6x2 + 0.009x − 6.375(R2 = 0.77)据此预测刺槐林分密度为1 590 株/hm2时,土壤抗蚀性最强,综合指数为0.403。因此从土壤抗蚀性角度,建议今后研究区刺槐林(16年生)的经营密度以1 590株/hm2为宜,对于密度过低或过高的林分,在满足林业生产的同时及时进行科学补植或间伐,还应注意保护表层土壤,以充分发挥林地的水土保持功能,有效控制土壤侵蚀。
-
![]()
图 3 兴安落叶松林林内及林外空地积雪深度特征
Figure 3. Snow depth characteristics inside and outside Larix gemelinii forest
![]()
图 5 兴安落叶松林雪水当量特征
Figure 5. characteristics of snow water equivalence of larix gmelinii forest
![]()
图 6 积雪融雪期日蒸发量动态变化特征
Figure 6. Dynamic variation characteristics of daily evaporation during snowcover and snowmelting period
![]()
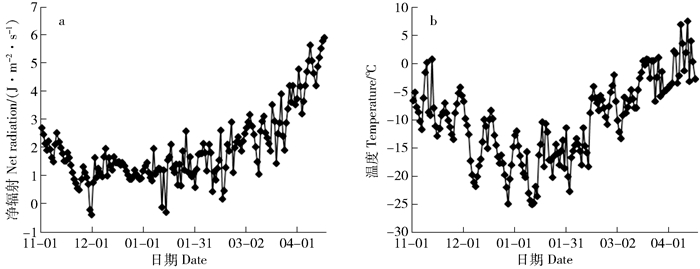
图 7 积雪融雪期气象因子的动态变化特征
Figure 7. Dynamic variation characteristics of meteorological factors during snowcover and snowmelting period
表 1 兴安落叶松天然林林冠截留特征
Table 1 Canopy interception characteristics of Larix gmelinii forest
降雪级别
Snowfall level林外降雪量
Snowfall outsideforest/mm林内降雪量
Snowfall insideforest/mm林冠截留量
Canopy interception/mm林冠截留率
Canopy interception rate/%小雪Light snow 1.94 1.63 0.31 15.7 中雪Moderate snow 2.73 2.46 0.27 9.8 大雪Heavy snow 5.88 5.35 0.53 9.04 暴雪Blizzard 20.63 19.28 1.35 6.5  下载: 导出CSV
表 2 不同气象因子与积雪蒸发量的灰色关联度
Table 2 Grey correlation degree of different meteorological factors and snowcover evaporation
因子Factor 环境温度
Environment temperature/℃环境湿度
Environment humidity/%水汽压
Water vapor pressure/kPa风速
Wind speed/(m·s-1)净辐射
Net radiation/(MJ·m-2·d-1)积雪期蒸发量Snow period evaporation 0.831 1 0.741 2 0.541 1 0.544 6 0.896 5 融雪期蒸发量Snowmelting period evaporation 0.827 8 0.686 6 0.533 4 0.582 7 0.856 6
下载: 导出CSV
-
[1] 刘世荣, 常建国, 孙鹏森.森林水文学:全球变化背景下的森林与水的关系[J].植物生态学报, 2007, 31(5):753-756. http://d.old.wanfangdata.com.cn/Periodical/zwstxb200705001 Liu S R, Chang J G, Sun P S. Forest hydrology: forest and water in a context of global change[J]. Journal of Plant Ecology, 2007, 31 (5):753-756. http://d.old.wanfangdata.com.cn/Periodical/zwstxb200705001
[2] 盛后财, 蔡体久, 琚存勇.小兴安岭白桦林降水转化过程元素特征分析[J].北京林业大学学报, 2015, 37(2):59-66. doi: 10.13332/j.cnki.jbfu.2015.02.009 Sheng H C, Cai T J, Ju C Y. Element characteristics in the precipitation conversion process in Betula platyphlla forest of Xiaoxing'an Mountains, northeastern China[J]. Journal of Beijing Forestry University, 2015, 37 (2):59-66. doi: 10.13332/j.cnki.jbfu.2015.02.009
[3] 王增艳, 车涛. 2002—2009年中国干旱区积雪时空分布特征[J].干旱区研究, 2012, 29(3): 464-467. http://www.wanfangdata.com.cn/details/detail.do?_type=perio&id=ghqyj201203014 Wang Z Y, Che T. Spatiotemporal distribution of snow cover in arid regions in China[J]. Arid Zone Research, 2012, 29(3): 464-467. http://www.wanfangdata.com.cn/details/detail.do?_type=perio&id=ghqyj201203014
[4] Wei X, Liu S, Zhou G, et al. Hydrological processes in major types of Chinese forest[J]. Hydrological Processes, 2005, 19(1):63-75. http://cn.bing.com/academic/profile?id=ccec2017c9ca1ef970d1dedffceb46a4&encoded=0&v=paper_preview&mkt=zh-cn
[5] Dozlier J. Snow, snowmelt, rain, runoff, and chemistry in a Sierra Nevada Watershed[Z]. Final Report to California Air Resources Board, 1989: 16-26.
[6] Martinet J. Rango A. Paramenter values for snowmelt runoff modeling[J]. Journa1 of Hydrology, 1986, 84(3-4):197-219. http://cn.bing.com/academic/profile?id=6a99879c59f02f9b9a5b642dcab50102&encoded=0&v=paper_preview&mkt=zh-cn
[7] Sokratov S A. Parameters influencing the recrystallization rate of snow[J]. Cold Regions Science and Technology, 2001, 33(2-3): 263-274. doi: 10.1016/S0165-232X(01)00053-2
[8] Pomeroy J W, Brun E. Physical properties of snow[M]//Jones H G, Pomeroy J W, Walker D A, et al. Snow ecology: an interdisciplinary examination of snow-covered ecosystems. Cambridge: Cambridge University Press, 2001: 45-126.
[9] 白重媛, 大畑哲夫.天山乌鲁木齐河源1号冰川夏季消融期内反射率的变化[J].冰川冻土, 1989, 11(4): 311-324. http://www.cnki.com.cn/Article/CJFDTotal-BCDT198904002.htm Bai Z Y, Ohata T. Variations of albedo on the glacier No.1 at the head water of Urumqi River, Tianshan Moutains, during the summer ablation period[J]. Journal of Glaciology and Geocryology, 1989, 11(4): 311-324. http://www.cnki.com.cn/Article/CJFDTotal-BCDT198904002.htm
[10] 谢应钦, 张金生.雪层内太阳的穿透辐射[J].冰川冻土, 1988, 10(2): 135-142. http://www.cnki.com.cn/Article/CJFDTOTAL-BCDT198802004.htm Xie Y Q, Zhang J S. Solar penetration radiation in snow layers[J]. Journal of Glaciology and Geocryology, 1988, 10(2):135-142. http://www.cnki.com.cn/Article/CJFDTOTAL-BCDT198802004.htm
[11] Kormos P R, Marks D, McNamara J P, et al. Snow distribution, melt and surface water inputs to the soil in the mountain rain-snow transition zone[J]. Journal of Hydrology, 2014, 519:190-204. doi: 10.1016/j.jhydrol.2014.06.051
[12] Schelker J, Kuglerová L, Eklöf K, et al. Hydrological effects of clear-cutting in a boreal forest-snowpack dynamics, snowmelt and streamflow responses[J]. Journal of Hydrology, 2013, 484: 105-114. doi: 10.1016/j.jhydrol.2013.01.015
[13] Michael A, Rawlins, Kyle C, et al. Remote sensing of snow thaw at the pan-Arctic scale using the seawinds scatterometer[J]. Journal of Hydrology, 2005, 312(1-4):294-311. doi: 10.1016/j.jhydrol.2004.12.018
[14] Bernier P Y. Microwave remote sensing of snowpack properties: potential and limitations[J]. Nordic Hydrology, 1987, 18(1): 1-20. http://d.old.wanfangdata.com.cn/OAPaper/oai_doaj-articles_bac5a3a177fc5f9ac0af5e29a5f820e4
[15] 王雪芹, 张元明, 蒋进, 等.古尔班通古特沙漠南部沙垄水分动态:兼论积雪融化和冻土变化对沙丘水分分异作用[J].冰川冻土, 2006, 28(2):262-268. doi: 10.3969/j.issn.1000-0240.2006.02.017 Wang X Q, Zhang Y M, Jiang J, et al. Variation pattern of soil water content in longitudinal dune in the southern part of Gurbantêggêt Desert: how snowmelt and frozen soil change affect the soil moisture[J]. Journal of Glaciology & Geocryology, 2006, 28(2):262-268. doi: 10.3969/j.issn.1000-0240.2006.02.017
[16] 王贺, 蔡体久, 满秀玲, 等.小兴安岭不同类型人工林林内积雪特征[J].水土保持学报, 2012, 26(6):263-267, 273. http://d.old.wanfangdata.com.cn/Periodical/trqsystbcxb201206052 Wang H, Cai T J, Man X L, et al. Characteristics of snowpack in different planted forests of Xiaoxing'anling[J]. Journal of Soil and Water Conservation, 2012, 26(6):263-267, 273. http://d.old.wanfangdata.com.cn/Periodical/trqsystbcxb201206052
[17] 李奕, 蔡体久, 盛后财, 等.大兴安岭地区天然樟子松林降雪截留及积雪特征[J].水土保持学报, 2014, 28(5):124-128. http://d.old.wanfangdata.com.cn/Periodical/trqsystbcxb201405022 Li Y, Cai T J, Sheng H C, et al. Characteristics of the snow interception and the snowpack in Scotch pine forest in Great Xing'an Mountains[J]. Journal of Soil and Water Conservation, 2014, 28(5):124-128. http://d.old.wanfangdata.com.cn/Periodical/trqsystbcxb201405022
[18] 俞正祥, 蔡体久, 朱宾宾.大兴安岭北部主要森林类型林内积雪特征[J].北京林业大学学报, 2015, 37(12):100-107. doi: 10.13332/j.1000-1522.20150175 Yu Z X, Cai T J, Zhu B B. Characteristics of snowpack in major forest types of northern Daxing' anling Mountains, northeastern China[J]. Journal of Beijing Forestry University, 2015, 37(12):100-107. doi: 10.13332/j.1000-1522.20150175
[19] Zhang J, Ashjian C, Campbell R, et al. The influence of sea ice and snow cover and nutrient availiability on the formation of massive under-ice phytoplankton blooms in the Chukchi Sea[J]. Deep Sea Research Part Ⅱ: Topical Studies in Oceanography, 2015, 118:122-135. doi: 10.1016/j.dsr2.2015.02.008
[20] Golding D L, Swanson R H. Snow distribution patterns in clearings and adjacent forest[J]. Water Resources Research, 1986, 22(13): 1931-1940. doi: 10.1029/WR022i013p01931
[21] Martinee J. Expected snow loads on structure from incomplete hydrological data[J]. Journal of Glaciology, 1977, 19(81):185-195. doi: 10.1017/S0022143000029270
[22] Wever N, Schmid L, Heilig A, et al. Verification of the multi-layer SNOWPACK model with different water transport schemes[J]. The Cryosphere, 2015, 9(6): 2271-2293. doi: 10.5194/tc-9-2271-2015
[23] 杨俊华, 秦翔, 吴锦奎, 等.祁连山老虎沟流域春季积雪属性的分布及变化特征[J].冰川冻土, 2012, 34(5):1092-1093. http://d.old.wanfangdata.com.cn/Periodical/bcdt201205010 Yang J H, Qin X, Wu J K, et al. Distribution and variation of spring snow cover in Laohugou Watershed of the Qilian Mountains[J]. Journal of Glaciology and Geocryology, 2012, 34(5):1092-1093. http://d.old.wanfangdata.com.cn/Periodical/bcdt201205010
[24] 高培, 魏文寿, 刘明哲.中国西天山季节性积雪热力特征分析[J].高原气象, 2012, 31(4): 1075-1078. http://d.old.wanfangdata.com.cn/Periodical/gyqx201204022 Gao P, Wei W S, Liu M Z. Characteristic analysis on temperature change in snow layer in Western Tianshan Mountain in China[J]. Plateau Meteorology, 2012, 31(4): 1075-1078. http://d.old.wanfangdata.com.cn/Periodical/gyqx201204022
[25] 陆恒, 魏文寿, 刘明哲, 等.季节性森林积雪融雪期雪层含水率垂直廓线与时间变化特征[J].地理研究, 2011, 30(7):1245-1248. http://d.old.wanfangdata.com.cn/Periodical/dlyj201107010 Lu H, Wei W S, Liu M Z, et al. A study on the vertical profile of forest snow liquid water content and variation with time in the snowmelt period[J]. Geographical Research, 2011, 30(7):1245-1248. http://d.old.wanfangdata.com.cn/Periodical/dlyj201107010
[26] 刘家霖, 满秀玲.降雨和非降雨日兴安落叶松天然林蒸腾及蒸散发特征[J].生态学报, 2017, 37(15):5059-5069. http://d.old.wanfangdata.com.cn/Periodical/stxb201715014 Liu J L, Man X L.Characteristics of transpiration and evapo-transpiration from natural Larix gmelinii forests on rainy and non-rainy days[J]. Acta Ecologica Sinica, 2017, 37(15):5059-5069. http://d.old.wanfangdata.com.cn/Periodical/stxb201715014
[27] 刘海亮, 蔡体久, 满秀玲, 等.小兴安岭主要森林类型对降雪、积雪和融雪过程的影响[J].北京林业大学学报, 2012, 34(2): 20-25. http://j.bjfu.edu.cn/article/id/9722 Liu H L, Cai T J, Man X L, et al. Effects of major forest types of Xiaoxing'an Mountains on the process of snowfall, snow cover and snow melting[J]. Journal of Beijing Forestry University, 2012, 34(2):20-25. http://j.bjfu.edu.cn/article/id/9722
[28] 李辉东, 关德新, 吴家兵, 等.长白山阔叶红松林冬季雪面蒸发特征[J].应用生态学报, 2013, 24(4):1039-1046. http://d.old.wanfangdata.com.cn/Periodical/yystxb201304022 Li H D, Guan D X, Wu J B, et al. Characteristics of evaporation over broadleaved Korean pine forest in Changbai Mountains, Northeast China during snow cover period in winter[J]. Chinese Journal of Applied Ecology, 2013, 24(4):1039-1046. http://d.old.wanfangdata.com.cn/Periodical/yystxb201304022
[29] Mcjannet D, Vertessy R. Effects of thinning on wood production, leaf area index, transpiration and canopy Interception of a plantation subject to drought[J]. Tree Physiology, 2011, 21 (12/13): 1001-1008. http://cn.bing.com/academic/profile?id=de705ad9c3839e0d39309fb425d6fb00&encoded=0&v=paper_preview&mkt=zh-cn
[30] Bulcock H H, Jewitt G P W. Spatial mapping of leaf area index using hyperspectral remote sensing for hydrological application with a particular focus on canopy interception[J]. Hydrology and Earth System Science, 2010, 14(2): 383-392. doi: 10.5194/hess-14-383-2010
[31] Rutter N, Essery R, Pomeroy J, et al. Evaluation of forest snow processes models (SnowMIP2)[J/OL]. Journal of Geophysical Research: Atmospheres, 2009, 114[2017-08-11]. http://onlinelibrary.wiley.com/doi/10.1029/2008JD011063/full.
[32] Varhola A, Coops N C, Weiler M, et al. Forest canopy effects on snow accumulation and ablation: an integrative review of empirical results[J]. Journal of Hydrology, 2010, 392(3): 219-233. http://cn.bing.com/academic/profile?id=e815be270bf9fff351eb43f73e52a547&encoded=0&v=paper_preview&mkt=zh-cn
[33] Boon S. Snow ablation energy balance in a dead forest stand[J]. Hydrological Processes, 2009, 23(18): 2600-2610. doi: 10.1002/hyp.v23:18
[34] Coughlan J C, Running S W. Regional ecosystem simulation: a general model for simulating snow accumulation and melt in mountainous terrain[J]. Landscape Ecology, 1997, 12(3):119-136. doi: 10.1023/A:1007933813251
[35] Lee Y H, Mahrt L. An evaluation of snowmelt and sublimation over short vegetation in land surface modeling[J]. Hydrological Processes, 2004, 18: 3543-3557. doi: 10.1002/hyp.5799
[36] Suzuki K, Nakai Y. Canopy snow influence on water and energy balances in a coniferous forest plantation in northern Japan[J]. Journal of Hydrology, 2008, 352(1): 126-138. http://cn.bing.com/academic/profile?id=483a6d8db5f9163138b01bbf53530c1b&encoded=0&v=paper_preview&mkt=zh-cn
[37] Lundberg A, Calder I, Harding R. Evaporation of intercepted snow: measurement and modeling[J]. Journal of Hydrology, 1998, 206(3-4): 151-163. doi: 10.1016/S0022-1694(97)00016-4
-
期刊类型引用(6)
1. 宋学雨,简尊吉,王少博,党英侨,魏可,王小艺,肖文发. 松材线虫入侵对湖北三峡地区马尾松林水源涵养能力的影响. 林业科学研究. 2024(01): 10-20 .  百度学术
百度学术
2. 黄金莲,崔鸿侠,唐万鹏,胡琛,马致远,雷静品. 虫害对华山松人工林土壤酶活性及碳氮磷化学计量特征的影响. 林业科学. 2023(10): 128-137 . 百度学术
3. 周岚,巫大宇,吕秋实,李贤伟,苏宇,郭茂金,尹海锋,吕倩. 松材线虫侵染的马尾松人工林细根形态及生物量分异特征. 生态学报. 2022(15): 6274-6286 . 百度学术
4. 高瑞贺,骆有庆,石娟. 松材线虫入侵对马尾松树光合特性的影响. 林业科学研究. 2019(01): 65-73 . 百度学术
5. Ruihe Gao,Youqing Luo,Zhuang Wang,Hanjun Yu,Juan Shi. Patterns of biomass, carbon, and nitrogen storage distribution dynamics after the invasion of pine forests by Bursaphelenchus xylophilus (Nematoda: Aphelenchoididae) in the three Gorges Reservoir Region. Journal of Forestry Research. 2018(02): 459-470 . 必应学术
6. 宋秀虎. 寄生线虫入侵对恩施州园林植物平面构成的拓扑性质影响分析. 科技通报. 2016(10): 63-67 . 百度学术
其他类型引用(4)


计量
- 文章访问数: 1405
- HTML全文浏览量: 329
- PDF下载量: 22
- 被引次数: 10
