
Relationship between stand spatial structure and DBH increment of principal species in natural spruce-fir mixed forest in Changbai Mountains of northeastern China
-
摘要:目的 混交林的稳定性、发展的可能性与空间结构密切相关,探究空间结构对林分生长量的影响对促进林分良性发展有着重要作用。本研究以天然云冷杉针阔混交林为对象,分析混交度(M)和大小比数(U)对单木生长量的影响,以期为该地区天然林林分结构调整提供科学依据和指导。方法 选用2块云杉蓄积占总蓄积比例分别为0.1~0.2(1成云,1P)和0.4(4成云,4P)固定样地的5期监测数据,采用4株相邻木法计算空间结构三参数,绘制多元分布图,分析了1P和4P内各径级云杉、臭冷杉和红松在不同混交度和大小比数的胸径生长量变化规律。结果 1P和4P均介于中度和强度混交(M分别为0.625和0.657)且呈随机分布;臭冷杉和红松的生长介于亚优势至中庸状态间(U = 0.25 ~ 0.50),云杉在4P内介于亚优势至中庸状态间(U = 0.48),在1P内介于中庸至劣势状态间(U = 0.70)。云杉和臭冷杉的年胸径生长量随径级的增大而增大(P < 0.05);随对象木混交度的增大而增大,其中小径级云杉和大中小径级臭冷杉与混交度呈显著相关(P < 0.05);云杉、臭冷杉和红松的年胸径生长量随对象木大小比数的增大而减小,其中中径级木与大小比数呈显著相关(P < 0.05)。云杉在1P内的年胸径生长量低于4P,红松相反。结论 不同径级下林木的生长具有显著差异,降低大小比数的同时适当提高混交度有利于林木的胸径生长。不同生长阶段的竞争不同导致了不同径级林木对混交度和大小比数响应的差异,故针对不同生长阶段的林木应采取不同的经营措施调整优化林分结构,促进林分长期的稳定发展。Abstract:Objective The stability and development possibility of mixed forest are closely related to its spatial structure. Exploring the influence of spatial structure on stand growth plays an important role in promoting the benign development of forest.Method Based on the 5 periods of monitoring data of two fixed sample plots, the proportion of spruce (Picea jezoensis) accumulation in the sample plot was 0.1−0.2 and 0.4, respectively, which were recorded as 1P and 4P. The three parameters of spatial structure were calculated by 4 adjacent tree methods, and the multivariate distribution map was drawn. The changes of DBH increment of spruce, fir (Abies nephrolepis) and Korean pine (Pinus koraiensis) under different diameter classes, mingling degrees and neighborhood comparison in 1P and 4P were compared and analyzed.Result 1P and 4P were both medium and strong mixed (M was 0.625 and 0.657, respectively) and randomly distributed. The growth of fir and Korean pine was between sub-dominant state and median state (U = 0.25 − 0.50), the growth of spruce was between sub-dominant state and median state (U = 0.48) in 1P, and was between median state and inferior state in 4P (U = 0.70). The annual DBH increment of spruce and fir increased with the increase of DBH class (P < 0.05) and the mingling degree of subject trees, and the DBH increment of small-diameter spruce and large, medium and small diameter’s fir was significantly correlated with mingling degree (P < 0.05). The annual DBH increment of spruce, fir and Korean pine decreased with the increase of subject trees’ neighborhood comparison, and the correlation between the DBH increment of mid-diameter tree and dominance was significant (P < 0.05). The annual DBH increment of spruce in 1P was lower than that in 4P cloud, while that of Korean pines was opposite.Conclusion There are significant differences in the growth of trees under different diameter classes. Reducing the neighborhood comparison and appropriately increasing the mingling are beneficial to the DBH growth of trees. The competition in different growth stages leads to the difference in the response of different diameter classes to mingling degree and neighborhood comparison. Therefore, different management measures should be taken to adjust and optimize the stand structure to promote the long-term stable development of stand.
-
Keywords:
- spruce-fir forest /
- DBH increment /
- spatial structure /
- DBH class /
- neighborhood comparison /
- mingling degree
-
随着工业化进程的加快,社会发展对矿产资源的需求程度越来越大,大规模开采造成矿区植被破坏和水土流失[1-3]。张宣矿区作为河北省三大铁矿矿集区之一,在带动当地经济发展的同时也造成了大量尾矿堆积,形成了众多的裸露创面和次生裸地,这类废弃地肥力低下、植被稀少,严重影响矿区及周边环境[4-6]。因此,植被恢复和土壤改良已成为矿区生态环境改善的首要任务[7]。人工植被措施是铁尾矿库生态重建的重要环节, 恢复措施选取的好坏也直接决定了生态恢复效果[8]。
近年来,矿区生态修复取得了一定的成果,比较热门的研究方向有恢复措施筛选[9]、植物种选配[10-11]、土壤改良[12-14]和重金属污染治理[15-16]等。侯永莉等[17]认为,原矿土 + 黄土 + 刺槐(Robinia pseudoacacia)组合模式对铁矿废弃地生态修复效果最佳。李想等[18]通过研究表明,有机肥 + 保水剂配施对尾矿土壤结构和养分改良效果比其他模式更好,并确定了最优配比。由此可见,适生植物种的选择与生境的创造是矿区生态修复的关键所在。但目前关于矿区生态修复措施的研究仍存在技术种类多、技术适应性不强和修复效果差等问题,导致矿区生态恢复进展缓慢,因而有必要就不同植被模式对铁尾矿的生态恢复效果做进一步研究。生态恢复效果评价可以为生态恢复提供反馈信息,是调整和改进恢复方案的重要手段。灰色关联分析(GRA)、模糊数学分析和主成分分析作为目前主流的评价方法,得到的评价结果具有较强的客观性与数学理论依据[19-21];CRITIC法是一种基于对比强度和冲突性指标的客观赋权法,可以避免人为主观臆断的影响[22]。基于以上,本研究在CRITIC法确定权重的基础上,借助灰色关联度模型来完成计算分析,从而全面提升评价结果的准确性。
2022年的冬奥会,给予张宣矿区生态恢复巨大的推动力。以该矿区铁尾矿库植被模式为研究对象,综合评价分析其生态恢复效果,旨在为张宣矿区优势植被模式的选择和环境条件的改善提供参考。
1. 研究区概况
研究区位于河北省张家口市赤城县西部、宣化区东部(40°32′38″ ~ 41°25′27″N,115°25′19″ ~ 116°26′34″E),地处河北省北部山区,海拔1 100 ~ 2 100 m之间。属中温带半干旱大陆性季风气候,年平均气温6.5 ℃,无霜期145 d,多年平均降水量约为450 mm。褐土和棕壤土为主要土壤类型,土层较薄,肥力较低,氮磷钾分布不均匀。赤城县森林覆盖率57.57%,宣化区森林覆盖率27%,乡土植物有油松(Pinus tabuliformis)、侧柏(Platycladus orientalis)、荆条(Vitex negundo)、草木犀(Melilotus officinalis)等。目前研究区内约有130座铁尾矿库,其中仅有25%左右的尾矿库存在治理措施。
2. 研究方法
2.1 样地选择
2019年7月对张宣矿区铁尾矿库进行调查,获取样地基本情况(表1)。选择尾矿库13个坡面恢复区域,恢复年限为3 ~ 5年,未治理区域作为对照。本研究选择的坡向以阳坡为主,坡度为缓坡(5° ~ 15°)或斜坡(15° ~ 25°),斜坡居多。选取的恢复区域包括3种典型恢复措施,覆土整地植苗恢复(A):全面覆土,厚度约为40 cm,采用穴状整地,乔木、灌木树种均为植苗造林;覆土自然恢复(B):全面覆土,厚度约为40 cm,未进行整地,所有植被均为自然恢复;自然恢复(C):铁尾矿库裸露坡面,未进行人为治理。
表 1 样地基本情况Table 1. General condition of sample plots编号
No.恢复措施
Restoration measure植被模式
Vegetation pattern坡向
Aspect坡度
Slope/(°)海拔
Altitude/m栽植密度/
(株·hm−2) Planting density/(plant·ha−1)恢复年份
Restoration yearⅠ A 油松 + 元宝枫
Pinus tabuliformis + Acer truncatum阳坡 Sunny slope 10 1 315 750 2015 Ⅱ 油松 + 洋白蜡
Pinus tabuliformis + Fraxinus pennsylvanica阳坡 Sunny slope 10 1 315 780 2015 Ⅲ 油松
Pinus tabuliformis阳坡 Sunny slope 15 1 305 820 2015 Ⅳ 油松 + 胡枝子
Pinus tabuliformis + Lespedeza bicolor阳坡 Sunny slope 18 1 129 760 2014 Ⅴ 沙棘 + 胡枝子
Hippophae rhamnoides + Lespedeza bicolor阳坡 Sunny slope 15 1 137 3 650 2014 Ⅵ 紫穗槐 + 胡枝子
Amorpha fruticosa + Lespedeza bicolor阳坡 Sunny slope 25 1 181 2 980 2014 Ⅶ 沙棘
Hippophae rhamnoides阳坡 Sunny slope 20 1 310 4 350 2015 Ⅷ 胡枝子
Lespedeza bicolor阳坡 Sunny slope 18 1 182 2 800 2016 Ⅸ 紫穗槐
Amorpha fruticosa阳坡 Sunny slope 27 1 167 3 230 2014 Ⅹ B 黄芪 + 狗尾草
Astragalus membranaceus + Setaria viridis阳坡 Sunny slope 14 1 221 2016 Ⅺ 草木犀 + 披碱草
Melilotus officinalis + Elymus dahuricus阴坡 Shady slope 25 1 130 2016 Ⅻ 芦苇 + 野艾蒿
Phragmites communis + Artemisia lavandulaefolia阳坡 Sunny slope 28 1 309 2016 Ⅹ Ⅲ 野艾蒿 + 牛筋草
Artemisia lavandulaefolia + Eleusine indica阴坡 Shady slope 18 1 154 2016 Ⅹ Ⅳ C 裸露尾矿
Bare tailings阴坡 Shady slope 30 1 200 2014 注:A、B和C分别为覆土整地植苗恢复、覆土自然恢复和自然恢复,Ⅹ ~ Ⅹ Ⅳ中未出现乔木或灌木种,因此未进行栽植密度测定。Notes: A, B and C are soil preparation and planting restoration, natural restoration and natural restoration, respectively, no tree or shrub species are found in pattern Ⅹ−Ⅹ Ⅳ, so planting density is not determined. 在每个恢复区域设置3个20 m × 20 m的标准样地,并在每个样地内的四角和对角线交点区域共布设5个5 m × 5 m的灌木样方和5个1 m × 1 m的草本样方。记录样方内植物种类、高度、盖度等。在每个样方内随机取3个0 ~ 20 cm、20 ~ 40 cm深的土壤样品,将所有样品带回实验室进行测定。
2.2 指标测定与方法
各样方植被盖度使用基于DJIPhantom 4 型无人机可见光图像提取,物种重要值和植物多样性指数参考下列公式计算[23]。采用pH计法测定样品pH值,重铬酸钾稀释热法测定有机质,碱解氮扩散法测定速效氮,钼锑抗比色法测定速效磷,火焰光度计法测定速效钾[24]。
重要值 = (相对密度 + 相对频度 + 相对盖度)/ 3
Shannon-Wiener 多样性指数:
H=−∑Sy=1Py⋅lnPy Margalef 丰富度指数:
M=(S−1)/lnN Pielou 均匀度指数:
E=H/lnS 式中:
Py 为物种y在样方中的数量占比,即Py=Ny/N ,其中Ny 为样方内物种y的个体数,N 为样方内所有个体数;S 为样方内植物种类总数。2.3 数据处理与分析
采用Excel 2019进行数据处理,采用Pearson法分析不同模式植被指标和土壤指标的相关性,使用SPSS 24进行CRITIC权重计算(表2)和灰色关联分析,采用Origin 2021进行制图,参考前人相关研究成果[25-27]和土壤农化分析(第3版)设立各指标分级标准(表2)。
表 2 各指标权重与评价标准Table 2. Index weight and evaluation standard指标 Index 权重 Weight 优 Excellent 良 Credit 中 Medium 差 Poor H 0.15 > 0.7 0.7 ~ 0.5 0.5 ~ 0.3 < 0.3 M 0.12 > 10 10 ~ 7.5 7.5 ~ 5 < 5 E 0.12 > 0.7 0.7 ~ 0.5 0.5 ~ 0.3 < 0.3 植被盖度 Vegetation coverage/% 0.10 > 60 60 ~ 40 40 ~ 20 < 20 pH值 pH value 0.03 6.5 ~ 8.5 — — — 有机质 Organic matter/(g·kg−1) 0.12 30 ~ 20 20 ~ 15 15 ~ 10 < 10 速效氮 Available nitrogen/(mg·kg−1) 0.13 120 ~ 90 90 ~ 60 60 ~ 45 < 45 速效磷 Available phosphorus/(mg·kg−1) 0.15 20 ~ 10 10 ~ 5 5 ~ 3 < 3 速效钾 Available potassium/(mg·kg−1) 0.07 150 ~ 100 100 ~ 50 50 ~ 30 < 30 注:H. Shannon-Wiener 多样性指数;M. Margalef 丰富度指数;E. Pielou均匀度指数。下同。Notes: H, Shannon-Wiener diversity index; M, Margalef richness index; E, Pielou evenness index. The same below. 2.4 CRITIC –GRA法
将试验所得数据规范化后作为比较序列,表示为Xi(i = 0,1,···,14),代表模式Ⅰ到Ⅹ Ⅳ。选取各指标的最优值作为最优序列X0(k),k = {1,2,···,m},m即为k的取值。 W 为权重,分辨系数ρ = 0.5。参考公式(1)计算各序列与参考序列的关联系数S。
Si(k)=min (1) 采用CRITIC权重法确定各指标权重W,参考公式(2)对关联系数求加权平均值得到加权关联度R。
{R}=\frac{1}{m}\sum _{k=1}^{m}{W}_{k} \cdot S_i\left(k\right) (2) 3. 结果与分析
3.1 不同植被模式下植被恢复情况
3.1.1 植物生长特征
由不同模式的植物生长特征(表3)知,在本研究区含乔木的模式中,乔木平均树高为185.11 ~ 519.63 cm,平均胸径为2.29 ~ 9.05 cm,平均冠幅为149.77 ~ 302.75 cm,乔木郁闭度为19% ~ 34%。油松 + 洋白蜡(Fraxinus pennsylvanica)模式的乔木生长特征均显著优于其他模式。油松 + 胡枝子(Lespedeza bicolor)模式仅次于油松 + 洋白蜡模式。灌木和草本平均高分别为45.68 ~ 189.25 cm、5.73 ~ 90.28 cm,其中以沙棘(Hippophae rhamnoides)和紫穗槐(Amorpha fruticosa)为主的覆土自然恢复措施的灌木平均株高显著高于其他模式,自然恢复措施的草本平均高度显著高于其他两种措施。
表 3 不同模式的植物生长特征Table 3. Plant growth characteristics of different patterns编号
No.乔木层
Tree layer灌木层
Shrub layer草本层
Herb layer植被盖度
Vegetation coverage/%树种
Tree species平均树高
Mean tree height/cm平均胸径
Mean DBH/cm平均冠幅
Average crown width/cm平均株高
Mean plant height/cm平均株高
Mean plant height/cmⅠ 油松
Pinus tabuliformis217.58 ± 9.95c 2.81 ± 0.19b 187.62 ± 15.74c 21.99 ± 2.98c 52.30 元宝枫
Acer truncatum265.38 ± 13.83b 2.75 ± 0.21b 176.78 ± 14.05c Ⅱ 油松
Pinus tabuliformis210.67 ± 14.14c 2.29 ± 0.30b 149.77 ± 9.34c 32.84 ± 4.39bc 48.30 洋白蜡
Fraxinus pennsylvanica519.63 ± 35.07a 9.05 ± 0.77a 302.75 ± 2.45a Ⅲ 油松
Pinus tabuliformis185.11 ± 13.83d 2.65 ± 0.23b 174.24 ± 14.94c 13.22 ± 2.25d 64.80 Ⅳ 油松
Pinus tabuliformis213.79 ± 24.14c 8.22 ± 0.85a 224.89 ± 20.38b 53.27 ± 5.74c 8.23 ± 1.76de 72.30 Ⅴ 189.25 ± 16.37a 6.99 ± 0.82e 68.10 Ⅵ 132.33 ± 11.21b 5.73 ± 1.11e 50.30 Ⅶ 176.55 ± 13.95a 8.32 ± 1.45de 85.00 Ⅷ 45.68 ± 3.58c 15.33 ± 3.25d 48.60 Ⅸ 157.54 ± 18.22ab 9.84 ± 0.99de 54.70 Ⅹ 41.37 ± 5.39bc 33.10 Ⅺ 83.91 ± 4.46a 38.20 Ⅻ 90.28 ± 10.26a 36.20 Ⅹ Ⅲ 66.18 ± 7.33b 40.00 注:模式Ⅴ ~ Ⅹ Ⅲ中没有出现乔木树种,Ⅰ ~ Ⅲ和Ⅹ ~ Ⅹ Ⅲ中没有出现灌木树种,模式Ⅹ Ⅳ没有出现任何植物种。不同小写字母分别表示不同模式间差异显著(P < 0.05)。Notes: there are no tree species in pattern Ⅴ−Ⅹ Ⅲ, no shrub species in pattern Ⅹ−Ⅹ Ⅲ and Ⅹ−Ⅹ Ⅳ, and no plant species in pattern Ⅹ Ⅳ. Different lowercase letters indicate significant differences among different patterns (P < 0.05). 基于无人机可见光图像提取并计算的各模式植被盖度(表3)结果表明,所有模式植被盖度均优于自然恢复措施,其中沙棘模式的植被盖度最高(85.00%),油松(64.80%)和油松 + 胡枝子模式(72.30%)植被盖度明显高于油松 + 元宝枫(Acer truncatum)(52.30%)和油松 + 洋白蜡模式(48.30%),草本模式的植被盖度普遍偏低,基本处在40.00%以下,且未治理区域植被盖度最低。
3.1.2 植被群落特征
由不同模式的植物多样性指数(表4)知,多样性指数H处于0.21 ~ 1.88,以乔木为主的覆土整地植苗恢复模式中的多样性指数普遍高于其他模式,其中油松 + 洋白蜡模式最高(1.88)。覆土自然恢复措施的多样性指数普遍较低,其中野艾蒿(Artemisia lavandulaefolia) + 牛筋草(Eleusine indica)模式(0.21)最低。不同模式丰富度指数处于0.33 ~ 1.41,油松 + 洋白蜡(1.41)和油松 + 元宝枫(1.37)等乔木混交林丰富度指数显著高于其他灌草、草本模式。草木犀+披碱草( Elymus dahuricus )模式(0.33)的丰富度指数为所有人工恢复措施中最小。均匀度指数处于0.13 ~ 0.82,油松 + 洋白蜡(0.82)最高、其次为油松 + 胡枝子模式(0.80)。覆土整地植苗恢复措施中以沙棘为主的模式均匀度指数普遍偏低,覆土自然恢复措施中以芦苇(Phragmites communis)、野艾蒿为主的草本模式均匀度指数最低。
表 4 不同模式的植物多样性Table 4. Species diversity of different patterns编号 No. Ⅰ Ⅱ Ⅲ Ⅳ Ⅴ Ⅵ Ⅶ Ⅷ Ⅸ Ⅹ Ⅺ Ⅻ Ⅹ Ⅲ Ⅹ Ⅳ H 1.53 1.88 1.76 1.03 0.60 0.66 0.72 0.55 0.52 0.69 0.44 0.64 0.21 — M 1.37 1.41 0.98 0.94 0.78 0.79 0.51 0.63 0.68 0.98 0.33 0.79 0.47 — E 0.74 0.82 0.80 0.50 0.31 0.34 0.45 0.31 0.29 0.33 0.40 0.32 0.13 — 注:模式Ⅹ Ⅳ没有出现植物种。Note: there are no plant species in pattern Ⅹ Ⅳ. 各模式中乔木树种以油松存在优势最为明显,灌木种类以蔷薇科(Rosaceae)、马鞭草科(Verbenaceae)为主,草本植物以菊科(Compositae)、豆科(Leguminosae)和禾本科(Gramineae)为主。油松模式的林下植被种类最多为7种,沙棘模式最少为4种。覆土整地植苗恢复措施中沙棘的重要值远高于胡枝子、紫穗槐等灌木,因此可以将沙棘作为灌木的优势种。在覆土自然恢复的植被模式中,黄芪(Astragalus membranaceus)、芦苇、野艾蒿的重要值相对其他草本较高,因此可以将此3种植物作为草本植物的优势种。
3.2 不同植被模式下土壤养分情况
3.2.1 土壤pH值
由不同模式的土壤pH值(图1)知:各模式0 ~ 20 cm土层pH值整体低于20 ~ 40 cm土层,但差异不显著。模式Ⅰ ~ Ⅹ Ⅲ中0 ~ 20 cm土层土壤pH值处于7.35 ~ 8.13,20 ~ 40 cm土层土壤pH值为7.44 ~ 8.19,为弱碱性或碱性土。模式Ⅹ Ⅳ中0 ~ 20 cm土层土壤pH值为8.72,20 ~ 40 cm土层pH值为8.82,属强碱性土壤,且自然恢复措施不同土层土壤pH值均显著高于其他模式。覆土整地植苗恢复措施中,沙棘 + 胡枝子模式不同土层土壤pH值显著低于其他模式。覆土自然恢复措施中,草木犀 + 披碱草模式不同土层土壤pH值显著低于其他模式。
![]() 图 1 不同模式的土壤pH值不同小写字母分别表示不同模式间差异显著(P < 0.05)。下同。Different lowercase letters indicate significant differences among varied modes (P < 0.05). The same below.Figure 1. pH values in soil of different patterns
图 1 不同模式的土壤pH值不同小写字母分别表示不同模式间差异显著(P < 0.05)。下同。Different lowercase letters indicate significant differences among varied modes (P < 0.05). The same below.Figure 1. pH values in soil of different patterns3.2.2 土壤有机质
由不同模式的土壤有机质含量(图2)知:各模式0 ~ 20 cm土层的土壤有机质含量显著高于20 ~ 40 cm土层。与未治理的铁尾矿废弃地相比,不同模式均能显著提高土壤有机质含量,恢复模式之间的存在一定差异,但各模式有机质含量依然处于较低水平。在0 ~ 20 cm土层中,沙棘 + 胡枝子模式土壤有机质含量最高,达到16.95 g/kg,是自然恢复措施有机质含量的15倍。相比于0 ~ 20 cm土层,20 ~ 40 cm土层有机质含量整体较低,最高为沙棘 + 胡枝子模式(10.37 g/kg),最低为未治理尾矿废弃地(1 g/kg)。
3.2.3 土壤速效养分
由不同模式0 ~ 20 cm和20 ~ 40 cm土层速效养分含量(图3)知:覆土整地植苗恢复措施和覆土自然恢复措施不同土层速效养分含量均高于自然恢复措施。不同模式0 ~ 20 cm土层的速效氮含量整体显著高于 20 ~ 40 cm土层。油松模式0 ~ 20 cm土层速效氮含量显著高于其他模式。在覆土自然恢复措施中,草木犀 + 披碱草模式0 ~ 20 cm 土层中的速效磷含量显著高于其他模式。油松 + 元宝枫和油松模式20 ~ 40 cm土层速效氮含量显著高于其他模式。覆土整地植苗恢复措施中以胡枝子为主的模式0 ~ 20 cm土层中的速效磷含量显著高于其他模式,其他模式之间无显著差异。各模式0 ~ 20 cm、20 ~ 40 cm土层速效钾含量差异显著。除胡枝子模式外,其他模式0 ~ 20 cm速效钾含量均显著高于20 ~ 40 cm土层。在覆土自然恢复措施中,芦苇 + 野艾蒿模式不同土层的速效钾含量均显著高于其他模式。
3.3 植被和土壤指标相关性分析
由各模式植被和土壤指标相关性分析(图4)可知,Shannon-Wiener多样性指数、Pielou均匀度指数与速效氮呈极显著正相关(P < 0.01),与速效钾呈显著正相关(P < 0.05)。Margalef丰富度指数与各土壤指标均呈弱相关关系(P > 0.05),植被盖度与有机质、速效磷、速效钾呈极显著正相关(P < 0.01),与速效氮呈显著正相关(P < 0.05),与pH值呈弱正相关关系(P > 0.05)。
![]() 图 4 植被和土壤指标的相关性分析VC.植被盖度;pH.pH值;OM.有机质;AN.速效氮;AP.速效磷;AK.速效钾。** 表示P < 0.01水平上极显著相关;* 表示P < 0.05水平上显著相关。VC, vegetation coverage; pH, pH value; OM, organic matter; AN, available nitrogen; AP, available phosphorus; AK, available potassium. ** indicates the correlation is significant at the 0.01 level; * indicates the correlation is significant at the 0.05 level.Figure 4. Correlation analysis of vegetation and soil index
图 4 植被和土壤指标的相关性分析VC.植被盖度;pH.pH值;OM.有机质;AN.速效氮;AP.速效磷;AK.速效钾。** 表示P < 0.01水平上极显著相关;* 表示P < 0.05水平上显著相关。VC, vegetation coverage; pH, pH value; OM, organic matter; AN, available nitrogen; AP, available phosphorus; AK, available potassium. ** indicates the correlation is significant at the 0.01 level; * indicates the correlation is significant at the 0.05 level.Figure 4. Correlation analysis of vegetation and soil index3.4 生态恢复效果评价
本研究中铁尾矿库的恢复年限为3 ~ 5年,仍处于生态恢复初始阶段,故在植被恢复效果方面选取Shannon-Wiener多样性指数、Margalef丰富度指数、Pielou均匀度指数和植被盖度。土壤迟效性养分固定在矿物质和有机质中,不经分解释放,植物不能吸收利用,因此在土壤改良效果方面选取植物可以直接吸收利用的速效养分指标(速效氮、速效磷、速效钾)、土壤pH值、有机质。共计选取9个指标对尾矿库生态恢复效果进行评价,将上述指标进行规范化处理,参照CRITIC-GRA法进行计算得到最终评价结果。
由各模式评价等级(表5)可知:各模式生态恢复效果的关联度处于0.41 ~ 0.80,其中油松(0.80) > 油松 + 洋白蜡(0.72) > 沙棘 + 胡枝子(0.71) > 沙棘(0.68) > 油松 + 胡枝子(0.64) = 紫穗槐 + 胡枝子(0.64) > 油松 + 元宝枫(0.63) > 紫穗槐(0.61) > 胡枝子(0. 60) > 芦苇 + 野艾蒿(0.55) > 草木犀 + 披碱草(0.54)、黄芪 + 狗尾草(Setaria viridis)(0.52) > 野艾蒿 + 牛筋草(0.49) > 未治理(0.41),且9种覆土整地植苗恢复措施和4种覆土自然恢复措施的植被恢复效果均优于自然恢复措施。油松、油松 + 洋白蜡、沙棘 + 胡枝子为研究区内排名前3的模式,评价等级处于“优”,该结果符合上文植被生长及土壤养分状况分析结果。整体来看,覆土整地植苗恢复措施评价等级为“优”或“良”,覆土自然恢复措施评价等级为“中”,仅自然恢复措施评价等级为“差”。
表 5 各模式评价等级Table 5. Evaluation levels of different patterns编号 No. 植被模式 Vegetation pattern 评价等级 Evaluation level 排名 Ranking 优 Excellent
1 ~ 0.70良 Credit
0.69 ~ 0.60中 Medium
0.59 ~ 0.45差 Poor
0.44 ~ 0Ⅰ 油松 + 元宝枫 Pinus tabuliformis + Acer truncatuma 0.63 6 Ⅱ 油松 + 洋白蜡 Pinus tabuliformis + Fraxinus pennsylvanic 0.72 2 Ⅲ 油松 Pinus tabuliformis 0.80 1 Ⅳ 油松 + 胡枝子 Pinus tabuliformis + Lespedeza bicolor 0.64 5 Ⅴ 沙棘 + 胡枝子 Hippophae rhamnoides + Lespedeza bicolor 0.71 3 Ⅵ 紫穗槐 + 胡枝子 Amorpha fruticosa + Lespedeza bicolor 0.64 5 Ⅶ 沙棘 Hippophae rhamnoides 0.68 4 Ⅷ 胡枝子 Lespedeza bicolor 0.60 8 Ⅸ 紫穗槐 Amorpha fruticosa 0.61 7 Ⅹ 黄芪 + 狗尾草 Astragalus membranaceus + Setaria viridis 0.52 11 Ⅺ 草木犀 + 披碱草 Melilotus officinalis + Elymus dahuricus 0.54 10 Ⅻ 芦苇 + 野艾蒿 Phragmites communis + Artemisia lavandulaefolia 0.55 9 ⅩⅢ 野艾蒿 + 牛筋草 Artemisia lavandulaefolia + Eleusine indica 0.49 12 ⅩⅣ 裸露尾矿 Bare tailings 0.41 13 4. 讨 论
植被修复是矿区生态修复的首要之举[28-29]。经以上分析,在尾矿库生态恢复中,油松、油松 + 胡枝子等乔木、乔灌混交林搭配可以有效促进林下灌草生长[25]。覆土整地植苗恢复措施中沙棘对研究区环境的适应性优于其他植被,这与其生长迅速、极耐贫瘠和干旱的生长习性是密切关联的[30]。松针土具有更好的保湿作用且能有效防治土壤侵蚀,松针腐烂后能提供更多的营养给植物,因此油松模式林下草本生长特征优于其他乔木模式[25]。各模式的植被盖度普遍处于中上水平,油松和油松 + 胡枝子模式的植被盖度明显高于其他模式,这可能是因为油松有着较高的郁闭度。在研究区铁尾矿库土壤肥力贫瘠、保水性差的条件下,乔木树种成活率低、生长缓慢,油松作为针叶树种凭借其较强的耐旱性和林下土层较好的持水能力,为矿山废弃地的植被建设带来了良好的生态效益[31]。乔木、乔灌等模式多样性指数普遍高于灌木、灌草等恢复模式,可能是由于灌木层恢复过程缓慢。在群落结构组成方面,草本植物占比较大,多样性指数高于灌木,丰富度指数普遍较差,在不同程度上反映了不同模式的群落结果偏简单,这与韩煜等[32]、任余艳等[33]研究结果相似。
土壤养分的有效性与土壤pH值的变化密切相关[34]。在本研究中,绝大多数模式0 ~ 20 cm土层土壤pH值均低于20 ~ 40 cm土层,但差异不显著,这说明植物对土壤pH值的改良是自上而下的。土壤有机质含量可以衡量土壤养分与肥力好坏,植物根系新陈代谢产物能够增加土壤有机质含量[35]。各模式0 ~ 20 cm土层的土壤有机质含量显著高于20 ~ 40 cm土层,0 ~ 20 cm土层中沙棘 + 胡枝子混交林有机质含量最高,20 ~ 40 cm土层中沙棘 + 胡枝子、芦苇 + 野艾蒿模式均显著高于其他模式,这可能是因为林下枯落物在矿质化过程中形成的腐殖质的积累。土壤中速效养分是衡量土壤中氮、磷、钾素供应的重要指标,可以直接被植物吸收利用[36]。林下枯落物已成为土壤氮、磷、钾等元素重要来源,同时枯落物的积累量和分解速度等也都影响着营养元素的补充[37]。研究发现,该地区土壤富含钾,但缺氮、磷和有机质。综上,植物在生长过程中改良了尾矿库的养分状况,相比自然恢复措施均有所提高,这与周月杰等[38]、任晓旭等[39]的研究结果相符。
土壤提供了植物生长发育所必需的养分,是植物的重要生态因子[12]。在本研究中,Shannon-Wiener多样性指数、Pielou均匀度指数与土壤速效氮、速效钾呈显著正相关,植被盖度与有机质、速效磷、速效钾呈极显著正相关,这主要是由于植物根系与土壤之间具有较大的接触面,植物和土壤通过频繁的物质交换相互影响[25]。油松 + 胡枝子模式植被生长特征优于其他模式,多样性指数及土壤养分含量也处于较优水平。自然恢复的裸露坡面没有任何植物生长,土壤养分含量也偏低。由此可见,土壤养分状况与植物生长及群落特征息息相关[23]。从评价结果来看,油松、油松 + 洋白蜡、沙棘 + 胡枝子3种模式处于“优”,与上文物种组成及重要值分析结果相符。其中沙棘模式恢复效果较其他灌木模式好,这可能是因为在铁尾矿库土壤瘠薄、养分含量少的条件下,人工栽植灌木恢复模式中沙棘纯林苗木规格高,凭借自身适生性强和耐干旱瘠薄特性,比其他植物种更能适应这一环境,因此可以当作铁尾矿库生态恢复的优选植被[39-40]。此外,紫穗槐、胡枝子灌木纯林或其混交模式评价等级处于“良”,这可能是由于它们具有发达的根系,适应能力较强,能够有效增加土壤速效养分含量。而覆土自然恢复措施中所有模式评价等级为“中”,表明单一的草本植物无法改善铁尾矿库植被状况差、土壤养分含量低的现状[25]。自然恢复措施未进行覆土,且尾矿砂孔隙度大、保水保肥性差,植物扎根困难,因而评价等级为“差”。本研究模式样地多设置在阳坡,因此评价结果更适用于阳坡的植被恢复。除模式Ⅰ和Ⅱ外,其他模式样地均处于斜坡(15° ~ 25°)范围,对于坡度大于斜坡的坡面,使用本研究恢复模式前应进行适当削坡处理。基于以上分析,在今后矿山废弃地生态恢复中应加大乔灌木配比,可优先采用覆土整地植苗恢复措施,并适当保证其成活率,如施有机肥或化肥,提高根际周围土壤的养分含量[41]。
5. 结 论
(1)各模式的植被盖度普遍处于中上水平,油松、沙棘、芦苇、野艾蒿分别为研究区内乔木、灌木、草本植物的优势种;乔木、乔灌等模式多样性指数普遍高于灌木、灌草等恢复模式,但丰富度指数普遍较差。植物在生长过程中明显改善了尾矿库土壤的养分状况,相比自然恢复模式均有所提高,不同模式、不同土壤深度对土壤速效氮、速效磷、速效钾和有机质含量均影响显著;该区土壤富含速效钾,但缺乏氮、磷和有机质。
(2)从CRITIC-GRA法得分排名来看,除自然恢复措施评价等级处于“差”,其他措施均处于“中”及以上。覆土整地植苗恢复措施为尾矿库生态恢复最优措施,其中油松、油松 + 洋白蜡、沙棘 + 胡枝子和沙棘模式在研究区内得分排名前3。
(3)建议当地采用覆土整地植苗恢复措施,植物种选择上优先考虑油松 + 沙棘或胡枝子 + 野艾蒿或草木犀,如为加快土壤养分库的改良,可适时施用一定量的氮磷肥和有机肥。
-
![]()
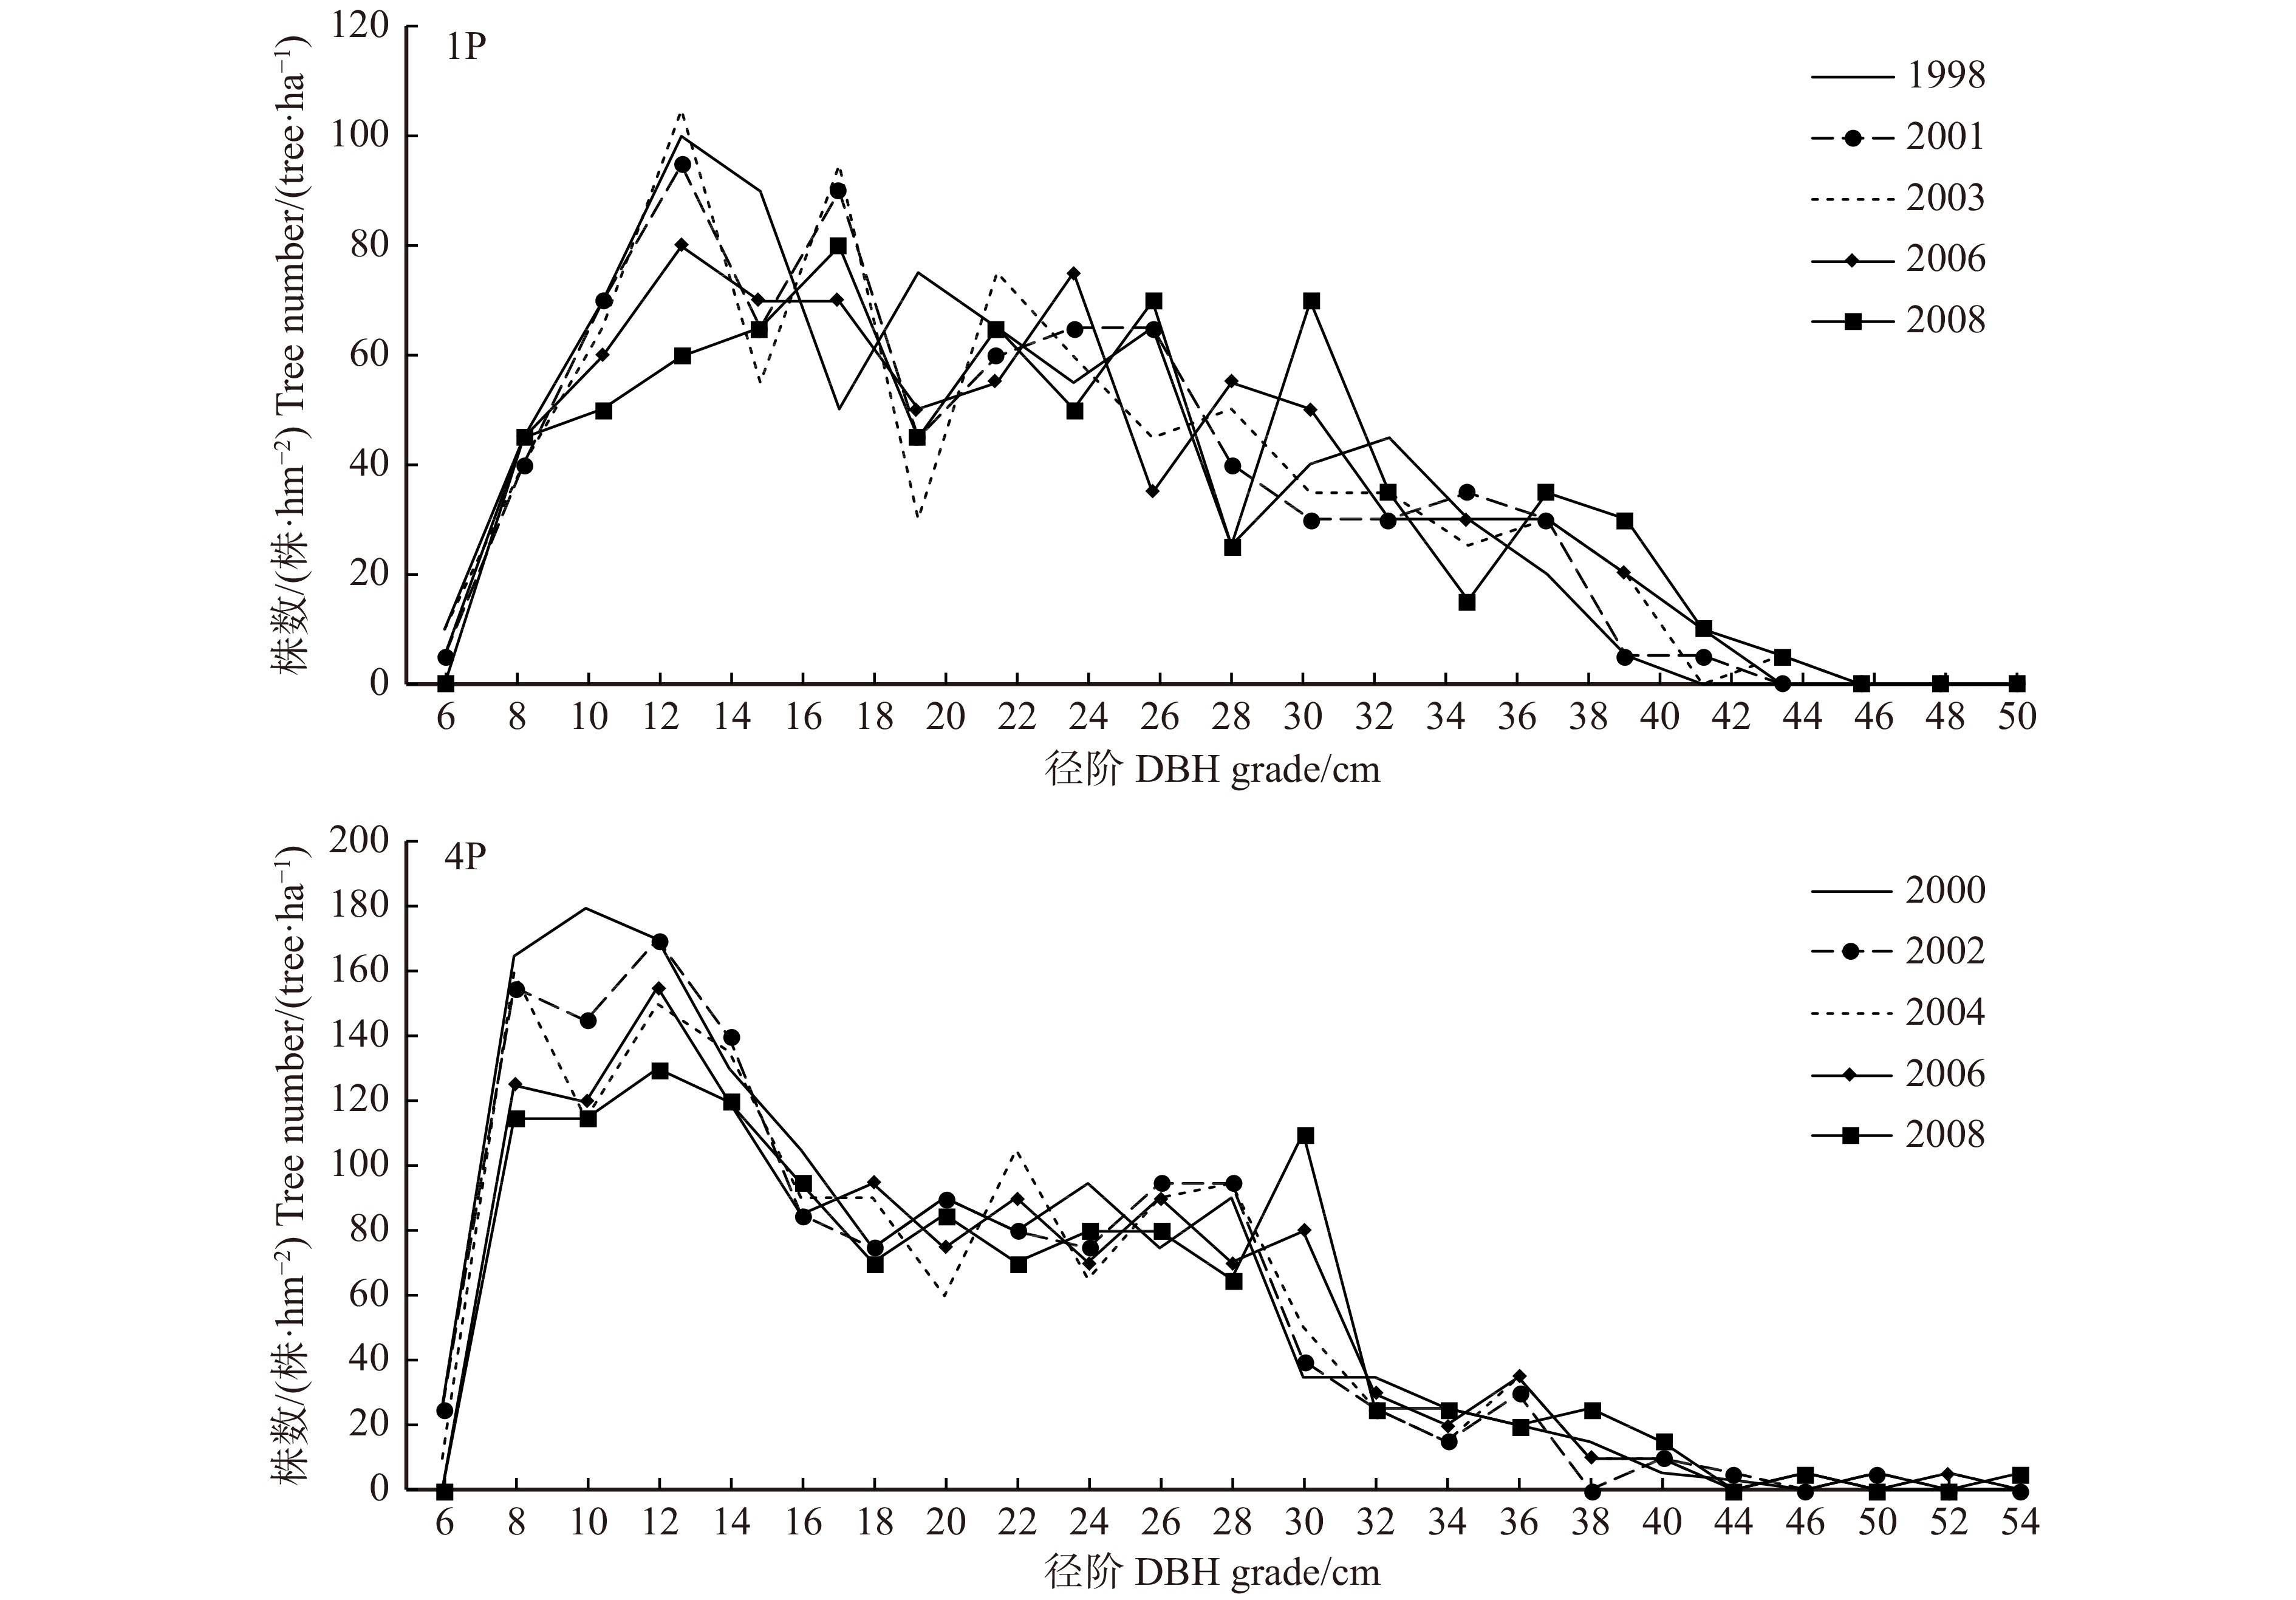
图 2 1P和4P样地内树种、空间结构参数和径级的多元分布
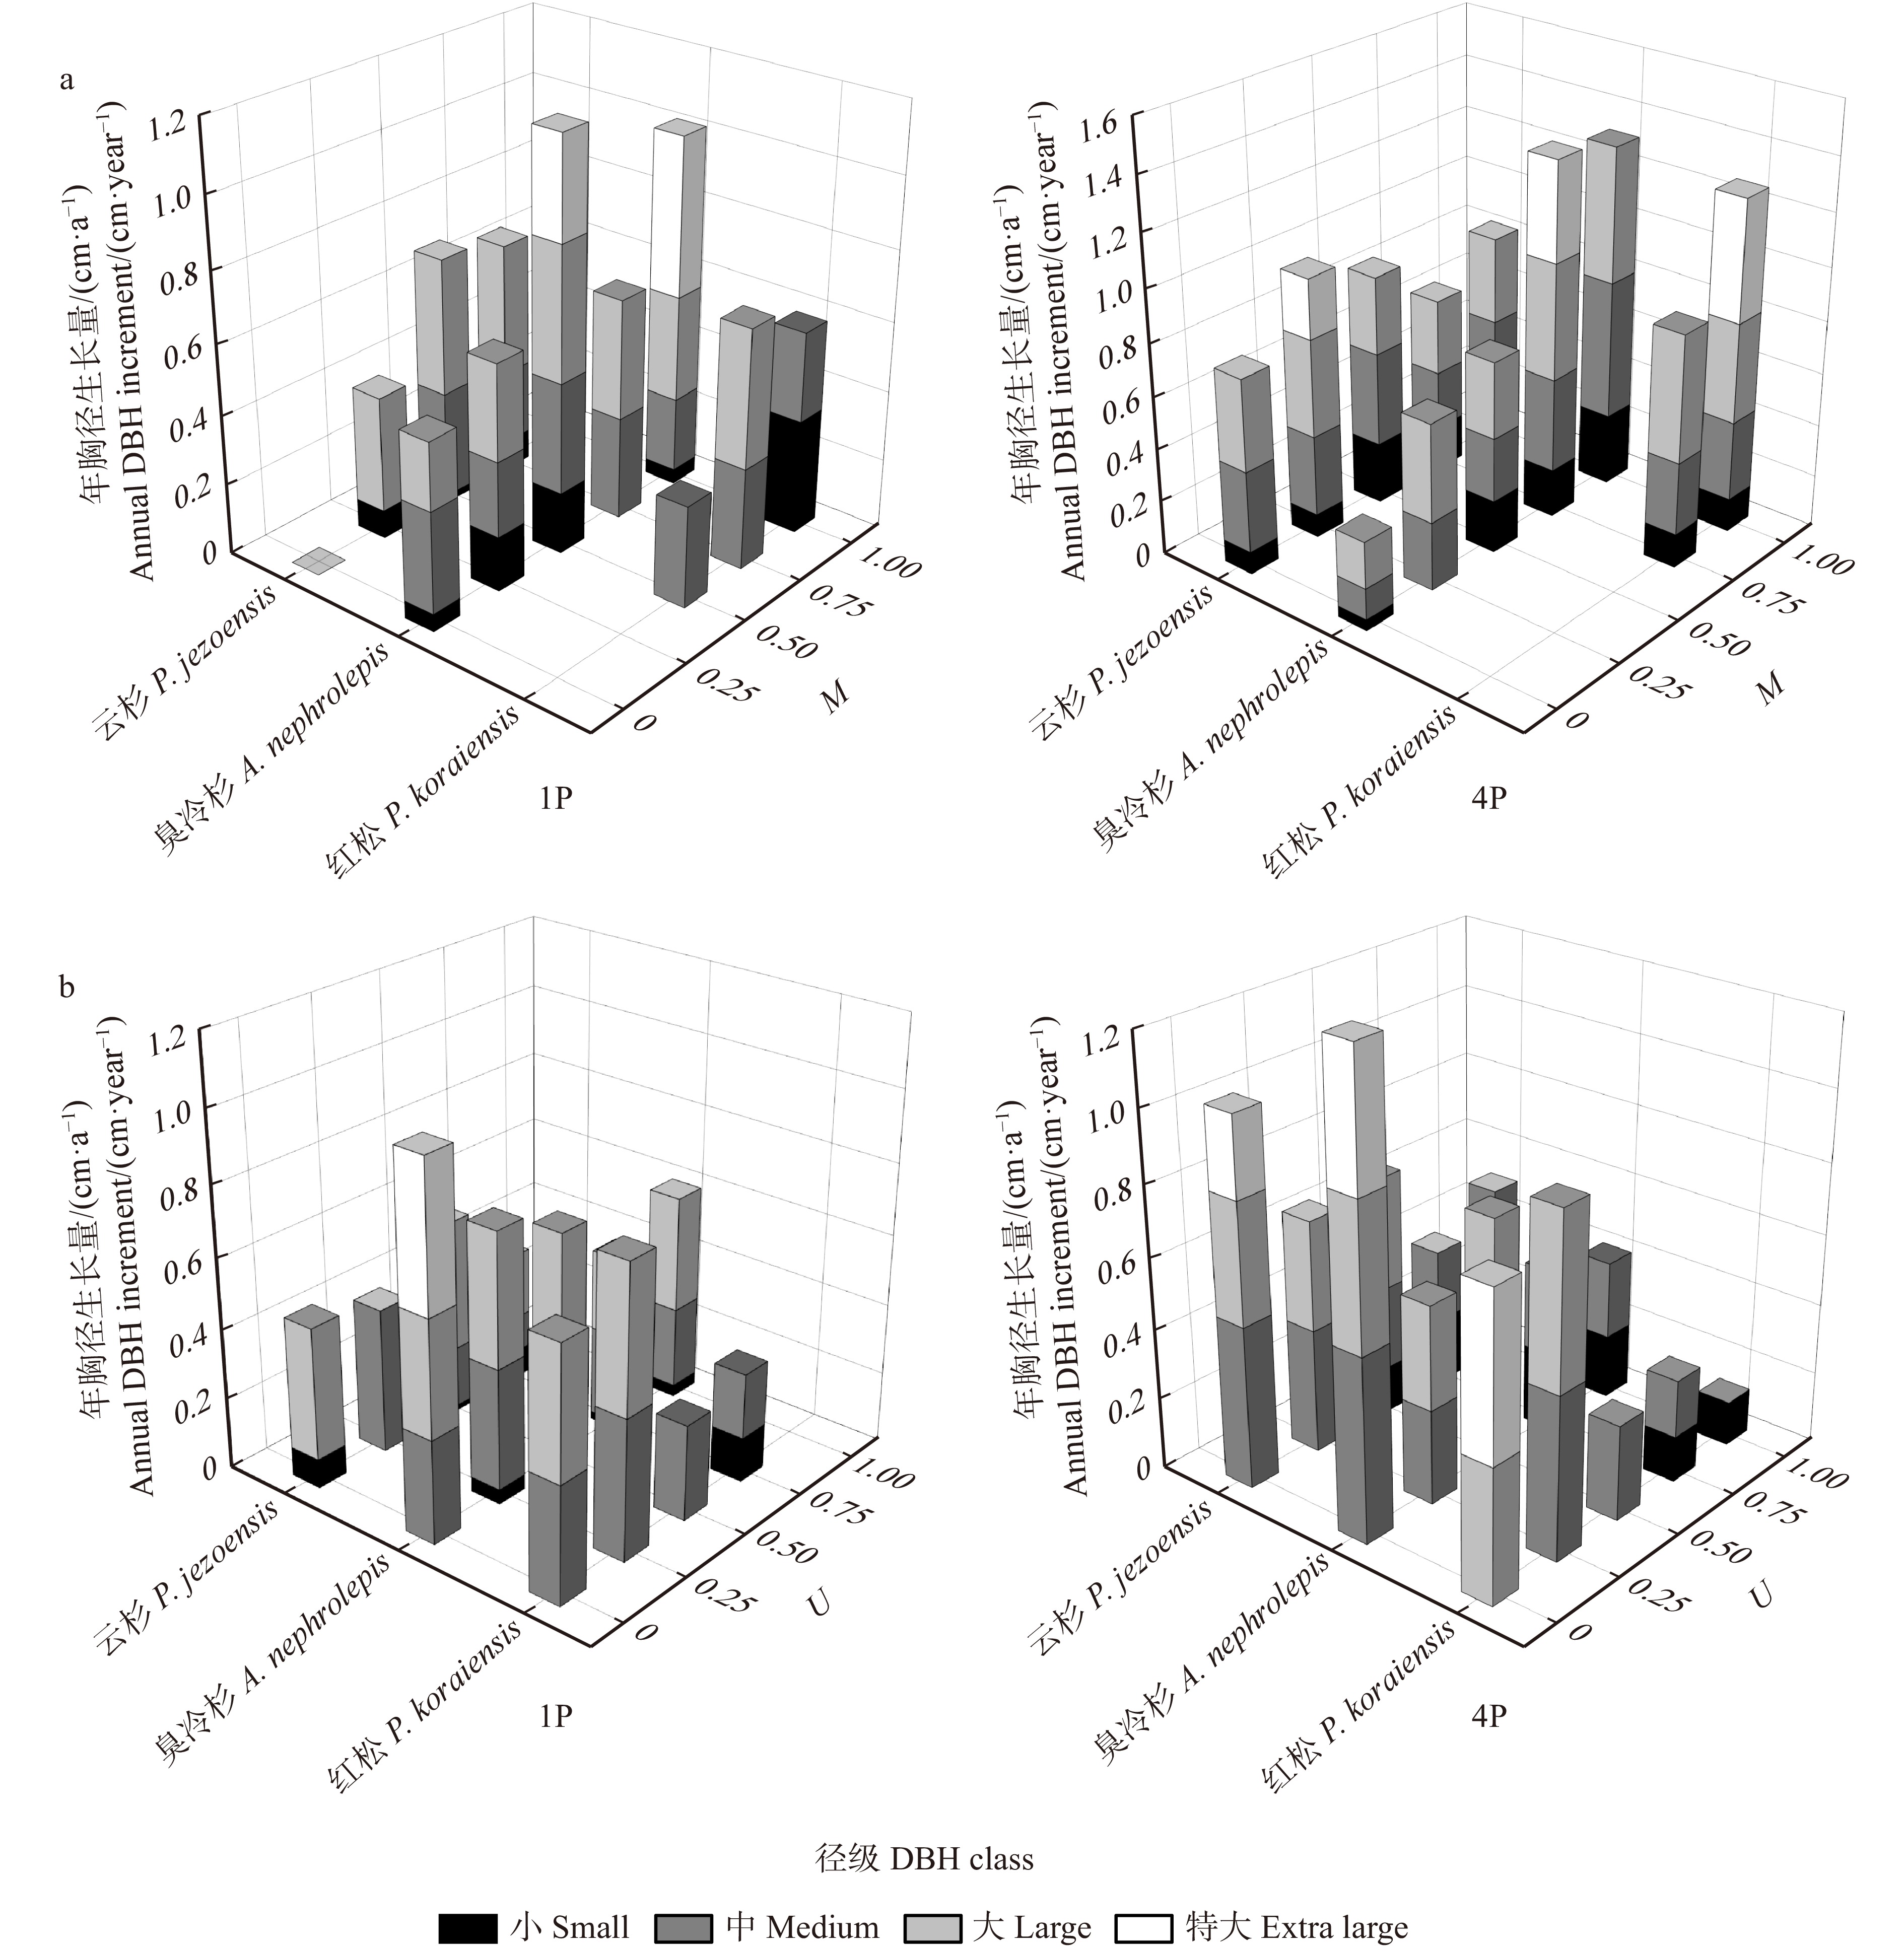
M.混交度;U.大小比数。小.6 ~ 12 cm径阶;中.14 ~ 24 cm径阶;大.26 ~ 36 cm径阶;特大.38 cm 以上径阶。下同。M, mingling degree; U, neighborhood comparison. Small, 6−12 cm DBH grade; medium, 14−24 cm DBH grade; large, 26−36 cm DBH grade; extra, larger than 38 cm DBH grade. The same below.
Figure 2. Multivariate distribution of spatial structure parameters, tree species and DBH class in 1P and 4P
![]()
图 3 1P和4P年胸径生长量随胸径的分布
Figure 3. Distribution of annual DBH increment in relation to DBH in 1P and 4P
![]()
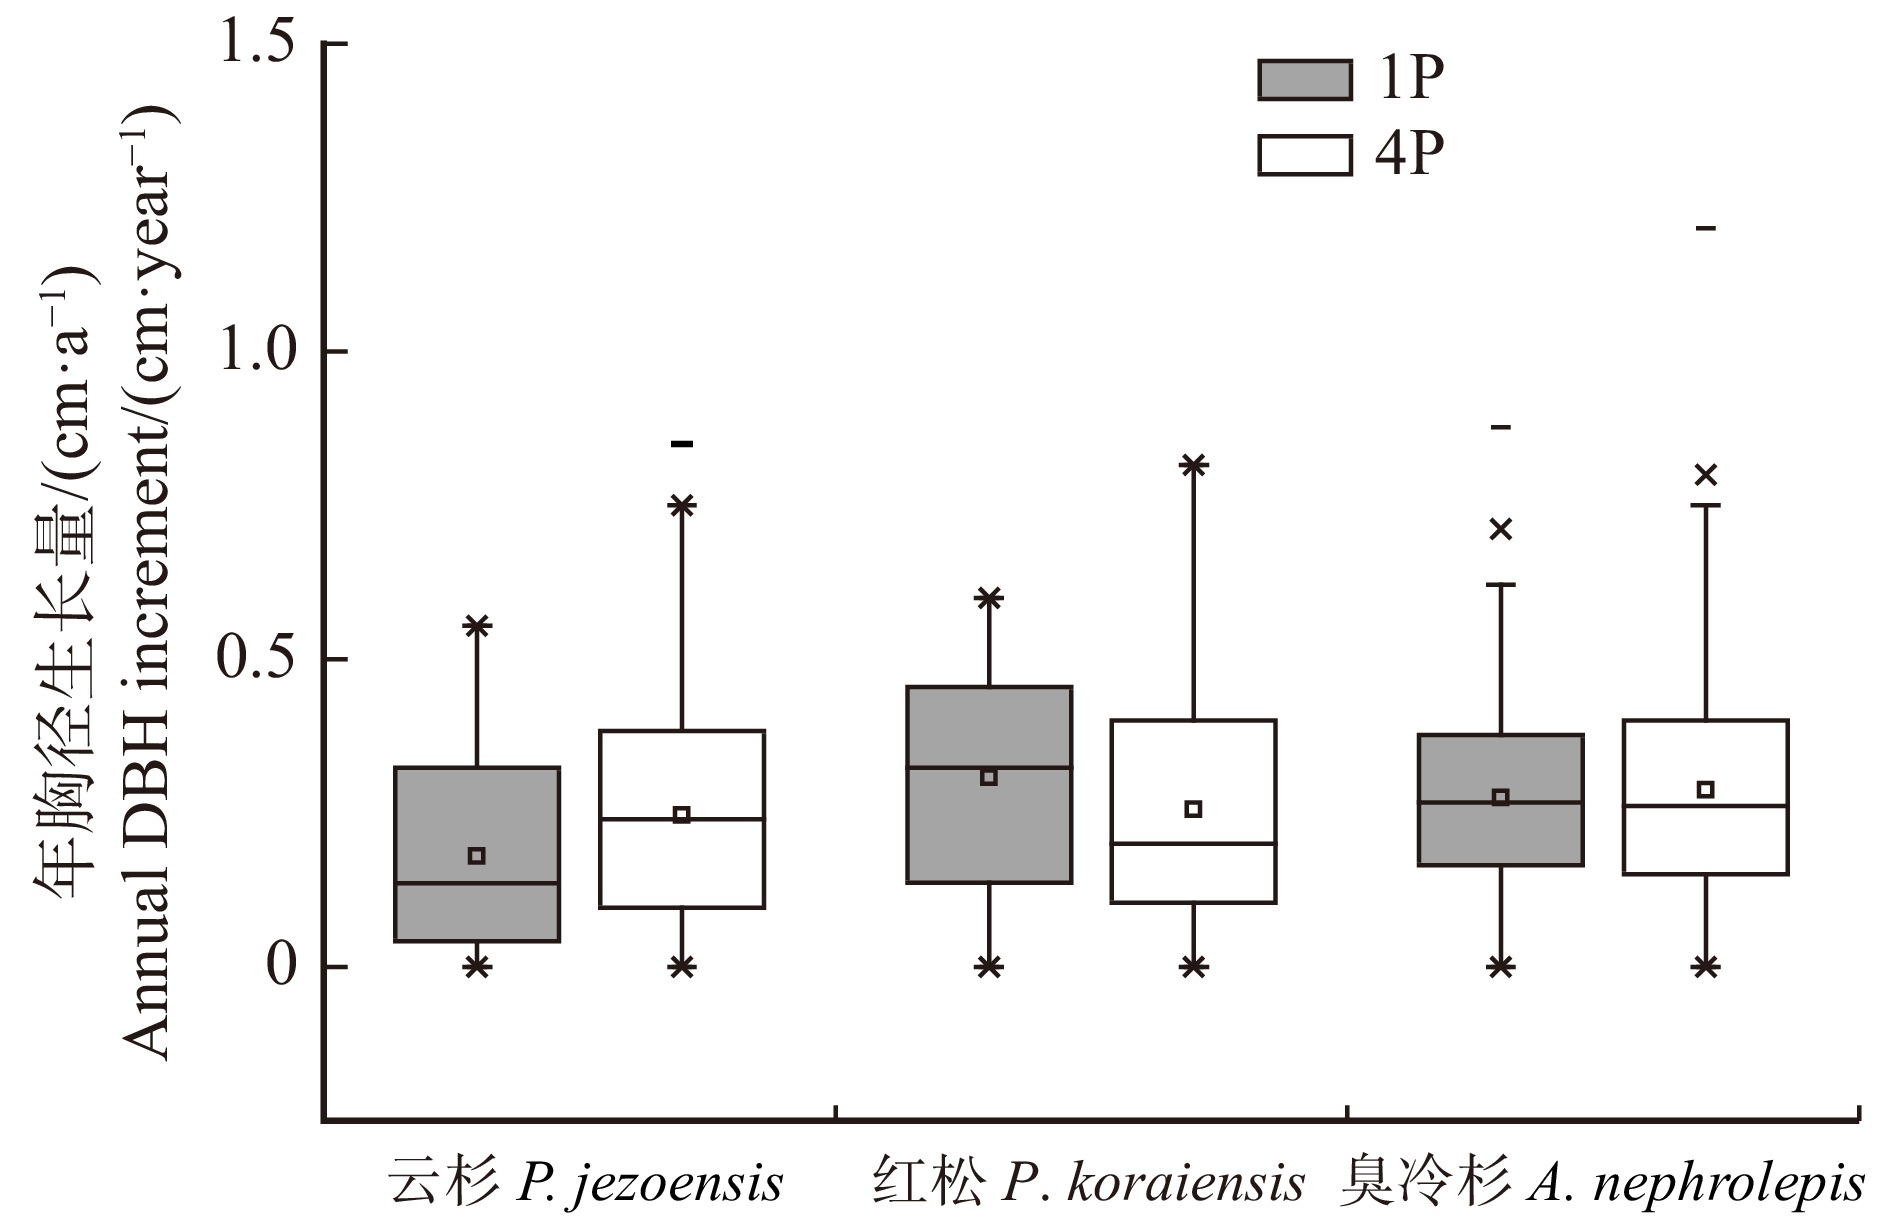
图 4 1P和4P样地内云杉、臭冷杉和红松年胸径生长量
Figure 4. Annual DBH increment of P. jezoensis, A. nephrolepis and P. koraiensis in 1P and 4P
![]()
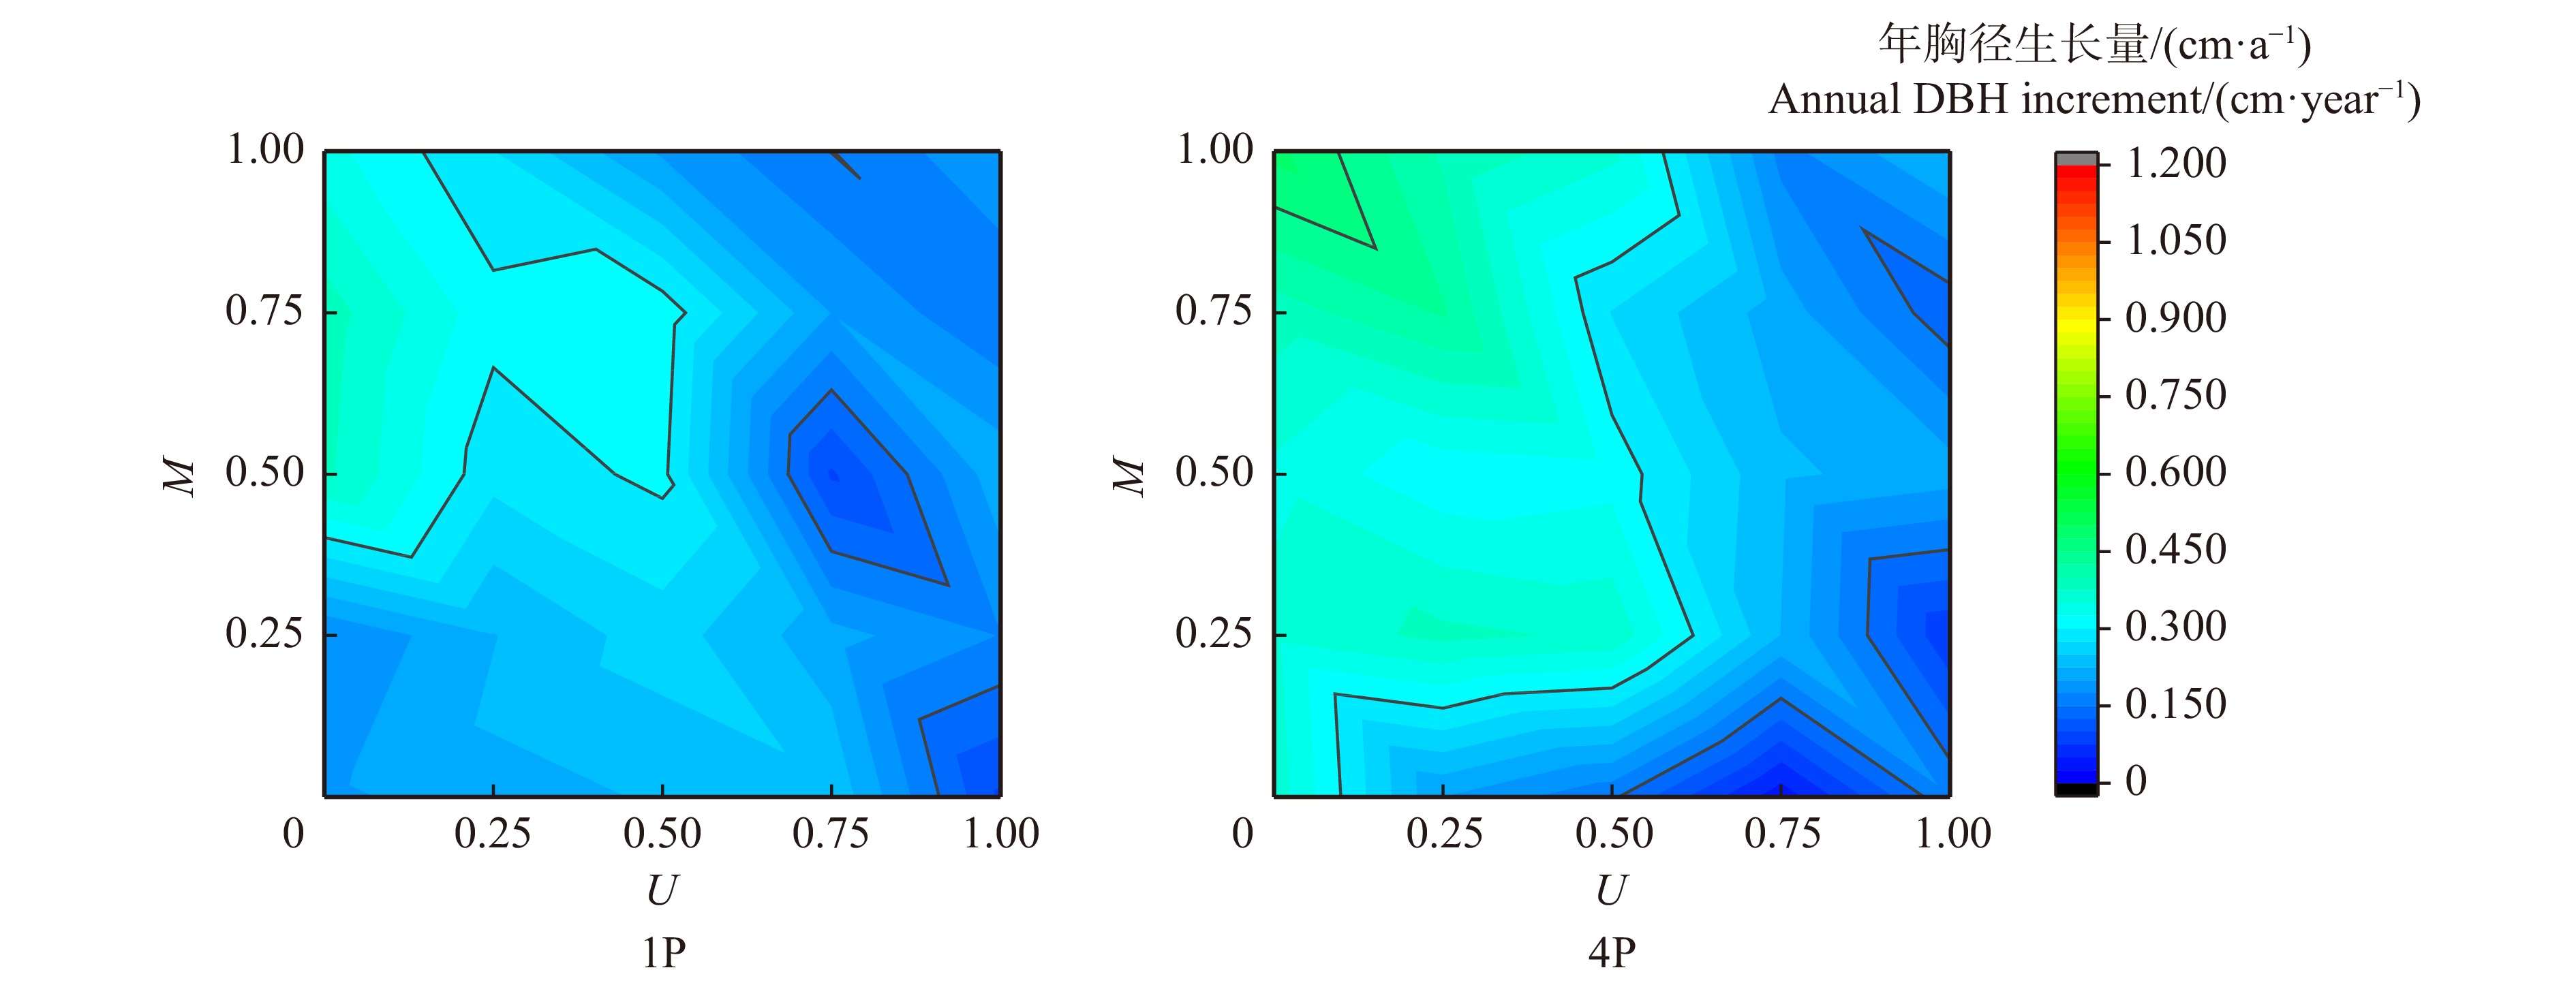
图 5 年胸径生长量随空间结构参数的分布
Figure 5. Distribution of annual DBH increment in relation to the spatial structure parameters
![]()
图 6 不同径级下年胸径生长量随混交度(a)、大小比数(b)的分布
Figure 6. Distribution of annual DBH increment in relation to mingling degree (a) and neighborhood comparison (b) among different diameter classes
表 1 云冷杉固定样地情况及云杉比例
Table 1 Statistic of spruce-fir fixed sample plots and spruce proportion
样地类型
Sample plot type面积/hm2
Area/ha海拔
Altitude/m坡向
Slope aspect坡度
Slope degree/(°)调查年份
Survey year平均
胸径
Mean DBH/cm密度/(株·hm−2)
Density/(tree·ha−1)断面积/(m2·hm−2)
Basal area/
(m2·ha−1)树种组成
Species composition1P 0.200 700 西北 Northwest 8 1998 20.0 795 25.1 7A1P1PK1B 2001 20.4 775 25.4 2003 20.8 785 26.8 2006 21.7 755 27.8 6A2P1PK1B 2008 22.2 760 29.4 6A1P1PK1B + BC 4P 0.312 780 东北 Northeast 10 2000 19.7 929 28.4 4A4P1PK1BC 2002 19.8 875 26.9 2004 20.6 852 28.2 2006 21.1 830 28.9 2008 21.6 810 29.7 注:P.云杉;A.臭冷杉;PK.红松;B.白桦;BC.枫桦;1P和4P分别代表云杉树种组成占1到2成和4成的样地。下同。Notes: P, Picea jezoensis; A, Abies nephrolepis; PK, Pinus koraiensis; B, Betula platyphylla; BC, Betula costata; 1P and 4P stand for sample plots with the species composition of P. jezoensis being 1 to 2 or 4. The same below.  下载: 导出CSV
表 2 不同径级林木年胸径生长量 cm/a
Table 2 Annual DBH increment among different DBH classes
cm/year 树种
Tree species样地类型
Sample plot type径级 DBH class 小 Small 中 Medium 大 Large 特大 Extra large 云杉
P. jezoensis1P 0.08 ± 0.06a 0.18b ± 0.13b 0.37 ± 0.09c − 4P 0.14 ± 0.13a 0.25 ± 0.20b 0.32 ± 0.17c − 臭冷杉
A. nephrolepis1P 0.11 ± 0.10a 0.27 ± 0.14b 0.32 ± 0.15bc 0.41 ± 0.22c 4P 0.18 ± 0.16a 0.29 ± 0.19b 0.36 ± 0.19c − 红松
P. koraiensis1P 0.33 ± 0.01a 0.27 ± 0.18a 0.39 ± 0.12a − 4P 0.11 ± 0.10a 0.28 ± 0.22ab 0.26 ± 0.15ab 0.38 ± 0.16b 注:表中数据为平均值 ± 标准差,不同字母表示不同径级间差异显著(P < 0.05)。Notes: data in the table are all mean ± standard deviation, different letters indicate significant difference among varied diameter classes at the P < 0.05 level.
下载: 导出CSV
表 3 不同径级林木年胸径生长量与空间结构参数的Pearson相关系数
Table 3 Pearson correlation coefficients of annual DBH increment and spatial structure parameters among different DBH classes
树种 Tree species 样地类型
Sample plot type径级 DBH class 小 Small 中 Medium 大 Large 所有 All U M U M U M U M 云杉
P. jezoensis1P 0.093 4 0.367 5* −0.167 2 −0.407 1 −0.186 0 −0.172 6 −0.431 0* 0.073 1 4P −0.000 6 0.184 8* −0.402 1* −0.070 4 −0.055 7 −0.103 3 −0.431 0* 0.019 8 臭冷杉
A. nephrolepis1P 0.180 2 0.258 8 −0.069 3 0.142 2 0.258 8 0.180 2 −0.273 6* 0.302 3* 4P −0.142 9 0.329 5* −0.278 9* 0.441 8* −0.169 2 0.432 3* −0.471 8* 0.407 8* 红松
P. koraiensis1P − − −0.393 8* −0.087 3 0.619 7 − −0.407 5* −0.179 3 4P −0.062 6 −0.062 6 −0.521 9* −0.000 1 − − −0.622 3* 0.163 5 所有树种
All the tree species1P 0.011 3 0.158 4 −0.136 7* 0.038 0 −0.033 5 0.237 8* −0.360 3* 0.128 5* 4P 0.081 8 0.182 5* −0.187 8* 0.029 5 −0.000 6 0.211 3* −0.481 3* 0.188 8* 注:*表示在P < 0.05的水平上相关性显著。Note: * indicates significant correlation at P < 0.05 level.
下载: 导出CSV
-
[1] 侯向阳, 韩进轩. 长白山红松林主要树种空间格局的模拟分析[J]. 植物生态学报, 1997, 21(3): 47−54. doi: 10.3321/j.issn:1005-264X.1997.03.005 Hou X Y, Han J X. Simulation analysis of spatial patterns of main species in the Korean-pine broadleaved forest in Changbai Mountain[J]. Acta Phytoecologica Sinica, 1997, 21(3): 47−54. doi: 10.3321/j.issn:1005-264X.1997.03.005
[2] Aguirre O, Hui G Y, von Gadow K, et al. An analysis of spatial forest structure using neighbourhood-based variables[J]. Forest Ecology and Management, 2003, 183(1): 137−145.
[3] 安慧君. 阔叶红松林空间结构研究[D]. 北京: 北京林业大学, 2003. An H J. Study on the spatial structure of the broadleaved Korean pine forest[D]. Beijing: Beijing Forestry University, 2003.
[4] Uuttera J, Maltamo M. Impact of regeneration method on stand structure prior to first thinning: comparative study North Karelia, Finland vs. Republic of Karelia, Russian Federation[J]. Silva Fennica, 1995, 29(4): 267−285.
[5] 惠刚盈. 角尺度: 一个描述林木个体分布格局的结构参数[J]. 林业科学, 1999, 35(1): 39−44. Hui G Y. The neighbourhood patter: a new structure parameter for describing distribution of forest tree position[J]. Scientia Silvae Sinicae, 1999, 35(1): 39−44.
[6] 谢小魁, 苏东凯, 刘正纲, 等. 长白山原始阔叶红松林径级结构模拟[J]. 生态学杂志, 2010, 29(8): 1477−1481. doi: 10.13292/j.1000-4890.2010.0259 Xie X K, Su D K, Liu Z G, et al. Modeling diameter distribution of primary leaf Korean pine mixed forest in Changbai Mountains[J]. Chinese Journal of Ecology, 2010, 29(8): 1477−1481. doi: 10.13292/j.1000-4890.2010.0259
[7] Uuttera J, Maltamo M, Kuusela K. Impact of forest management history on the state of forests in relation to natural forest succession comparative study, North Karelia, Finland vs. Republic of Karelia, Russian Federation[J]. Forest Ecology & Management, 1996, 83(1−2): 71−85.
[8] Maltamo M, Kangas A, Uuttera J, et al. Comparison of percentile based prediction methods and the Weibull distribution in describing the diameter distribution of heterogeneous Scots pine stands[J]. Forest Ecology and Management, 1999, 133(3): 263−274.
[9] Rubin B D, Manion P D, Faber-Langendoen D. Diameter distributions and structural sustainability in forests[J]. Forest Ecology and Management, 2005, 222(1): 427−438.
[10] 惠刚盈, 李丽, 赵中华, 等. 林木空间分布格局分析方法[J]. 生态学报, 2007, 27(11): 4717−4728. doi: 10.3321/j.issn:1000-0933.2007.11.040 Hui G Y, Li L, Zhao Z H, et al. The comparison of methods in analysis of the tree spatial distribution pattern[J]. Acta Ecologica Sinica, 2007, 27(11): 4717−4728. doi: 10.3321/j.issn:1000-0933.2007.11.040
[11] Schütz J P. Modelling the demographic sustainability of pure beech plenter forests in Eastern Germany[J]. Annals of Forest Science, 2006, 63(1): 93−100. doi: 10.1051/forest:2005101
[12] 汤孟平, 徐文兵, 陈永刚, 等. 天目山近自然毛竹林空间结构与生物量的关系[J]. 林业科学, 2011, 47(8): 1−6. doi: 10.11707/j.1001-7488.20110801 Tang M P, Xu W B, Chen Y G, et al. Relationship between spatial structure and biomass of a close-to-nature Phyllostachys edulis stand in Tianmu Mountain[J]. Scientia Silvae Sinicae, 2011, 47(8): 1−6. doi: 10.11707/j.1001-7488.20110801
[13] 吕延杰, 杨华, 张青, 等. 云冷杉天然林林分空间结构对胸径生长量的影响[J]. 北京林业大学学报, 2017, 39(9): 41−47. Lü Y J, Yang H, Zhang Q, et al. Effects of spatial structure on DBH increment of natural spruce-fir forest[J]. Journal of Beijing Forestry University, 2017, 39(9): 41−47.
[14] 陈梦飞. 青海东部黄土区青海云杉人工林空间结构对径向生长的影响[D]. 北京: 北京林业大学, 2019. Chen M F. Effects of spatial structure of Picea crassifolia plantation on radial growth in the loess area of eastern Qinghai[D]. Beijing: Beijing Forestry University, 2019.
[15] 吕沅杭, 伊利启, 王儒林, 等. 基于空间结构参数的大兴安岭天然落叶松单木直径生长模型[J]. 林业科学研究, 2021, 34(2): 81−91. doi: 10.13275/j.cnki.lykxyj.2021.02.009 Lü Y H, Yi L Q, Wang R L, et al. Diameter growth model using spatial structure parameters of natural Larix gmelinii stand in Daxing’anling Mountains, Northeast China[J]. Forest Research, 2021, 34(2): 81−91. doi: 10.13275/j.cnki.lykxyj.2021.02.009
[16] 惠刚盈, 胡艳波. 混交林树种空间隔离程度表达方式的研究[J]. 林业科学研究, 2001, 14(1): 23−27. doi: 10.3321/j.issn:1001-1498.2001.01.004 Hui G Y, Hu Y B. Measuring species spatial isolation in mixed forests[J]. Forest Research, 2001, 14(1): 23−27. doi: 10.3321/j.issn:1001-1498.2001.01.004
[17] 惠刚盈, Von Gadow K, Albert M. 一个新的林分空间结构参数: 大小比数[J]. 林业科学研究, 1999, 12(1): 4−9. Hui G Y, von Gadow K, Albert M, et al. A new parameter for stand spatial structure neighbourhood comparison[J]. Forest Research, 1999, 12(1): 4−9.
[18] 国家林业局. 森林资源规划设计调查主要技术规定[EB/OL]. (2004−11−15)[2019−06−09]. https://www.forestry.gov.cn/portal/xby/s/1312/content-127438.html. State Forestry Administration. Main technical regulations for forest resource planning [EB/OL]. (2004−11−15)[2019−06−09]. https://www.forestry.gov.cn/portal/xby/s/1312/content-127438.html.
[19] 柴宗政. 基于相邻木关系的森林空间结构量化评价及R语言编程实现[D]. 杨凌: 西北农林科技大学, 2016. Chai Z Z. Quantitative evaluation and R programming of forest spatial structure based on the relationship of neighborhood trees[D]. Yangling: Northwest Agriculture and Forestry University, 2016.
[20] 陈亚南, 杨华, 马士友, 等. 长白山2种针阔混交林空间结构多样性研究[J]. 北京林业大学学报, 2015, 37(12): 48−58. doi: 10.13332/j.1000-1522.20150171 Chen Y N, Yang H, Ma S Y, et al. Spatial structure diversity of semi-natural and plantation stands of Larix gmelinii in Changbai Mountains, northeastern China[J]. Journal of Beijing Forestry University, 2015, 37(12): 48−58. doi: 10.13332/j.1000-1522.20150171
[21] 蒋桂娟, 郑小贤. 吉林省汪清林业局云冷杉天然林结构特征研究[J]. 北京林业大学学报, 2012, 34(4): 35−41. Jiang G J, Zheng X X. Structural characteristics of natural spruce-fir forest in Wangqing Forestry Bureau of Jilin Province, northeastern China[J]. Journal of Beijing Forestry University, 2012, 34(4): 35−41.
[22] 祝燕, 白帆, 刘海丰, 等. 北京暖温带次生林种群分布格局与种间空间关联性[J]. 生物多样性, 2011, 19(2): 252−259. doi: 10.3724/SP.J.1003.2011.08024 Zhu Y, Bai F, Liu H F, et al. Population distribution patterns and interspecific spatial associations in warm temperate secondary forests, Beijing[J]. Biodiversity Science, 2011, 19(2): 252−259. doi: 10.3724/SP.J.1003.2011.08024
[23] 倪瑞强, 唐景毅, 程艳霞, 等. 长白山云冷杉林主要树种空间分布及其关联性[J]. 北京林业大学学报, 2013, 35(6): 28−35. doi: 10.13332/j.1000-1522.2013.06.013 Ni R Q, Tang J Y, Cheng Y X, et al. Spatial distribution patterns and associations of main tree species in spruce-fir forest in Changbai Mountains, northeastern China[J]. Journal of Beijing Forestry University, 2013, 35(6): 28−35. doi: 10.13332/j.1000-1522.2013.06.013
[24] Snell R S, Huth A, Nabel J E M S, et al. Using dynamic vegetation models to simulate plant range shifts[J]. Ecography, 2015, 37(12): 1184−1197.
[25] Szymura T H, Szymura M, Macioå A. The effect of ecological niche and spatial pattern on the diversity of oak forest vegetation[J]. Transactions of the Botanical Society of Edinburgh, 2015, 8(4): 505−518.
[26] 刘足根, 朱教君, 袁小兰, 等. 辽东山区长白落叶松天然更新调查[J]. 林业科学, 2007, 43(1): 42−49. doi: 10.3321/j.issn:1001-7488.2007.01.007 Liu Z G, Zhu J J, Yuan X L, et al. Investigation and analysis ofthe natural regeneration of Larix olgensis in mountain regions of eastern Liaoning Province, China[J]. Scientia Silvae Sinicae, 2007, 43(1): 42−49. doi: 10.3321/j.issn:1001-7488.2007.01.007
[27] Xiang W, Lei X, Zhang X. Modelling tree recruitment in relation to climate and competition in semi-natural Larix-Picea-Abies, forests in northeast China[J]. Forest Ecology & Management, 2016, 382: 100−109.
[28] 徐海, 惠刚盈, 胡艳波, 等. 天然红松阔叶林不同径阶林木的空间分布特征分析[J]. 林业科学研究, 2006, 19(6): 687−691. doi: 10.3321/j.issn:1001-1498.2006.06.003 Xu H, Hui G Y, Hu Y B, et al. Analysis of spatial distribution characteristics of trees with different diameter classes in natural Korean pine broadleaved forest[J]. Forest Research, 2006, 19(6): 687−691. doi: 10.3321/j.issn:1001-1498.2006.06.003
[29] 张泽浦, 方精云, 菅诚. 邻体竞争对植物个体生长速率和死亡概率的影响: 基于日本落叶松种群试验的研究[J]. 植物生态学报, 2000, 24(3): 340−345. doi: 10.3321/j.issn:1005-264X.2000.03.016 Zhang Z P, Fang J Y, Jian C. Effects of competition on growth rate and probability of death of plant individuals a study based on nursery experiments of Larix leptolrpis populations[J]. Journal of Plant Ecology, 2000, 24(3): 340−345. doi: 10.3321/j.issn:1005-264X.2000.03.016
[30] 巫志龙, 周成军, 周新年, 等. 杉阔混交人工林林分空间结构分析[J]. 林业科学研究, 2013, 26(5): 609−615. Wu Z L, Zhou C J, Zhou X N, et al. Analysis of stand spatial structure of Cunninghamia lanceolata-broadleaved mixed plantation[J]. Forest Research, 2013, 26(5): 609−615.
[31] 曹小玉, 李际平, 委霞. 亚热带典型林分空间结构与林下草本物种多样性的差异特征分析及其关联度[J]. 草业科学, 2019, 36(10): 2466−2475. doi: 10.11829/j.issn.1001-0629.2018-0728 Cao X Y, Li J P, Wei X. Analysis of the difference and correlation between the spatial structure and understory herbaceous species diversity of typical subtropical forests[J]. Pratacultural Science, 2019, 36(10): 2466−2475. doi: 10.11829/j.issn.1001-0629.2018-0728
[32] 童鑫. 从种群遗传和群落组成的空间结构研究群落维持机制[D]. 上海: 华东师范大学, 2015. Tong X. Exploring community assembly through the lens of spatial structure: from population genetics to community composition[D]. Shanghai: East China Normal University, 2015.
[33] 姚国清, 池桂清, 董兆琪, 等. 红松生长与光照关系的探讨[J]. 生态学杂志, 1985, 4(6): 48−50. Yao G Q, Chi G Q, Dong Z Q, et al. Discussion on the relationship between growth and light of Korean pine[J]. Chinese Journal of Ecology, 1985, 4(6): 48−50.
[34] 韩大校, 金光泽. 地形和竞争对典型阔叶红松林不同生长阶段树木胸径生长的影响[J]. 北京林业大学学报, 2017, 39(1): 9−19. Han D X, Jin G Z. Influences of topography and competition on DBH growth in different growth stages in a typical mixed broadleaved-Korean pine forest, northeastern China[J]. Journal of Beijing Forestry University, 2017, 39(1): 9−19.
-
期刊类型引用(15)
1. 李雪,朱宾宾,满秀玲. 温度和水分对寒温带典型森林类型土壤有机碳矿化的影响. 东北林业大学学报. 2025(02): 127-136 .  百度学术
百度学术
2. 王军,满秀玲. 去除凋落物和草毡层对寒温带典型森林土壤活性有机碳的短期影响. 水土保持研究. 2024(01): 168-177 . 百度学术
3. 刘巧娟,张之松,满秀玲,高明磊,赵佳龙. 寒温带多年冻土区不同林龄白桦林土壤酶活性动态特征. 东北林业大学学报. 2024(03): 125-131 . 百度学术
4. 祝顺万,刘利霞,胡雪凡,代伟,王月容,李芳. 华北落叶松混交林林下植物群落特征对间伐的响应. 森林工程. 2024(03): 47-55 . 百度学术
5. 刘贝贝,蔡体久. 大兴安岭北部主要森林类型土壤活性碳组分及碳库稳定性变化特征. 水土保持学报. 2024(06): 203-213 . 百度学术
6. 沈健,何宗明,董强,林宇,郜士垒. 滨海防护林土壤CO_2排放和土壤因子对计划火烧的响应. 水土保持学报. 2023(01): 254-261 . 百度学术
7. 沈健,何宗明,董强,郜士垒,曹光球,林宇,黄政. 滨海沙地两种防护林土壤呼吸月际动态及影响因素. 应用与环境生物学报. 2023(02): 432-439 . 百度学术
8. 王军,满秀玲. 去除凋落物和草毡层对寒温带典型森林土壤氮素的短期影响. 森林工程. 2023(04): 1-9 . 百度学术
9. 刘思琪,满秀玲,张頔,徐志鹏. 寒温带4种乔木树种不同径级根系分解及碳氮释放动态. 北京林业大学学报. 2023(07): 36-46 . 本站查看
10. 沈健,何宗明,董强,林宇,郜士垒. 尾巨桉人工林火烧迹地土壤呼吸组分特征及其与土壤因子的关系. 生态学杂志. 2023(07): 1537-1547 . 百度学术
11. 沈健,何宗明,董强,郜士垒,林宇. 轻度火烧对滨海沙地人工林土壤呼吸速率和非生物因子的影响. 植物生态学报. 2023(07): 1032-1042 . 百度学术
12. 沈健,何宗明,董强,郜士垒,林宇,石焱. 不同处理方式下湿地松人工林土壤呼吸及温度敏感性变化. 西北林学院学报. 2023(05): 10-18 . 百度学术
13. 田慧敏,刘彦春,刘世荣. 暖温带麻栎林凋落物调节土壤碳排放通量对降雨脉冲的响应. 生态学报. 2022(10): 3889-3896 . 百度学术
14. 张茹,马秀枝,杜金玲,李长生,梁芝,吴天龙. 模拟增温对大兴安岭兴安落叶松林土壤CO_2通量的影响. 东北林业大学学报. 2022(08): 83-88 . 百度学术
15. 张扬,张秋良,李小梅,代海燕,王飞. 兴安落叶松林生长季碳交换对气候变化的响应. 西部林业科学. 2021(05): 73-80+89 . 百度学术
其他类型引用(4)


计量
- 文章访问数: 1036
- HTML全文浏览量: 230
- PDF下载量: 164
- 被引次数: 19
