
Experimental study on the effects of holes on bending strain distribution of wood beams
-
摘要: 为了研究孔洞对木梁弯曲应变分布的影响,采用数字图像相关法进行了无疵木梁和含孔洞木梁的四点弯曲试验,分析了3种不同的孔洞位置(孔洞位于中心、受压区和受拉区)对木梁弯曲应变分布的影响,探讨了中性轴位置的偏移规律。结果表明:在极限载荷时,3种不同孔洞位置的木梁,其压应变区域均大于拉应变区域,其中孔洞位于受压区时木梁的压应变区域最大,孔洞位于中心时次之,孔洞位于受拉区时最小。并且在整个加载过程中,中性轴会随着载荷的增大向木梁下缘偏移,孔洞位于受压区时中性轴的偏移距离最大,孔洞位于中心时次之,孔洞位于受拉区时最小。在此基础上,依据平截面假定和弹塑性理论的Hoffman屈服准则,初步分析了含孔洞木梁弯曲应变分布和中性轴偏移规律的机理。研究结果为进一步从理论上定量推导含孔洞木梁的弯曲应变和应力计算公式提供了依据。Abstract: To analyze the deformation and strain distribution of wood beams which contained holes during loading, in this paper, four-point bending tests were performed on clear wood beams and wood beams containing holes using digital image correlation technique. The influence of three various locations of holes (a hole located at center, located at compression zone, and located at tension zone, respectively) on bending strain distributions of wood beams was analyzed, and the movement of the neutral axis during loading was discussed. The experiment results showed that strain distributions and neutral axis locations were significantly different for three various locations of holes. When beams were at the ultimate load, for beams containing holes at various locations, the compressive strain region was larger than the tensile strain region. Among three various locations of holes, wood beams containing a hole in the compression zone had the largest compressive strain region, beams containing a hole at center come second, and beams containing a hole in the tension zone had the smallest compressive strain region. Additionally, the neutral axis moved towards the bottom of the beam as the load increased during loading. The movement of neutral axis was largest when the hole located at the compression zone, secondly when the hole located at center, and smallest when the hole located at the tension zone. Based on plane-section assumption and Hoffman yield criterion in elastic-plastic theory, the theoretical analysis of strain distribution and movement of neutral axis was studied on wood beams which contained holes. The results provide proofs for further theoretical study on bending properties of wood beams containing holes.
-
Keywords:
- beam /
- hole /
- bending strain distribution /
- neutral axis /
- Hoffman yield criterion /
- digital image correlation
-
在木结构中含孔洞的木梁既有结构需要主动开洞的,也有使用中由病害形成的。孔洞等缺陷的存在对木材的力学和物理性能有明显影响[1-5]。Kollmann等[4]早在1968年的研究就指出:孔洞的存在降低了木材的拉压性能和弯曲性能,而且由于木材的抗拉强度高于抗压强度,木梁弯曲时应力服从梯形分布的理想模型。对于无疵木梁,中性轴位于形心轴的下方,计算中性轴位置的公式如下:
xh=1+m2(1+m)2,其中m=σcbσtb (1) 式中:x为中性轴到梁上缘的距离,mm;h为梁的高度,mm;σtb为顺纹抗拉强度,MPa;σcb为顺纹抗压强度,MPa。
Buksnowitz等[5]测量了挪威云杉板材在拉伸载荷下的应变分布,结果显示:孔洞使得试件的应变分布不均匀,特别是在孔洞的周围出现了明显的应力集中现象。陈国等[6]对腹板开孔竹木工字梁的受力性能和破坏形态进行了试验研究,发现孔洞削弱了梁的截面,使得孔洞周围出现不可忽略的剪切变形,导致竹木工字梁腹板内的应力分布和挠度变化不再完全符合传统弯曲理论。Ardalany等[7]在对含孔洞单板层积材的破坏载荷进行分析,研究中指出:孔洞周围存在复杂的应力场,当含孔洞木梁在低负载水平时,孔洞周围会产生裂纹并持续扩展,使得木梁的承载力不符合传统弯曲理论。
目前,已有的研究大多是从试验方面分析了含孔洞木梁受弯过程的变形情况,据此提出了其弯曲变形不再符合传统的弯曲理论,但从理论方面的研究还较欠缺。根据构件弯曲变形理论的推导过程可知,建立弯曲变形理论首先要搞清楚弯曲应变的分布情况和中性轴位置的确定及其偏移规律。为此,采用数字图像相关法进行无疵木梁和含孔洞木梁的四点弯曲试验,对含孔洞木梁在纯弯曲变形过程中的应变分布和中性轴偏移规律进行研究,并依据平截面假定和弹塑性理论,对含孔洞木梁的弯曲应变分布和中性轴的偏移进行初步的理论分析,旨在为进一步开展含孔洞木梁的弯曲理论研究和实际应用提供可靠数据。
1. 材料与方法
1.1 试件的制备
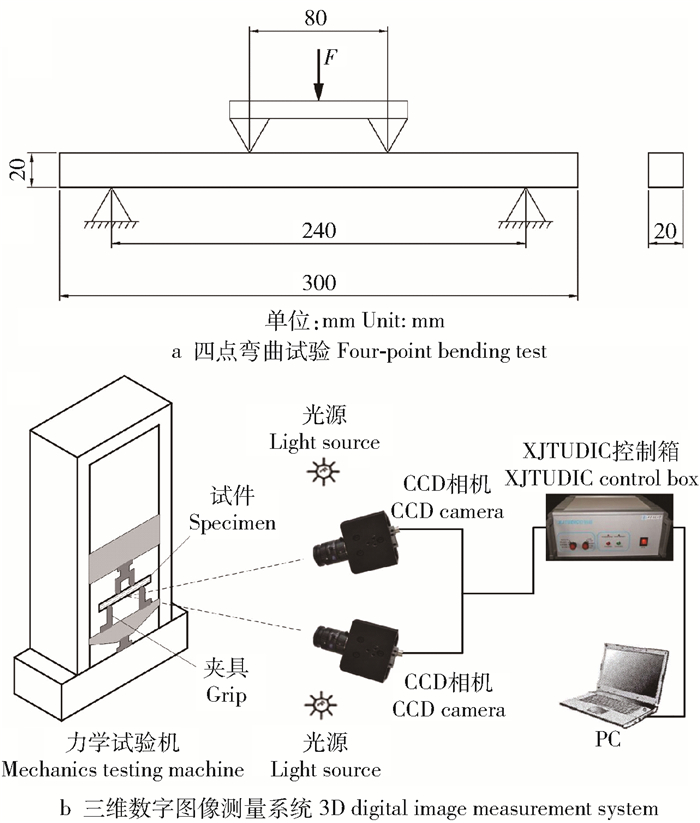
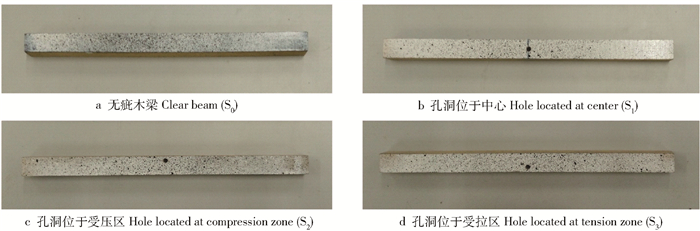
试验材料为核桃楸(Juglans mandshurica),含水率约10%,密度为0.52 g/cm3,其顺纹抗拉强度、顺纹抗压强度按照GB/T 1936.1—2009《木材抗弯强度测定方法》的规定加工为300 mm×20 mm×20 mm通直无缺陷的顺纹木梁试件。试件表面使用亚光漆喷涂成白底黑色散斑图样,并人工制作孔洞。试件分为4组:一组为无疵木梁,记为S0(图 1a);其余3组试件均含有直径为5 mm的孔洞,孔洞位于木梁中心的记为S1(图 1b),孔洞位于木梁中心上方5 mm处(受压区)的记为S2(图 1c);孔洞位于木梁中心下方5 mm处(受拉区)的记为S3(图 1d)。
1.2 方法
按照GB/T 1936.1—2009《木材抗弯强度测定方法》的规定,如图 2a所示,采取四点弯曲试验,以保证木梁的中间部分为纯弯曲。试验设备采用电子万能力学试验机(Reger,深圳瑞格尔),加载速度为5 mm/min,至试件断裂时停止。
测量装置采用XJTUDIC三维数字图像测量系统(XJTOP,西安新拓),如图 2b所示。三维数字图像测量系统的图像采集部分由两台CCD相机构成,两台CCD相机安装于三脚架上,放置在试件正前方约500 mm处,CCD相机每2 s采集一次图像。每组试件进行3次试验。
2. 结果与分析
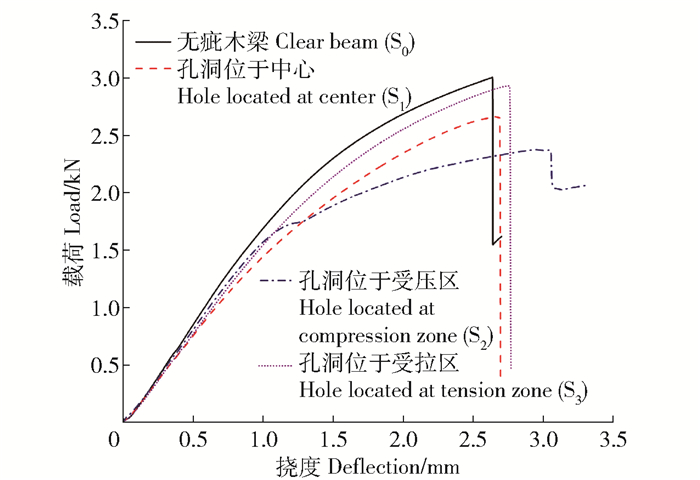
通过四点弯曲试验得到4组不同木梁试件的载荷-挠度曲线,如图 3所示。测试得到的极限载荷Fmax、计算得到的抗弯强度σb、抗弯弹性模量的测量值Em见表 1,其中抗弯强度按照最大截面尺寸20 mm×20 mm进行计算。
![]() 图 3 4组木梁弯曲变形的载荷-挠度曲线Figure 3. Plot of load versus deflection for four groups of wood beams in bending deformations表 1 4组木梁的极限载荷、抗弯强度和抗弯弹性模量Table 1. Ultimate load, bending strength and modulus of elasticity in bending for four groups of wood beams
图 3 4组木梁弯曲变形的载荷-挠度曲线Figure 3. Plot of load versus deflection for four groups of wood beams in bending deformations表 1 4组木梁的极限载荷、抗弯强度和抗弯弹性模量Table 1. Ultimate load, bending strength and modulus of elasticity in bending for four groups of wood beams试件编号
Specimen No.孔洞位置
Location of hole极限载荷
Ultimate load(Fmax) /kN抗弯强度
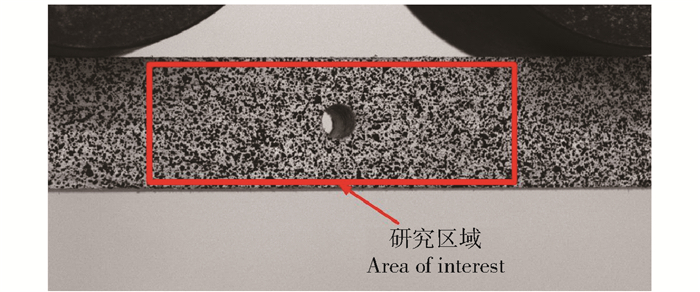
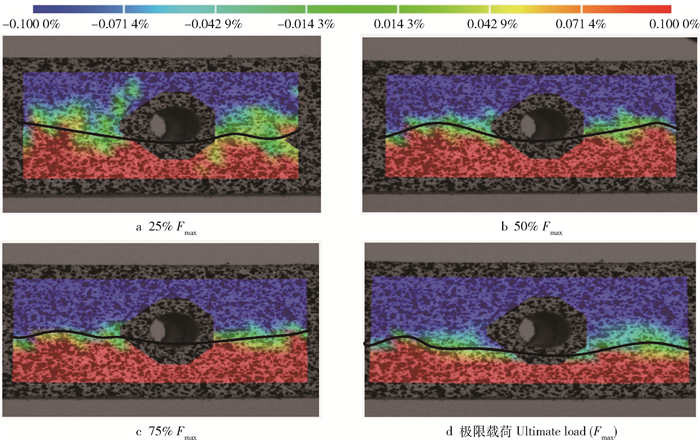
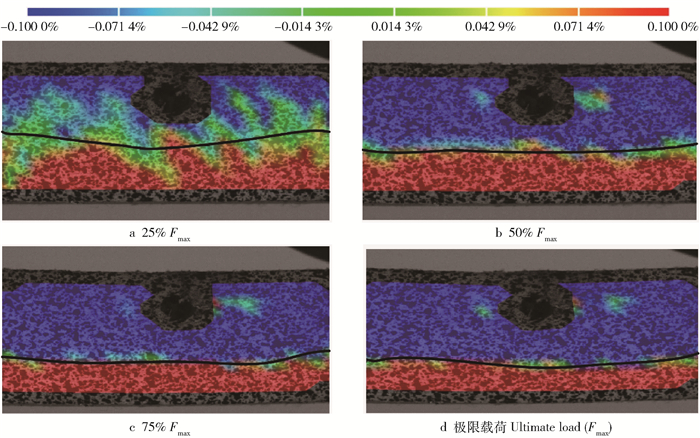
Bending strength (σb) /MPay0/mm Em/MPa Ec/MPa S0 3.06 90.19 9.29 29.33 30.13(2.73%) S1 中心Center 2.67 80.01 8.83 25.05 25.79(2.95%) S2 受压区Compression zone 2.38 71.36 5.91 26.22 25.47(2.86%) S3 受拉区Tension zone 2.93 87.90 9.37 26.92 27.07(0.56%) 注:y0为极限载荷时中性轴到木梁下缘的平均距离。Em为抗弯弹性模量测量值,Ec为根据应变沿梁高分布计算得到的抗弯弹性模量,括号内数值为计算值Ec相对于测量值Em的相对误差。Notes: y0 is average distance from neutral axis to bottom of beam at ultimate load, Em is measured modulus of elasticity in bending, Ec is calculated modulus of elasticity in bending based on strain distribution along depth of beam. There are relative errors between Ec and Em in brackets. 试验采集的变形图,经过三维数字图像测量系统的XTDIC数字图像计算软件处理,能够得到每组木梁在不同加载阶段时中性轴的位置及其变化情况,尤其是木梁中部的纯弯曲区域是研究的关键,该研究区域如图 4所示。在对变形过程进行分析计算时,梁横截面仍然满足平截面假定,且应变不发生变化的轴为中性轴。图 5~8分别是无疵木梁和3种不同的孔洞位置(孔洞位于中心、受压区和受拉区)木梁的轴向应变云图和中性轴位置。试验得到的轴向应变云图中,蓝色表示压应变区域,红色表示拉应变区域,绿色表示既不拉伸也不压缩的区域,黑色实线表示中性轴的位置。
![]() 图 5 不同载荷时无疵木梁的轴向应变云图Figure 5. Longitudinal strain fields for clear beam under different loads
图 5 不同载荷时无疵木梁的轴向应变云图Figure 5. Longitudinal strain fields for clear beam under different loads![]() 图 6 不同载荷时孔洞位于中心的木梁的轴向应变云图Figure 6. Longitudinal strain fields for beam with a hole located at center under different loads
图 6 不同载荷时孔洞位于中心的木梁的轴向应变云图Figure 6. Longitudinal strain fields for beam with a hole located at center under different loads![]() 图 7 不同载荷时孔洞位于受压区的木梁的轴向应变云图Figure 7. Longitudinal strain fields for beam with a hole located at compression zone under different loads
图 7 不同载荷时孔洞位于受压区的木梁的轴向应变云图Figure 7. Longitudinal strain fields for beam with a hole located at compression zone under different loads![]() 图 8 不同载荷时孔洞位于受拉区的木梁的轴向应变云图Figure 8. Longitudinal strain fields for beam with a hole located at tension zone under different loads
图 8 不同载荷时孔洞位于受拉区的木梁的轴向应变云图Figure 8. Longitudinal strain fields for beam with a hole located at tension zone under different loads根据应变沿梁高分布计算得到的抗弯弹性模量计算值Ec见表 1。由表 1可以看出,抗弯弹性模量测量值和计算值的相对误差均小于3%,说明试验采用的数字图像相关法具有较好的可靠性。
2.1 无疵木梁
载荷达到3.06 kN时无疵木梁发生断裂,其抗弯强度σb=90.19 MPa。由图 5和表 2可以看出,在载荷为25%Fmax(0.76 kN)时,压应变区域与拉应变区域之比为0.88,压应变区域小于拉应变区域,此时中性轴到木梁下缘的平均距离为10.63 mm,位于形心轴上方(如图 5a)。在极限载荷时,压应变区域与拉应变区域之比为1.15,压应变区域大于拉应变区域,此时中性轴到木梁下缘的平均距离为9.29 mm,位于形心轴下方(如图 5d)。此结果说明随着载荷的增加,不但压应变与拉应变的分布发生了变化,中性轴也逐渐向木梁下缘偏移,但中性轴始终位于形心轴附近,且沿长度方向近似为一条直线。
表 2 不同载荷时无疵木梁的中性轴位置与压应变区域和拉应变区域的面积Table 2. Location of neutral axis and area of compressive and tension strain region for clear beam under different loads载荷阶段
Load stage载荷值
Load/kNy0/mm Ac/AI At/AI Ac/At 25%Fmax 0.76 10.63 0.47 0.53 0.88 50%Fmax 1.52 10.49 0.48 0.52 0.91 75%Fmax 2.28 9.97 0.51 0.49 1.01 Fmax 3.06 9.29 0.54 0.46 1.15 注:Ac为压应变区域的面积,At为拉应变区域的面积,AI为研究区域的面积。Ac is area of compressive strain region, At is tension strain region, AI is area of area of interest. Same as below. 2.2 孔洞位于中心
孔洞位于中心的木梁,在加载过程中,孔洞周围会产生应力集中,削弱了木梁的承载力。载荷为2.67 kN时木梁断裂,与无疵木梁相比,其承载力降低了13%。
由图 6和表 3可以看出,孔洞位于中心的木梁,在载荷为25%Fmax(0.67 kN)时,压应变区域与拉应变区域之比为0.80,压应变区域小于拉应变区域,此时中性轴到木梁下缘的平均距离为11.10 mm,位于形心轴上方(图 6a)。在极限载荷时,压应变区域与拉应变区域之比为1.27,压应变区域大于拉应变区域,孔洞大部分处于压应变区域。此时中性轴到木梁下缘的平均距离为8.83 mm,位于形心轴下方(图 6d),与载荷为25%Fmax时相比向下移动了2.27 mm。此结果说明孔洞的存在改变了压应变区域与拉应变区域的大小,应变分布不均匀,中性轴也逐渐向木梁下缘偏移。并且中性轴不再是一条直线,而是在沿着梁的长度方向上变化,左右两边中性轴的位置接近形心轴,孔洞附近区域的中性轴向下移动,远离形心轴。
表 3 不同载荷时孔洞位于中心的木梁的中性轴位置与压应变区域和拉应变区域的面积Table 3. Location of neutral axis and area of compressive and tension strain region for beam with a hole located at center under different loads载荷阶段
Load stage载荷值
Load/kNy0/mm Ac/AI At/AI Ac/At 25%Fmax 0.67 11.10 0.44 0.56 0.80 50%Fmax 1.34 10.92 0.45 0.55 0.83 75%Fmax 2.01 10.18 0.49 0.51 0.96 Fmax 2.67 8.83 0.55 0.45 1.27 2.3 孔洞位于受压区
孔洞位于受压区的木梁,在加载过程中,孔洞完全处于压应变区域,其周围产生了应力集中,使木梁的承载力受到了明显的削弱。载荷为2.38 kN时木梁断裂,其承载力与无疵木梁相比降低了22%。
由图 7和表 4可以看出,孔洞位于受压区的木梁,在载荷为25%Fmax(0.60 kN)时,压应变区域与拉应变区域近似相等,此时中性轴到木梁下缘的平均距离为10.03 mm,与形心轴基本重合(图 7a)。在极限载荷时,压应变区域与拉应变区域之比为2.38,压应变区域明显大于拉应变区域,且压应变区域在3种不同孔洞位置的木梁中最大。此时中性轴到木梁下缘的平均距离为5.91 mm,位于形心轴下方(图 7d),与载荷为25%Fmax时相比向下偏移了4.12 mm,中性轴的偏移距离在3种不同孔洞位置的木梁中最大。结果表明:随着载荷的增大,孔洞位于受压区的木梁的压应变区域不断增大,中性轴也逐渐向木梁下缘偏移。并且在载荷为25%Fmax时沿着梁的长度方向中性轴的位置是不同的,孔洞附近区域的中性轴向木梁下缘偏移,左右两边中性轴的位置接近形心轴。随着载荷的增大,中性轴近似为一条直线。此现象与文献[8-10]含节子木梁的研究结果类似。
表 4 不同载荷时孔洞位于受压区的木梁的中性轴位置与压应变区域和拉应变区域的面积Table 4. Location of neutral axis and area of compressive and tension strain region for beam with a hole located at compression zone under different loads载荷阶段
Load stage载荷值
Load/kNy0/mm Ac/AI At/AI Ac/At 25%Fmax 0.60 10.03 0.49 0.51 0.99 50%Fmax 1.19 7.85 0.60 0.40 1.55 75%Fmax 1.79 6.55 0.67 0.33 2.05 Fmax 2.38 5.91 0.70 0.30 2.38 2.4 孔洞位于受拉区
孔洞位于受拉区的木梁,在加载过程中,孔洞完全处于拉应变区域,同样产生了应力集中。虽然应力集中削弱了木梁的承载力,但承载力受到削弱的程度不大。载荷为2.93 kN时木梁断裂,其承载力与无疵木梁相比仅降低了4%。
由图 8和表 5可以看出,孔洞位于受拉区的木梁,在载荷为25%Fmax(0.73 kN)时,压应变区域略小于拉应变区域,此时中性轴到木梁下缘的平均距离为10.58 m,位于形心轴上方(图 8a)。而在极限载荷时,压应变区域与拉应变区域之比为1.13,压应变区域略大于拉应变区域,且压应变区域在3种不同孔洞位置的木梁中最小。此时中性轴到木梁下缘的平均距离为9.37 mm,位于形心轴略微偏下处(图 8d),与载荷为25%Fmax时相比向下移动了1.21 mm。结果表明:随着载荷的增大,孔洞位于受拉区的木梁的压应变区域不断增大,中性轴也逐渐向木梁下缘偏移,且中性轴的偏移距离在3种不同孔洞位置的木梁中最小。中性轴沿着梁的长度方向的位置也是变化的,但与孔洞位于中心或受压区时不同的是,左右两边的中性轴位置远离形心轴,向木梁下缘移动,而孔洞附近区域的中性轴位置接近形心轴。
表 5 不同载荷时孔洞位于受拉区的木梁的中性轴位置与压应变区域和拉应变区域的面积Table 5. Location of neutral axis and area of compressive and tension strain region for beam with a hole located in tension zone under different loads载荷阶段
Load stage载荷值
Load/kNy0/mm Ac/AI At/AI Ac/At 25%Fmax 0.73 10.58 0.47 0.53 0.89 50%Fmax 1.47 10.25 0.48 0.52 0.95 75%Fmax 2.20 9.77 0.51 0.49 1.05 Fmax 2.93 9.37 0.53 0.47 1.13 3. 讨论
根据图 3的载荷-挠度曲线可以看出,木梁试件挠度大约在0~0.8 mm范围内为弹性阶段,超过0.8 mm是弹塑性阶段,而且4种木梁的载荷-挠度曲线在弹性阶段的斜率基本一样,即抗弯弹性模量基本相同(见表 1)。
由图 5~8和表 2~5可知,木梁在纯弯曲过程中,无疵木梁和含有不同孔洞位置的木梁,不仅其弯曲应变的分布不同,中性轴的偏移规律也不同。为了解释这种现象,本文采用各向异性材料的弹性理论和弹塑性理论进行了定性分析。
3.1 无疵木梁
按照Kollmann和Cote[4]提出的公式(1),计算本试验制作的无疵木梁弯曲过程的中性轴到木梁下缘的距离为y0=9.14 mm,与表 2中的试验测量值比较,计算结果与试验结果一致,表明无疵木梁试件在纯弯曲过程仍然满足Kollmann提出的弯曲应力分布特性。
3.2 含孔洞木梁
由于孔洞的存在增加了木梁试件的不均匀性,Kollmann弯曲模型不再适用。本研究依据各向异性材料弹塑性理论的Hoffman屈服准则[11-13],假定含孔洞木梁弯曲时的横截面仍符合平截面假定,分析了不同孔洞位置时木梁的应变分布和中性轴偏移规律。
平面状态下Hoffman屈服准则的表达式为:
σ2x−σxσyXtXc+σ2yYtYc+Xc−XtXtXcσx+Yc−YtYtYcσy+τ2xyS=1 (2) 式中:Xt和Yt为材料主方向的拉伸屈服强度,MPa;Xc和Yc为材料主方向的压缩屈服强度,MPa;σx和σy为材料主方向的正应力,MPa;τxy为材料的切应力,MPa;S为剪切屈服强度,MPa。
按照Hoffman屈服准则,对于正交各向异性材料的简支梁,当拉伸屈服强度大于压缩屈服强度时,纯弯曲的上层(受压区)先于下层(受拉区)出现屈服,这与木材的弯曲特性一致。当进入塑性状态时,梁各层的弹性极限载荷不同,所以可将梁看成是不同材料组合起来的组合梁。此时,由受弯梁横截面上的静力平衡条件可知:
FN=∫AcσcdA−∫AtσtdA=0 (3) 式中: FN为横截面上的合力,σc为压缩屈服强度,MPa;σt为拉伸屈服强度,MPa;Ac表示压应变区域的面积,mm2;At表示拉应变区域的面积,mm2。
公式(3)表明,受弯变形的简支梁,当受压区和受拉区的面积变化时,中性轴必须偏离形心轴,相应地向上或向下移动。
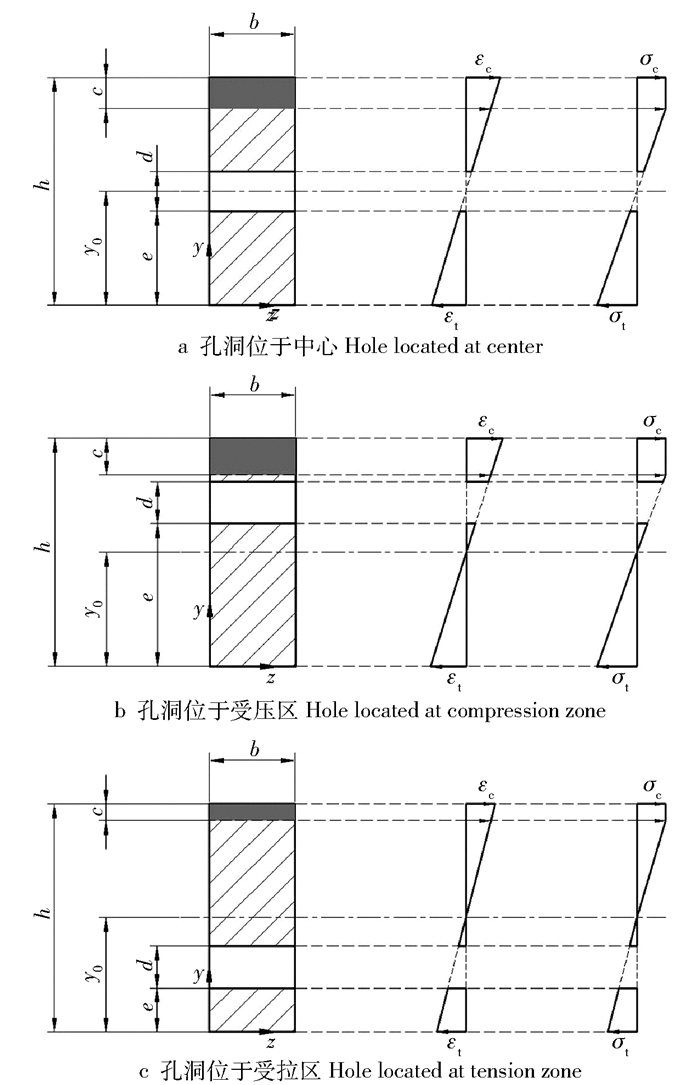
对于含孔洞木梁受载弯曲变形时的应变分布和中性轴的偏移问题,进行了3种不同孔洞位置木梁变形机制的定性分析,定量计算有待进一步研究。孔洞位于中心的木梁,其受压区与受拉区的面积减少量相同。根据公式(3)分析,梁受载后,孔洞周围出现应力集中,由于对压缩屈服强度的影响更明显,使得压应变区域的面积增大,相应的中性轴偏离形心轴,并向梁下缘底部移动,其应变和应力分布如图 9a所示。该情况与图 6和表 3中的试验结果一致。
![]() 图 9 弹塑性阶段含孔洞木梁截面的应变和应力沿梁高分布b为木梁宽度, mm; h为木梁的高度, mm; c为塑性变形区的高度, mm; d为孔径, mm; e为孔洞下缘到木梁下缘的距离, mm; y0为中性轴到木梁下缘的距离,mm。εc为受压区的应变, εt为受拉区的应变, σt为拉伸屈服强度, MPa,σc为压缩屈服强度, MPa。Figure 9. Strain and stress distribution along height of beam containing holes during elastic-plastic stageb is width of beam (mm), h is height of beam (mm), c is height of plastic deformation region (mm), d is diameter of hole (mm), e is distance from the bottom of hole to the bottom of beam (mm), and y0 is distance from neutral axis to bottom of beam (mm). εc is strain in compression zone, εt is strain in tension zone, σt is tensile yield strength (MPa), σc is compressive yield strength (MPa).
图 9 弹塑性阶段含孔洞木梁截面的应变和应力沿梁高分布b为木梁宽度, mm; h为木梁的高度, mm; c为塑性变形区的高度, mm; d为孔径, mm; e为孔洞下缘到木梁下缘的距离, mm; y0为中性轴到木梁下缘的距离,mm。εc为受压区的应变, εt为受拉区的应变, σt为拉伸屈服强度, MPa,σc为压缩屈服强度, MPa。Figure 9. Strain and stress distribution along height of beam containing holes during elastic-plastic stageb is width of beam (mm), h is height of beam (mm), c is height of plastic deformation region (mm), d is diameter of hole (mm), e is distance from the bottom of hole to the bottom of beam (mm), and y0 is distance from neutral axis to bottom of beam (mm). εc is strain in compression zone, εt is strain in tension zone, σt is tensile yield strength (MPa), σc is compressive yield strength (MPa).孔洞位于受压区的木梁,其受压区的面积减小,而受拉区的不变。根据公式(3)分析,梁受载后,位于受压区的孔洞周围出现应力集中,进一步削弱了压缩屈服强度,使得压应变区域增大更明显,相应的中性轴向梁下缘底部移动的距离也更大,其应变和应力分布如图 9b所示。该情况与图 7和表 4的试验结果一致。
孔洞位于受拉区的木梁,其受拉区的面积减小,而受压区的不变。根据公式(3)分析,梁受载后,位于受拉区的孔洞周围出现应力集中,削弱了拉伸屈服强度,使得拉伸屈服强度和压缩屈服强度差别减小,从而压应变区域增大不明显,相应的中性轴向梁下缘底部移动的距离也不大,其应变和应力分布如图 9c所示。该情况与图 8和表 5的试验结果一致。
4. 结论
基于数字图像相关法,采用四点弯曲试验,研究了3种不同的孔洞位置(孔洞位于中心、受压区和受拉区)对木梁弯曲应变分布和中性轴位置的影响,并依据平截面假定和弹塑性理论的Hoffman屈服准则,进行了含孔洞木梁受弯变形过程的应变分布和中性轴偏移规律的理论分析。研究得到以下结论:
1) 不同的孔洞位置对木梁的应变分布有显著影响。对于孔洞位于受压区的木梁,其压应变区域最大,而承载力最小。因此,在需要对木梁进行开孔时,孔洞尽量布置在木梁的中心或受拉区。
2) 在整个加载过程中,中性轴会随着载荷的增大向木梁下缘偏移,尤其是超出弹性范围后,孔洞位置对中性轴的偏移影响更明显。这种现象表明含孔木梁的应力分布已不再完全符合传统弯曲理论。
3) 对于弹塑性阶段的含孔木梁,在受弯时的弯曲变形可以采用各向异性材料弹塑性理论的Hoffman屈服准则进行分析。
-
![]()
图 3 4组木梁弯曲变形的载荷-挠度曲线
Figure 3. Plot of load versus deflection for four groups of wood beams in bending deformations
![]()
图 5 不同载荷时无疵木梁的轴向应变云图
Figure 5. Longitudinal strain fields for clear beam under different loads
![]()
图 6 不同载荷时孔洞位于中心的木梁的轴向应变云图
Figure 6. Longitudinal strain fields for beam with a hole located at center under different loads
![]()
图 7 不同载荷时孔洞位于受压区的木梁的轴向应变云图
Figure 7. Longitudinal strain fields for beam with a hole located at compression zone under different loads
![]()
图 8 不同载荷时孔洞位于受拉区的木梁的轴向应变云图
Figure 8. Longitudinal strain fields for beam with a hole located at tension zone under different loads
![]()
图 9 弹塑性阶段含孔洞木梁截面的应变和应力沿梁高分布
b为木梁宽度, mm; h为木梁的高度, mm; c为塑性变形区的高度, mm; d为孔径, mm; e为孔洞下缘到木梁下缘的距离, mm; y0为中性轴到木梁下缘的距离,mm。εc为受压区的应变, εt为受拉区的应变, σt为拉伸屈服强度, MPa,σc为压缩屈服强度, MPa。
Figure 9. Strain and stress distribution along height of beam containing holes during elastic-plastic stage
b is width of beam (mm), h is height of beam (mm), c is height of plastic deformation region (mm), d is diameter of hole (mm), e is distance from the bottom of hole to the bottom of beam (mm), and y0 is distance from neutral axis to bottom of beam (mm). εc is strain in compression zone, εt is strain in tension zone, σt is tensile yield strength (MPa), σc is compressive yield strength (MPa).
表 1 4组木梁的极限载荷、抗弯强度和抗弯弹性模量
Table 1 Ultimate load, bending strength and modulus of elasticity in bending for four groups of wood beams
试件编号
Specimen No.孔洞位置
Location of hole极限载荷
Ultimate load(Fmax) /kN抗弯强度
Bending strength (σb) /MPay0/mm Em/MPa Ec/MPa S0 3.06 90.19 9.29 29.33 30.13(2.73%) S1 中心Center 2.67 80.01 8.83 25.05 25.79(2.95%) S2 受压区Compression zone 2.38 71.36 5.91 26.22 25.47(2.86%) S3 受拉区Tension zone 2.93 87.90 9.37 26.92 27.07(0.56%) 注:y0为极限载荷时中性轴到木梁下缘的平均距离。Em为抗弯弹性模量测量值,Ec为根据应变沿梁高分布计算得到的抗弯弹性模量,括号内数值为计算值Ec相对于测量值Em的相对误差。Notes: y0 is average distance from neutral axis to bottom of beam at ultimate load, Em is measured modulus of elasticity in bending, Ec is calculated modulus of elasticity in bending based on strain distribution along depth of beam. There are relative errors between Ec and Em in brackets.  下载: 导出CSV
表 2 不同载荷时无疵木梁的中性轴位置与压应变区域和拉应变区域的面积
Table 2 Location of neutral axis and area of compressive and tension strain region for clear beam under different loads
载荷阶段
Load stage载荷值
Load/kNy0/mm Ac/AI At/AI Ac/At 25%Fmax 0.76 10.63 0.47 0.53 0.88 50%Fmax 1.52 10.49 0.48 0.52 0.91 75%Fmax 2.28 9.97 0.51 0.49 1.01 Fmax 3.06 9.29 0.54 0.46 1.15 注:Ac为压应变区域的面积,At为拉应变区域的面积,AI为研究区域的面积。Ac is area of compressive strain region, At is tension strain region, AI is area of area of interest. Same as below.
下载: 导出CSV
表 3 不同载荷时孔洞位于中心的木梁的中性轴位置与压应变区域和拉应变区域的面积
Table 3 Location of neutral axis and area of compressive and tension strain region for beam with a hole located at center under different loads
载荷阶段
Load stage载荷值
Load/kNy0/mm Ac/AI At/AI Ac/At 25%Fmax 0.67 11.10 0.44 0.56 0.80 50%Fmax 1.34 10.92 0.45 0.55 0.83 75%Fmax 2.01 10.18 0.49 0.51 0.96 Fmax 2.67 8.83 0.55 0.45 1.27
下载: 导出CSV
表 4 不同载荷时孔洞位于受压区的木梁的中性轴位置与压应变区域和拉应变区域的面积
Table 4 Location of neutral axis and area of compressive and tension strain region for beam with a hole located at compression zone under different loads
载荷阶段
Load stage载荷值
Load/kNy0/mm Ac/AI At/AI Ac/At 25%Fmax 0.60 10.03 0.49 0.51 0.99 50%Fmax 1.19 7.85 0.60 0.40 1.55 75%Fmax 1.79 6.55 0.67 0.33 2.05 Fmax 2.38 5.91 0.70 0.30 2.38
下载: 导出CSV
表 5 不同载荷时孔洞位于受拉区的木梁的中性轴位置与压应变区域和拉应变区域的面积
Table 5 Location of neutral axis and area of compressive and tension strain region for beam with a hole located in tension zone under different loads
载荷阶段
Load stage载荷值
Load/kNy0/mm Ac/AI At/AI Ac/At 25%Fmax 0.73 10.58 0.47 0.53 0.89 50%Fmax 1.47 10.25 0.48 0.52 0.95 75%Fmax 2.20 9.77 0.51 0.49 1.05 Fmax 2.93 9.37 0.53 0.47 1.13
下载: 导出CSV
-
[1] 廖春晖, 张厚江, 黎冬青, 等.古建筑圆柱形木构件内部缺陷筛查方法研究[J].北京林业大学学报, 2013, 35 (1): 123-126. http://j.bjfu.edu.cn/article/id/9864 LIAO C H, ZHANG H J, LI D Q, et al. Screening method of internal defects in cylindrical wood members of ancient architectures[J].Journal of Beijing Forestry University, 2013, 35 (1): 123-126. http://j.bjfu.edu.cn/article/id/9864
[2] 徐华东, 王立海.局部缺陷对木梁动弹性模量的影响[J].建筑材料学报, 2011, 14 (5): 653-658. doi: 10.3969/j.issn.1007-9629.2011.05.015 XU H D, WANG L H. Effect of local defects on dynamic modulus of elasticity of wood beams[J]. Journal of Building Materials, 2011, 14 (5): 653-658. doi: 10.3969/j.issn.1007-9629.2011.05.015
[3] 崔英颖, 张厚江.木材节子个数与其振动模态参数关系的研究[J].木材加工机械, 2006, 17(5): 5-9. doi: 10.3969/j.issn.1001-036X.2006.05.002 CUI Y Y, ZHANG H J. Study on the relationship of number of wood knots and parameters of wood vibrational mode[J]. Wood Processing Machinery, 2006, 17 (5): 5-9. doi: 10.3969/j.issn.1001-036X.2006.05.002
[4] KOLLMANN F F P, COTE W A, Jr. Principles of wood science and technology I: solid wood[M]. Berlin: Springer-Verlag, 1968.
[5] BUKSNOWITZ C, HACKSPIEL C, HOFSTETTER K, et al. Knots in trees: strain distribution in a naturally optimised structure[J]. Wood Science and Technology, 2010, 44 (3): 389-398. doi: 10.1007/s00226-010-0352-4
[6] 陈国, 张齐生, 黄东升, 等.腹板开洞竹木工字梁受力性能的试验研究[J].湖南大学学报(自然科学版), 2015, 42(11): 111-118. doi: 10.3969/j.issn.1674-2974.2015.11.016 CHEN G, ZHANG Q S, HUANG D S, et al. Experimental study on mechanical performance of OSB webbed bamboo I shaped joist with web openings[J]. Journal of Hunan University (Natural Sciences), 2015, 42(11): 111-118. doi: 10.3969/j.issn.1674-2974.2015.11.016
[7] ARDALANY A, FRAGIACOMO M, DEAM B, et al. Analytical cracking load estimation of laminated veneer lumber (LVL) beams with holes[J]. European Journal of Wood and Wood Products, 2013, 71 (1): 37-48. doi: 10.1007/s00107-012-0646-3
[8] BETTS S C, MILLER T H, GUPTA R. Location of the neutral axis in wood beams: a preliminary study[J]. Wood Material Science and Engineering, 2010, 5(3/4): 173-180.
[9] DAVIS P M, GUPTA R, SINHA A. Revisiting the neutral axis in wood beams[J]. Holzforschung, 2012, 66 (4): 497-503. http://www.wanfangdata.com.cn/details/detail.do?_type=perio&id=10.1515/hf.2011.180
[10] VOIGT L R. Location of the neutral axis in wood beams with multiple knots[D]. Corvallis: Oregon State University, 2011.
[11] MILLER T H. Location of the neutral axis in wood beams[D]. Corvallis: Oregon State University, 2007.
[12] ZHANG Z X, SHEN Q, GOU X F. Influence of the movement of the neutral axis on the relation between the critical current and strain in bending Bi2223/Ag composite tapes[J]. Journal of Superconductivity and Novel Magnetism, 2015, 28 (12): 3535-3543. doi: 10.1007/s10948-015-3226-z
[13] BAŽANT Z, JIRÁSEK M. Inelastic analysis of structures[M]. West Sussex: John Wiley & Sons, Ltd., 2002: 351-353.
-
期刊类型引用(4)
1. 郭松彪,段绍伟,李文勇,罗群,兰宇晖. 不同径高比下制孔木梁力学性能试验研究. 黑龙江工业学院学报(综合版). 2024(08): 117-122 .  百度学术
百度学术
2. 贾文斌,孟昭博,王春雷,张立伟,高志伟,荣珂欣. 木梁加固方法研究进展. 低温建筑技术. 2023(11): 98-101 . 百度学术
3. 陈超意,李万兆,梅长彤. 应用环境对OSB抗弯性能的影响研究. 北京林业大学学报. 2022(06): 128-134 . 本站查看
4. 欧自娜,张厚江,管成. 古建筑七架梁缺陷安全性影响数值模拟研究. 北京林业大学学报. 2020(04): 142-154 . 本站查看
其他类型引用(8)


计量
- 文章访问数: 1772
- HTML全文浏览量: 358
- PDF下载量: 56
- 被引次数: 12
